
Observability: The Complete Guide (2026)
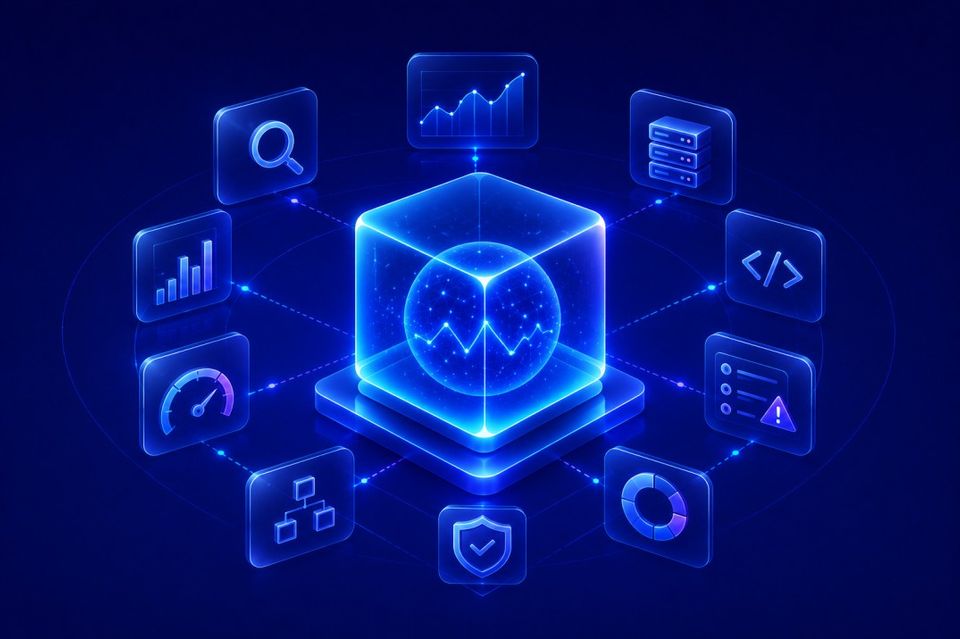
When something breaks in a distributed system, "is it down?" is the easy question. "Why is it down, and where exactly?" is the one that actually costs engineering teams time. Observability is the practice and the tooling built to answer that second question, and it's become one of the most important disciplines in modern software operations.
Table of Contents
- What is observability?
- What problems does observability solve?
- The three pillars of observability
- Observability vs monitoring
- How observability works
- Components of an observability platform
- OpenTelemetry architecture
- How observability reduces MTTR
- Observability maturity model
- Common implementation mistakes
- Observability for Kubernetes
- Observability for microservices
- Observability for platform engineering
- AI and observability
- Real-world observability examples
- Choosing an observability platform
- The future of observability
What is observability?
Observability is the ability to understand a system's internal state by examining the data it produces including logs, metrics, and traces without shipping new code to investigate a problem. It tells you not just that something broke, but why.
The term comes from control theory, where a system is "observable" if its internal state can be inferred from its external outputs. Applied to software, that means: if your checkout service starts timing out at 2 a.m., can your team figure out why right now, from the data already flowing out of the system or do you have to guess, add debug logging, redeploy, and wait for it to happen again?
Observability matters most in distributed systems such as microservices, serverless functions, containerized workloads on Kubernetes where a single user request might touch a dozen services before returning a response. Traditional monitoring, built for simpler, more predictable architectures, wasn't designed to answer questions nobody thought to ask in advance. Observability was.
What problems does observability solve?
Most teams don't adopt observability because it sounds good in a blog post — they adopt it because a handful of specific, expensive problems keep recurring:
- Unknown unknowns. Traditional dashboards only surface the failure modes someone anticipated. Observability lets you ask new questions of your data after an incident starts, not just before.
- Slow incident response. Without correlated telemetry, engineers manually jump between five different tools like logs here, metrics there, tracing in a third system which leads to losing time during an active outage.
- Alert fatigue. Threshold-based alerts without context train teams to ignore notifications, which means real incidents get missed.
- Blind spots across service boundaries. In a microservices architecture, a slowdown in one service can be caused by a dependency three hops away which is invisible without distributed tracing.
- Proving reliability to the business. SLOs and error budgets need real data behind them; observability is what supplies it.
The three pillars of observability
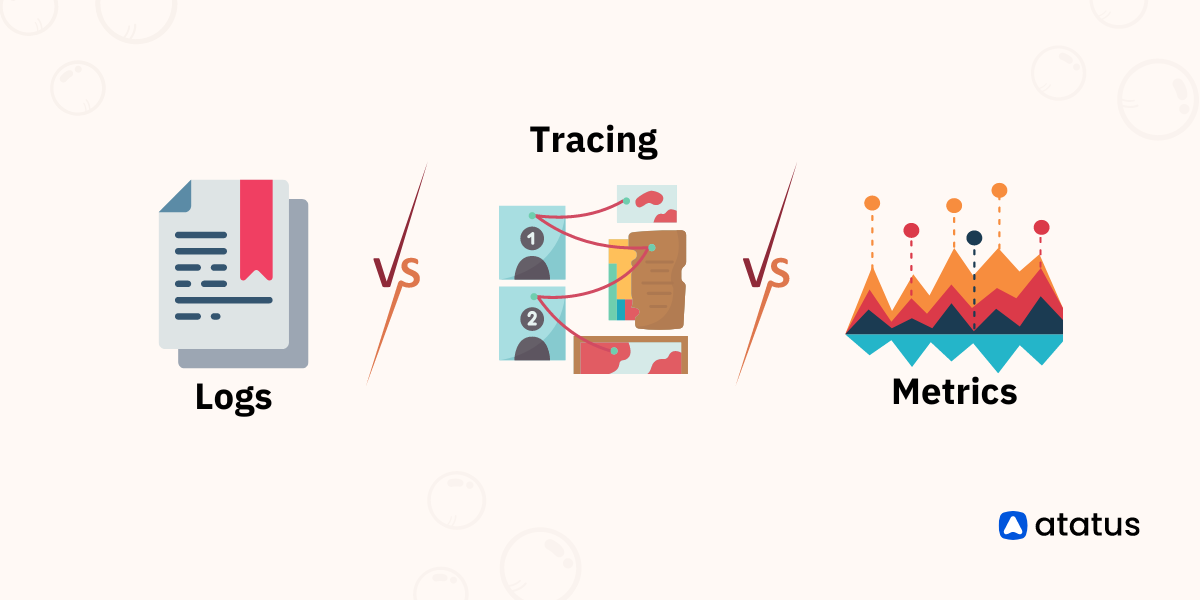
The three pillars of observability are logs (discrete, timestamped event records), metrics (numerical measurements aggregated over time), and traces (the end-to-end path of a single request across services). Together, they answer what happened, how often, and where.
Logs
Logs are recordings of discrete events such as a request received, an error thrown, a job completed captured automatically as your application runs. They can be unstructured plain text or structured (JSON) events, and structured logging is now the standard for anything you plan to query at scale. Logs are the most granular of the three pillars: when metrics tell you something is wrong, logs are usually where you go to find out exactly what.
Strengths: available almost everywhere, no manual instrumentation required, and rich in detail during an active incident.
Limitation: at high volume, unmanaged logs get expensive to store and slow to search which is why a log management strategy matters as much as logging itself.
Metrics
Metrics are numerical measurements such as request rate, error rate, latency, CPU usage, recorded at regular intervals and typically visualized as time-series graphs. Tools like Prometheus and Grafana are the most common open-source combination for collecting and visualizing metrics, though most commercial observability platforms bundle this natively.
Strengths: cheap to store, fast to query, easy to alert on.
Limitation: metrics tell you a threshold was crossed, they rarely tell you why on their own.
Traces
A trace follows a single request as it moves through every service it touches, broken into individual "spans" that record timing and metadata at each step. Distributed tracing tools such as Jaeger and Zipkin (both open-source) or a built-in APM tracer make it possible to see exactly which service, database call, or downstream dependency added the extra 400ms to a slow request.
Strengths: the only pillar that shows causality across service boundaries.
Limitation: requires instrumentation at every hop; gaps in trace propagation create blind spots.
Observability vs monitoring
Monitoring tells you when a known problem occurs, using predefined dashboards and alerts. Observability lets you investigate unknown problems by exploring raw telemetry data, making it better suited to complex, distributed, and frequently changing systems.
| Monitoring | Observability | |
|---|---|---|
| Answers | Is something wrong? | Why is something wrong? |
| Data model | Predefined dashboards and alerts | Raw, explorable telemetry (logs, metrics, traces) |
| Best suited for | Known, stable failure modes | Novel, unpredictable issues in dynamic systems |
| Investigation style | Reactive — wait for a threshold breach | Exploratory — ask new questions on the fly |
| Typical tools | Uptime checkers, basic dashboards | APM platforms, OpenTelemetry-based stacks |
These aren't competing approaches, monitoring is a subset of what a mature observability practice does. Most teams keep monitoring for the well-understood, high-frequency checks (is the server up, is disk space low) and layer observability on top for everything that requires actual investigation.
Why teams choose Atatus?
Atatus combines logs, metrics, and traces in a single dashboard instead of three separate tools you have to stitch together mid-incident.
How observability works?
Observability works by collecting telemetry suach as logs, metrics, and traces from every part of a system, correlating that data, and surfacing it through dashboards, alerts, and query tools so engineers can trace an issue from symptom to root cause.
In practice, that breaks down into a repeatable loop:
- Instrument your application and infrastructure with an agent or OpenTelemetry SDK.
- Collect telemetry through a pipeline that batches, filters, and routes it.
- Store logs, metrics, and traces in a queryable backend.
- Correlate the three pillars so a slow trace, a spiking error metric, and the log line that explains it are viewable together.
- Alert and visualize based on service-level objectives, not arbitrary thresholds.
- Investigate this is the step traditional monitoring skips, and where observability earns its keep.
Components of an observability platform
A modern observability platform is more than "logs plus metrics plus traces." The full stack typically includes:
- APM (Application Performance Monitoring) - code-level performance visibility, transaction traces, and error tracking.
- Infrastructure monitoring - CPU, memory, disk, and network telemetry for servers and containers.
- Real User Monitoring (RUM) - actual end-user experience data from browsers and mobile apps.
- Synthetic monitoring - scripted checks that simulate user journeys to catch problems before real users do.
- Error tracking — deduplicated, grouped exceptions with stack traces and affected-user counts.
- Observability / telemetry pipeline - the routing layer (often OpenTelemetry Collector-based) that processes data before it reaches storage, letting teams filter noise and control cost.
- Log management - centralized, searchable storage for structured and unstructured logs.
OpenTelemetry architecture
OpenTelemetry has become the de facto instrumentation standard because it decouples how you generate telemetry from where you send it. The architecture has three main parts:
- SDKs - language-specific libraries that instrument your application code to emit logs, metrics, and traces in a standard format.
- Collector - a standalone service that receives, processes (batches, filters, redacts), and exports telemetry to one or more backends.
- Exporters - connectors that send processed telemetry to your observability platform of choice, whether that's Atatus, an open-source stack like Prometheus and Jaeger, or another vendor.
The practical upside for teams: instrument once with OTel, and you can switch or add observability backends later without re-instrumenting every service.
How observability reduces MTTR?
Observability reduces mean time to resolution (MTTR) by correlating logs, metrics, and traces automatically, cutting the manual work engineers spend piecing together what happened during an incident, and pointing directly at the root cause instead of the symptom.
A typical incident without observability looks like: an alert fires on a metric, an engineer opens a log dashboard in a different tool, greps for errors around the right timestamp, then manually traces which upstream service might be responsible. Each handoff between tools adds minutes and minutes add up to real downtime cost during a customer-facing outage.
With correlated telemetry, that same investigation becomes: alert fires → click through to the exact trace → see the span that's slow → jump straight to the log line from that span. The tool work is compressed from multiple context switches into one.
Talk to us about cutting MTTR
See how teams use Atatus to go from alert to root cause without switching tools mid-incident
Observability maturity model
Most organizations move through recognizable stages on the way to full observability:
- Reactive monitoring - basic uptime checks and threshold alerts; no correlation between tools.
- Centralized telemetry - logs, metrics, and traces exist but live in separate systems that engineers manually cross-reference.
- Correlated observability - all three pillars are unified in one platform, searchable and cross-linked.
- SLO-driven observability - alerts and dashboards are built around service-level objectives and error budgets, not arbitrary thresholds.
- Proactive / AI-assisted observability - anomaly detection and automated correlation surface problems before they're customer-visible.
Most teams evaluating a new observability platform are sitting somewhere between stage 2 and 3 which is also where the ROI of consolidating tools is highest.
Common implementation mistakes
- Instrumenting everything at once. Start with the highest-traffic or highest-incident-rate services, not the entire codebase on day one.
- Threshold-only alerting. Alerts without context are a leading cause of alert fatigue; tie alerts to SLOs and include enough data to act without a second tool.
- Treating logs as infinite and free. Unmanaged log volume is one of the most common budget surprises in observability adoption, filter and sample early.
- Skipping trace propagation across services. A single un-instrumented hop breaks the trace and recreates the exact blind spot observability is meant to remove.
- No ownership model. Without a clear owner for dashboards, alert rules, and instrumentation standards, observability tooling degrades into noise within a few months.
Observability for Kubernetes
Kubernetes adds a layer of abstraction that traditional server monitoring wasn't built for: pods are ephemeral, workloads get rescheduled across nodes, and a resource-starved pod might get killed and restarted before a human ever sees a dashboard. Effective Kubernetes observability needs to cover:
- Cluster and node-level metrics (CPU/memory pressure, node health)
- Pod-level metrics and events (restarts, OOMKills, scheduling failures)
- Control plane health (API server latency, etcd performance)
- Application-level traces that follow requests across pods and services, not just within one
Observability for microservices
Microservices distribute logic across many independently deployed services, which makes distributed tracing, not logs or metrics alone, the critical pillar for understanding where a request slowed down or failed across service boundaries.
In a monolith, a stack trace usually tells you everything. In a microservices architecture, the same failure might originate in a service three hops upstream, behind a service mesh like Istio or Envoy. Observability for microservices depends on consistent trace context propagation across every service boundary, plus service dependency mapping so teams can see, at a glance, which services a slow request actually touched.
Observability for platform engineering
As organizations build internal developer platforms, observability increasingly becomes a platform-team responsibility rather than something each product team reinvents. That typically means standardizing instrumentation (often via OpenTelemetry) across all internal services, providing paved-road dashboards and alerting templates by default, and giving product teams self-service access to their own telemetry without needing to become observability experts themselves.
AI and observability
AI observability (sometimes called AIOps) applies machine learning to telemetry data for anomaly detection, automatic correlation across logs, metrics, and traces, and suggested root causes, reducing the manual investigation work engineers do during an incident.
Instead of a human noticing a metric anomaly and manually cross-referencing logs and traces, AI-assisted observability platforms increasingly do that correlation automatically, surfacing a ranked list of likely root causes the moment an anomaly is detected. This doesn't remove the need for good instrumentation, it makes good instrumentation more valuable, since AI correlation is only as good as the telemetry it has to work with.
Real-world observability examples
E-commerce checkout latency: A spike in cart-abandonment metrics leads to a trace showing a third-party payment gateway call adding 1.2 seconds intermittently, invisible in logs alone, since the calls were succeeding, just slowly.
SaaS API rate-limit errors: Error-tracking data groups a sudden wave of 429 responses to a single customer's integration, letting support reach out proactively before the customer files a ticket.
Kubernetes memory pressure: Pod-level metrics show recurring OOMKills that infrastructure monitoring alone attributed to "node instability", trace and log correlation reveals a memory leak in one specific service version.
Choosing an observability platform
Widely used observability tools include Atatus, Datadog, New Relic, Dynatrace, Grafana, and Splunk, alongside the open-source OpenTelemetry standard for instrumentation. Teams typically choose based on stack coverage, pricing model, and ease of integration.
| Consideration | What to check |
|---|---|
| Stack coverage | Does it cover your languages, frameworks, and Kubernetes setup out of the box? |
| Unified vs. siloed | Are logs, metrics, and traces in one dashboard, or three separate products bolted together? |
| Pricing model | Per-host, per-GB, or flat tier — and how predictable is it at your growth rate? |
| OpenTelemetry support | Can you instrument once with OTel and avoid vendor lock-in later? |
| Time to first value | How long from signup to your first working dashboard? |
If you're actively comparing vendors, see how Atatus stacks up against Datadog, New Relic, and Dynatrace on these exact criteria.
The future of observability
Three trends are shaping where observability goes next: wider OpenTelemetry adoption as the default instrumentation layer across the industry; eBPF-based instrumentation, which captures kernel-level telemetry with far less overhead and no code changes; and AI-assisted correlation becoming a standard feature rather than a differentiator. The common thread across all three is less manual instrumentation work and faster paths from symptom to root cause.
See observability in action
One dashboard for logs, metrics, traces, RUM, and Kubernetes monitoring, no tool-switching mid-incident.
Frequently asked questions
1. Do I need separate tools for logs, metrics, and traces, or can one platform handle all three?
Most teams start with separate tools because that's how observability grew historically such as a logging tool, a metrics tool, a tracing tool. But stitching them together mid-incident is exactly the workflow that slows down MTTR. Unified platforms (Atatus included) correlate all three by default, so the question worth asking isn't "which tool is best at logs" but "which platform lets me go from alert to root cause without switching tabs."
2. How do I know if my team is ready for full observability, or if monitoring is still enough?
If your architecture is a monolith or a handful of stable services, mature monitoring may genuinely be sufficient. The signal to move to observability is usually behavioral, not architectural: if your team is spending more time figuring out why something broke than fixing it once found, or if incidents keep surfacing failure modes nobody predicted, that's the tell.
3. What's the real cost difference between an OpenTelemetry-based stack and a commercial APM platform?
OpenTelemetry itself is free, but "free instrumentation" isn't the same as "free observability", you still pay for storage, a collector to run and maintain, and engineering time to build the dashboards and alerting a commercial platform ships with out of the box. The honest comparison is total cost of ownership, not just license price.
4. Can observability actually reduce customer-facing downtime, or just help engineers investigate faster after the fact?
Both, but the downtime reduction comes indirectly from catching anomalies during the early, low-severity phase (via metrics and synthetic checks) before they escalate to full outages, not from a magic feature. AI-assisted anomaly detection is the piece most directly aimed at catching problems before customers do.
5. How much telemetry instrumentation is "enough" without overspending on data volume?
There's no universal number, but the practical heuristic is: instrument every service that has ever caused a customer-facing incident, then expand outward by traffic volume. Full-coverage-from-day-one is the single most common reason observability rollouts blow past their storage budget in month one.
#1 Solution for Logs, Traces & Metrics
 APM
APM
Kubernetes
Logs
Synthetics
RUM
Serverless
Security
More

![New Relic vs Splunk - In-depth Comparison [2026]](/blog/content/images/size/w960/2024/10/Datadog-vs-sentry--19-.png)
![New Relic vs Sentry - Which Monitoring Tool to Choose? [2026]](/blog/content/images/size/w960/2024/10/VS--1-.png)