How APM Can Improve Your Digital Customer Experience?
When a customer taps a button, submits a form or waits for a page to load, they’re not thinking about your backend architecture, microservices, or CDN; they want it to work instantly.
But when it doesn’t, the frustration is immediate. Maybe the app freezes. Maybe a checkout fails. Maybe the entire experience just feels laggy. And the worst part? They don't complain, they just leave the application.
Application Performance Management (APM) is how engineering and DevOps teams flip that narrative. It’s not just about tracking uptime. It’s about understanding how performance connects directly to user satisfaction and putting the tools in place to improve both. It monitors how applications behave in real time, identifies issues before users notice, and provides consistent performance metrics across environments.
Let’s break down how APM tools improve customer satisfaction at every level from faster response times to issue resolution for stronger brand loyalty.
What This Article Covers?
- Why Engineering Teams are Prioritizing APM?
- The Role of Application Performance Management (APM)
- How APM can Improve Customer Experience?
- Why Atatus Is the Best APM Tool for Engineering Teams?
- Conclusion: See the Full Picture, Not Just Metrics
- FAQs on APM
Why Engineering Teams are Prioritizing APM?
According to the research, the APM market is projected to reach over $13 billion by 2027, growing at a CAGR of 11.4%. APM adoption is growing rapidly among cloud-native and microservices-based architectures, especially in industries like e-commerce, finance, SaaS, and healthcare.
Organizations using APM software reported 30-50% faster incident resolution times and higher NPS (Net Promoter Score) compared to those without it.
With customer experience becoming the ultimate differentiator, companies are investing in Application Performance Management tools to gain real-time visibility, accelerate issue resolution, and ultimately boost customer retention.
The Role of Application Performance Management (APM)
Modern applications are composed of dozens (or hundreds) of services spanning frontend interfaces, backend APIs, third-party integrations, containers, and cloud infrastructure. It becomes nearly impossible to manage performance manually or through traditional monitoring alone.
This is where Application Performance Management (APM) plays a major role, not just as another observability tool, but as a strategic layer that bridges the gap between technical performance and customer experience.
Teams don’t just need more charts; they need answers:
- What’s breaking right now?
- What’s causing a performance regression post-deployment?
- Which errors are affecting the most users?
- Is this issue business-critical or just noise?
Answering these questions requires a clear, centralized view of your system’s behavior across services, deployments, and user impact.
Let’s say your team just pushed an update to the user dashboard. Minutes later, users begin reporting that the page takes too long to load. Without visibility into the full request flow, the root cause isn’t immediately clear.
With the right Application Performance Monitoring (APM) tool in place, you quickly trace the slowdown to a new API call introduced in the update. It’s triggering a database query that’s taking over 4 seconds to respond, especially for users with large datasets.
Instead of guessing or launching an internal war room, the Application Performance Monitoring (APM) tool pinpoints the issue in minutes. Your team rolls back the change or optimizes the query, and performance returns to normal before support tickets start coming in.
That’s the value of Application Performance Monitoring (APM). It helps your team quickly understand what’s going wrong, where it’s happening, and how to fix it before customers even notice.
How APM can Improve Customer Experience?
Application performance monitoring directly shapes how users experience your product. Here's how smart performance monitoring translates into tangible benefits for your users and your business:
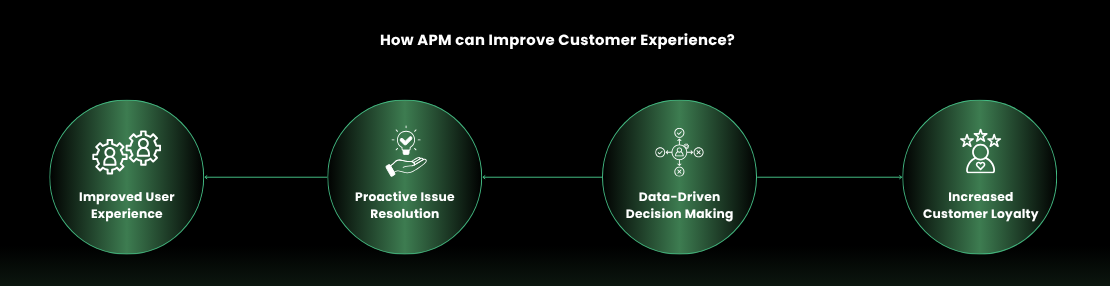
Improved User Experience
- Faster Response Times
When users interact with an application, every click or tap creates an expectation of instant response. Even a delay of two or three seconds can make a fast app feel frustrating.
Application Performance Monitoring (APM) helps track and analyze where time is being spent across each request from the frontend to the backend and identifies slow database queries, network latency, or code execution delays that are impacting responsiveness.
Example:
A news app notices a spike in bounce rates on article pages. With Application Performance Monitoring (APM) in place, the team discovers a slow-loading social share plugin that delays the initial render. Once removed, load times improve and user engagement increases.
- Reduced Downtime
Every minute of downtime is a moment where users can’t access your service, and it only takes one bad experience for some to leave permanently.
Application Performance Monitoring (APM) tools monitor the health of your application in real-time, identifying service failures or unresponsive endpoints the moment they occur, often before customers even report them.
Example:
An e-commerce site’s payment gateway intermittently fails during high traffic periods. APM detects a memory leak in the payment service that worsens over time. With early insights, the team patches the service before it crashes completely during a weekend sale.
💡 Also read: How to Reduce Application Downtime with APM?
- Enhanced Reliability
Users expect consistent performance. If an app feels fast one day and slow the next, trust erodes.
APM enables teams to benchmark performance across devices, locations, and release versions, helping ensure that updates and infrastructure changes don’t introduce regressions.
Example:
After a routine deployment, a video streaming platform starts buffering frequently for users in Southeast Asia. Application Performance Monitoring (APM) highlights that a CDN routing issue is increasing latency in that region. The team switches to an alternate provider, and the experience stabilizes.
Proactive Issue Resolution
- Early Issue Detection
Bugs don’t always show up in test environments. They emerge when real users interact with real data.
APM surfaces unusual error patterns, latency spikes, and failed transactions before they become widespread problems, giving teams a chance to fix them before users even notice.
Example:
A newly released feature in a SaaS platform throws occasional 403 errors when accessed from mobile. Application Performance Monitoring (APM) tool catches the spike within an hour of release, allowing the team to roll out a fix before support tickets start piling up.
- Faster Problem Resolution
When incidents do happen, every second counts. Teams need to pinpoint the cause, not spend hours digging through logs or guessing where the issue lies.
APM connects the dots across application layers, making it easier to trace the root cause and deploy a fix quickly.
Example:
A dashboard in a CRM tool starts timing out. APM traces the issue to a third-party analytics integration that hangs during response. Disabling the integration restores full functionality within minutes.
- Reduced Need for War Rooms
When issues are hard to diagnose, companies often pull in multiple teams to troubleshoot together - developers, SREs, QA, and even product managers. It’s stressful, time-consuming, and inefficient.
APM provides a shared, detailed view of system behavior, reducing the guesswork and making cross-team collaboration smoother and more focused.
Example:
During a login failure incident, instead of a multi-hour Zoom call with three teams, the APM dashboard immediately shows a failed connection to the authentication server. The backend team deploys a fix in under 15 minutes, with no finger-pointing required.
Data-Driven Decision Making
- Understanding User Behavior
Performance doesn’t just affect uptime; it affects how users navigate your product. If a page is slow, they’re more likely to leave or avoid using that feature altogether.
APM helps teams correlate performance metrics with user behavior, so you know which parts of the experience are causing friction.
Example:
A fintech app sees fewer users completing the loan application flow. APM reveals that one particular step, the income verification upload, is taking too long to load on mobile, causing users to drop off mid-process.
- Optimized Resource Allocation
Not all performance issues require scaling up infrastructure. Some just need a smarter fix.
APM shows how each component of your stack performs under real-world conditions, helping you decide whether you need more resources or just cleaner code.
Example:
A content platform faces slow response times during peak traffic. APM reveals it’s due to a few inefficient SQL queries, not CPU or memory limits. Instead of provisioning more servers, the team optimizes the queries, reducing load by 40%.
- Better Business Outcomes
Performance has a direct impact on business metrics like conversion rates, churn, average session duration, and customer satisfaction scores.
APM allows you to tie technical performance to real-world impact, helping teams make decisions that improve both engineering metrics and business KPIs.
Example:
A subscription-based learning app improves server response times by 30% through APM-driven optimizations. As a result, user session time increases, churn drops by 10%, and monthly active users hit a new high.
Increased Customer Loyalty
- Positive User Feedback
When apps perform smoothly, users notice even if they don’t say it outright. Faster, more reliable experiences lead to higher satisfaction, better reviews, and increased referrals.
Example:
After optimizing performance across its mobile onboarding flow, a food delivery app sees an uptick in 5-star reviews mentioning how “quick and easy” the sign-up feels. This boosts app store ranking and organic installs.
- Reduced Churn
Users don’t always give second chances. If your app is frustrating to use, even occasionally, they may silently stop using it.
Application Performance Monitoring (APM) tool helps you spot and resolve experience-breaking issues before they turn into long-term user loss.
Example:
An HR tech platform notices a gradual decline in active users. APM surfaces that a time tracking feature frequently fails during busy hours. Fixing the issue stabilizes usage and brings engagement back up.
- Stronger Brand Reputation
Customers judge your reliability by how consistently your app works. A stable, fast application builds trust and becomes part of your brand’s promise.
Example:
During a major product launch, a startup’s site experiences a brief traffic surge. Due to proactive monitoring and load testing supported by APM, the site remains stable. Users share their positive experience online, reinforcing the company’s reputation as reliable and user-first.
Why Atatus Is the Best APM Tool for Engineering Teams?
By this point, one thing is clear: performance problems don’t wait for the perfect moment. They surface mid-deployment, during traffic spikes, or worse when customers are depending on your app the most.
Atatus isn’t just another observability tool. It’s designed to help real teams in fast-paced environments, teams who can’t afford to waste hours in dashboards or wait days for support tickets to be resolved.
Here’s how Atatus quietly powers some of the most efficient engineering teams behind the scenes:
- Full-stack visibility from a single pane: Track every user request from the browser to your backend, database, and third-party services without switching tools.
- Real user data, not synthetic guesswork: Understand what actual customers are experiencing, including slow clicks, frontend errors, and session flow drop-offs.
- Pinpoint what’s slowing you down: Instantly surface the slowest endpoints, lagging database calls, and memory-hungry services that impact real users.
- Group errors by impact: Prioritize fixes based on how many users are affected, not just raw error volume.
- Built for high-velocity teams: Lightweight to install, easy to configure, and works seamlessly with your CI/CD, so you get insights from the first deploy.
- Alerts that respect your time: Get notified only when it matters, with customizable thresholds and smart anomaly detection.
- No overcomplicated setup: Start monitoring in minutes with agents for PHP, Node.js, Python, Java, Go, and more without digging through endless documentation.
If you care about user experience, performance clarity, and faster resolution times, Atatus gives your team everything it needs and nothing it doesn’t.
Conclusion: See the Full Picture, Not Just Metrics
Every performance issue is a customer story interrupted whether it’s a failed login, a stalled checkout, or a slow dashboard at the worst possible moment. Users rarely complain; they just stop coming back.
That’s why Application Performance Monitoring (APM) tools aren’t optional; it’s how modern teams build trust at scale. It gives your engineers the context to resolve issues before they spread, optimize what matters most, and confidently ship features without breaking the experience.
With Atatus, you don’t just watch metrics - you understand the impact behind them.
See it in action. Start your free trial or book a demo to explore what’s really happening inside your application.
FAQs on APM
1) What Happens When You Don’t Have Proper APM?
without proper APM in place, your team is stuck in a dangerous loop:
- You find out about issues after customers do.
- You spend late nights digging through logs and piecing together dashboards from five different tools.
- Your alerts are either too noisy or too silent.
- You release features faster, but confidence in stability drops.
- Most dangerously, you’re flying blind on how performance impacts churn or user sentiment.
2) Which monitoring tool is best?
It depends on your needs, but teams that want real-time visibility, fast onboarding, and full-stack observability without bloated complexity often choose Atatus.
3) How do you test the efficiency of an app?
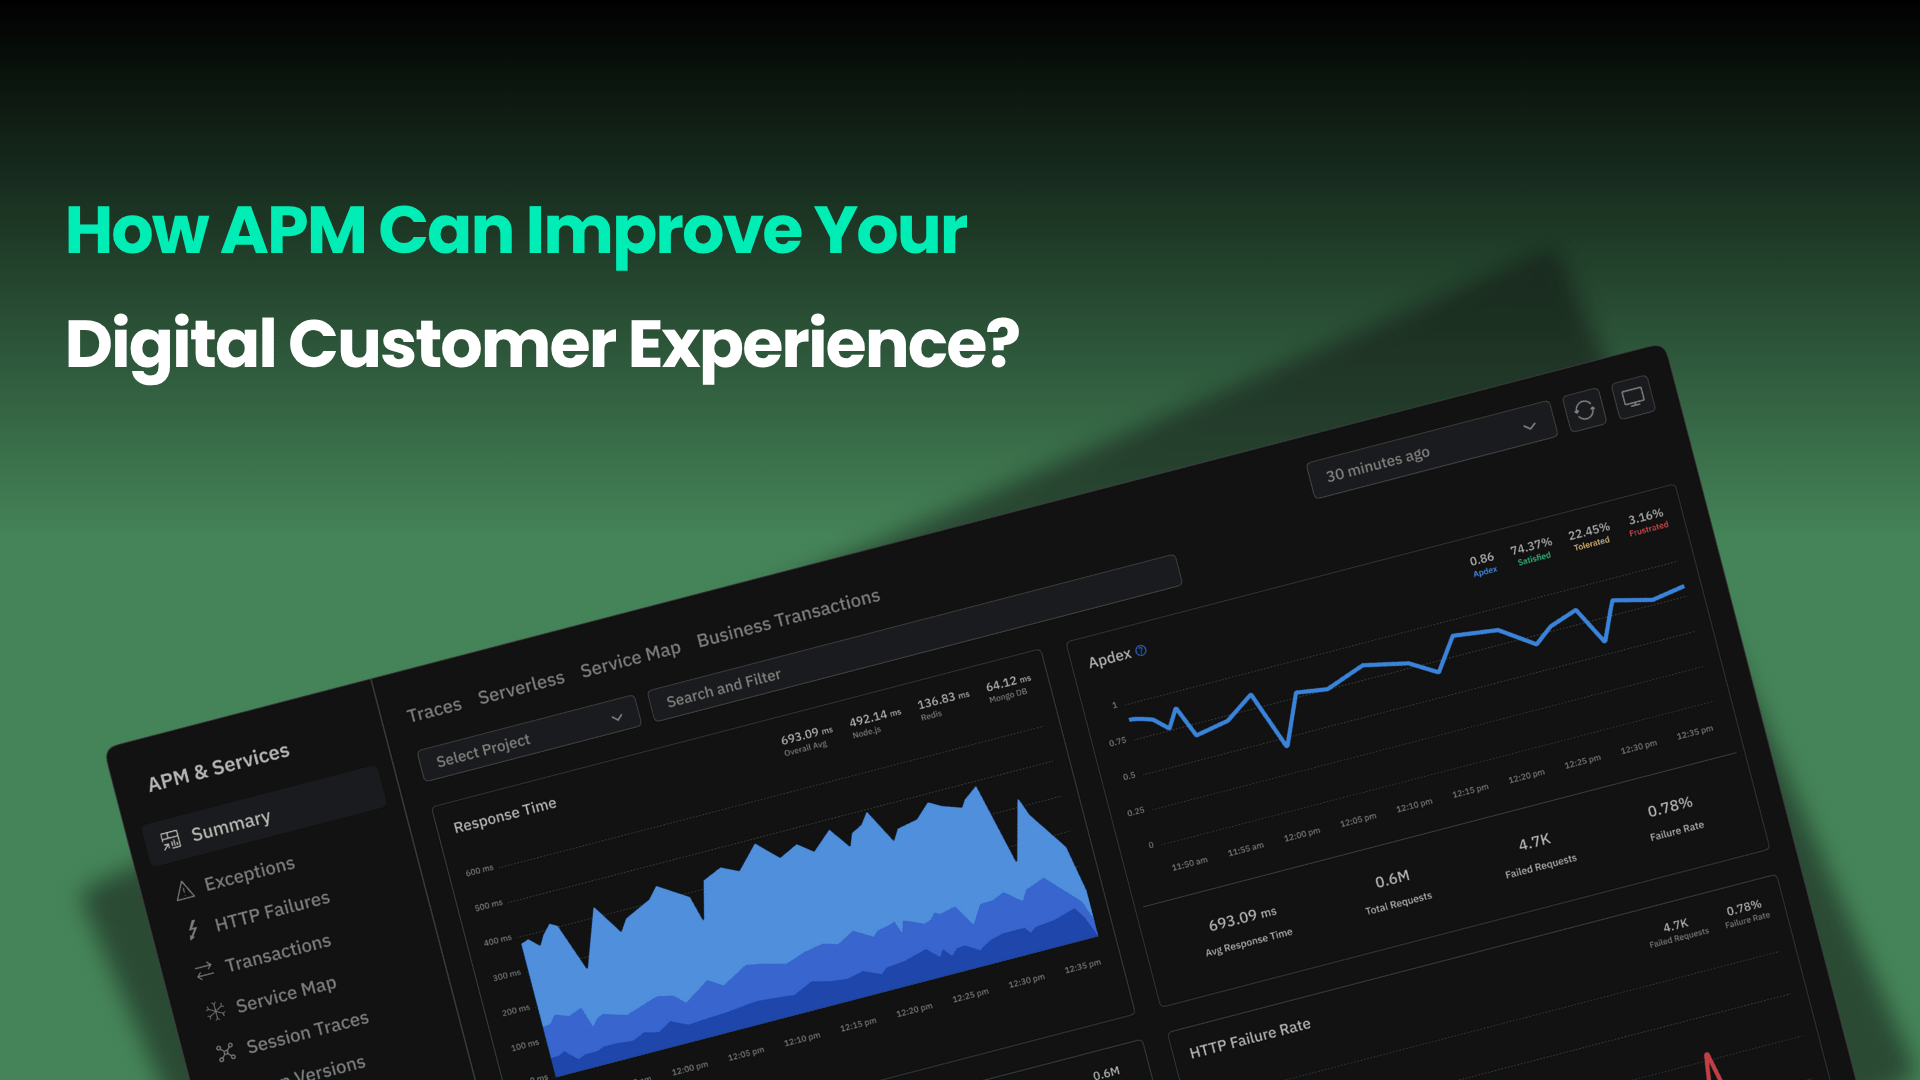
Track metrics like response times, error rates, Apdex scores, and throughput using APM software. These tell you exactly how well your app performs in the wild.
4) What metrics should I track with APM?
APM Focuses on:
- Transaction latency
- Error rates
- Database query times
- User satisfaction (Apdex)
- Third-party service performance
5) Is APM just for big teams?
Nope. Startups, solo devs, and mid-sized teams can benefit hugely from APM tool, especially tools like Atatus that offers transparent pricing and quick setup.
#1 Solution for Logs, Traces & Metrics
![]() APM
APM
![]() Kubernetes
Kubernetes
![]() Logs
Logs
![]() Synthetics
Synthetics
![]() RUM
RUM
![]() Serverless
Serverless
![]() Security
Security
![]() More
More


![New Relic vs Splunk - In-depth Comparison [2026]](/blog/content/images/size/w960/2024/10/Datadog-vs-sentry--19-.png)