How to fix JavaScript Errors
Even if we have a good project plan and a logical concept, we will spend the majority of our time correcting errors. Furthermore, our application can run without obvious errors with JavaScript, we must use various ways to ensure that everything is operating properly.
The majority of JavaScript errors in our web applications will be eliminated if we understand both the syntax and how JavaScript works. Furthermore, numerous web services can help us in catching all of them.
We will go over the following:
- What is JavaScript?
- Types of Error
- How to Read Errors?
- Common JavaScript Errors
- Reload
- Verify JavaScript Is Turned On
- In-Browser Developer Tools
- Cross-Browser Compatibility
- Display Anticipated Results Using Console.log()
What is JavaScript?
Javascript has grown in popularity as one of the most versatile and widely used programming languages on the internet. It was created to allow users to interact with client-side scripts.
Since then, it has grown in popularity as a programming language for both game development and desktop application development. An IDE (integrated development environment) is widely used to write and debug JavaScript code. To write and edit JavaScript code, you can use JavaScript editors like Aptana Studio.
Types of Error
In general, there are two types of errors that you'll encounter while doing something wrong in code:
- Syntax Errors
These are spelling errors in your code that cause the program to either not run at all or stop operating in the middle - you'll generally get some error messages as well. These are usually simple to solve as long as you have the necessary tools and understand the error messages. - Logic Errors
These are errors in which the syntax is accurate but the code is not what you meant, resulting in a program that runs but produces wrong results. Because there is frequently no error message to point you to the root of the error, these are often more difficult to resolve than syntax errors.
Read Types of Exceptions in Java.
How to Read Errors?
Let's take a quick look at the structure of an error message before moving on to the list. Understanding the structure will help you comprehend the errors, and you'll have fewer issues if you encounter any errors that aren't stated here.
The following is an example of a Chrome error:
Uncaught TypeError: undefined is not a functionThe following is the structure of the error:
- Uncaught TypeError
This part of the message is rarely useful. The error was not caught in a catch statement, and TypeError is the name of the error. - undefined is not a function
This is where the message goes. When it comes to error messages, you must take them literally. In this situation, for example, it signifies that the code attempted to invoke a variable which is not a a function.
Safari and other webkit-based browsers display errors in a similar way to Chrome. Firefox errors are similar but do not necessarily include the first part, and recent versions of Internet Explorer likewise produce simpler errors than Chrome — however simpler does not automatically imply better in this situation.
Common JavaScript Errors
- Not Using Braces (if and while statements)
When there is only one line of code in an if or while statement, braces can be skipped. However, this can make the code confusing, making it difficult to read at times. - Not Using DOM Effectively
If you're adding a lot of elements to the DOM, don't do it all at once. As each element is added to the DOM, the browser is forced to redraw the entire page. - Omitting Semicolons
Semicolons are used to end statements in Javascript. As a result, a semicolon must be used at the end of every JavaScript statement. Some individuals don't bother because the compiler automatically inserts semicolons. This is a little risky because most programming languages follow this convention, and there are some circumstances where the compiler won't automatically insert semicolons. - Using Global Variables
Variables in Javascript are global. This means they can be accessed from anywhere in the code, as well as from other files on the same page. This can result in unintended overwriting of values in the code. - Using == instead of ===
Using double-equals instead of triple-equals by mistake. The double-equals operator tries to match the two values by changing one of them.
Here are some solutions for fixing JavaScript issues in our applications, ranging from basic to advanced.
Reload
Reloading the web page is sometimes the simplest solution. It's the tried-and-true IT crowd solution: switch it on and off again.
Perhaps we've already fixed the issue, but the file hasn't yet been uploaded, or some data was missing. If your browser is saving a poor version of your website or application, it may also help to clear your history and cache.
When Google Chrome has trouble running our website, it will occasionally display an "Aw, Snap!" message. This could be due to a JavaScript error or it could not; in either case, don't panic and simply reload the website.
Verify JavaScript is Turned On
It's important to remember that JavaScript is configured differently in each browser. Furthermore, JavaScript behaves differently depending on the browser and how the user's browser settings are configured.
For example, JavaScript has certain security bugs, and hackers might inject dangerous code into some JavaScript. As a result, JavaScript is frequently disabled in various browsers for security concerns. Therefore, we need to check our browser settings to see if JavaScript is enabled.
Cross-site scripting (XSS) is a JavaScript vulnerability that allows malicious code to be injected into legitimate websites. The "StalkDaily" worm, for example, was used to infect Twitter.
That doesn't seem very appealing, does it?

As a result, turning off JavaScript prevents security issues while also causing failures while operating a JavaScript-based application.
Similarly, we can see if we have a pop-up blocker installed that is blocking us from using elements of our JavaScript, such as the alert boxes option. Using our browser settings or an add-on, we can allow or disable pop-up boxes.
Let's move on to some more advanced topics now that we've covered the fundamentals.
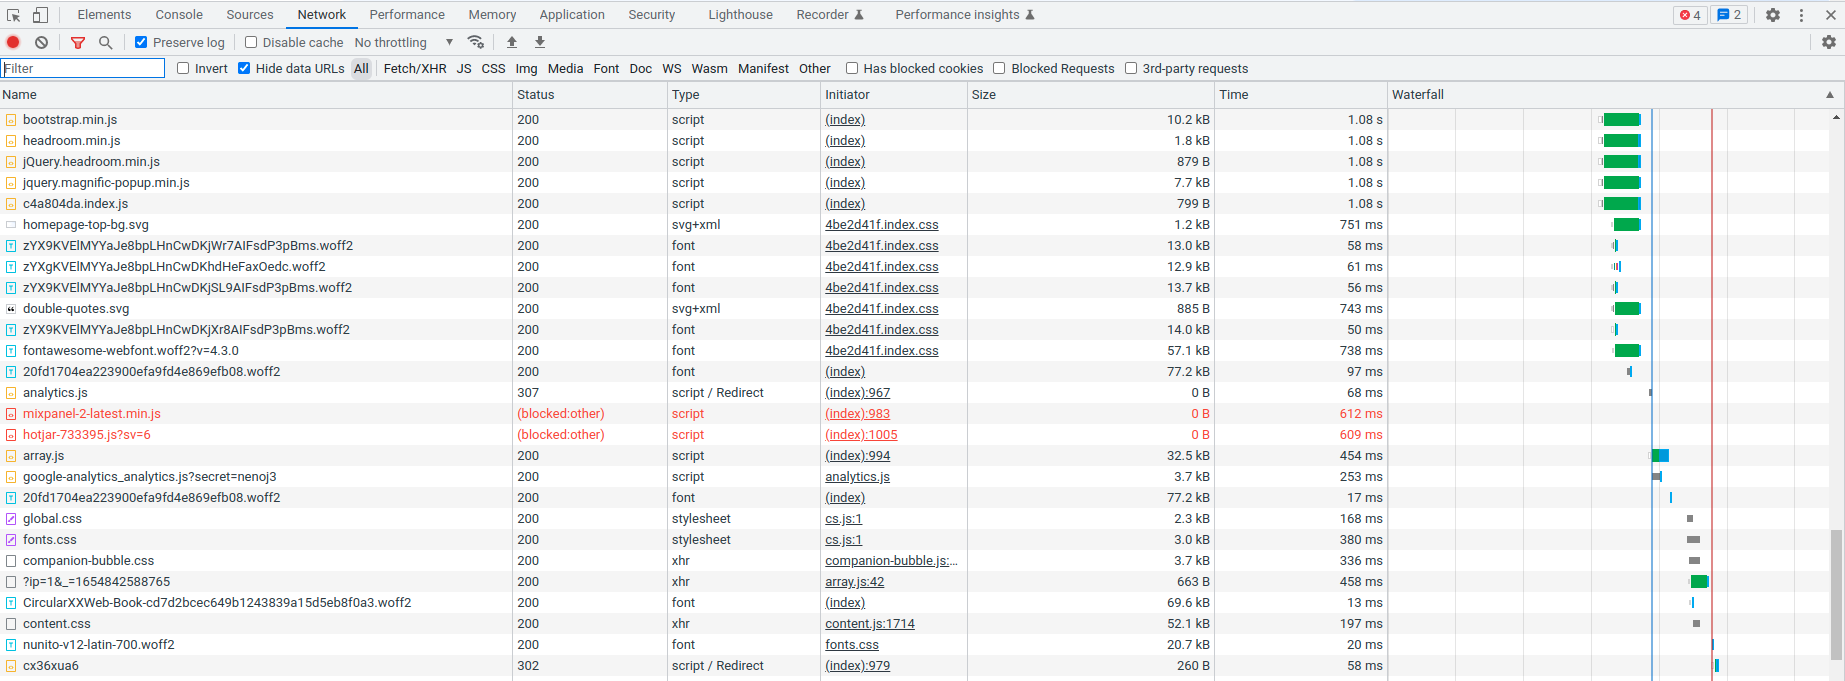
In-Browser Developer Tools
The in-browser developer tools are by far the most valuable tools we have for correcting JavaScript errors. Most young developers use Chrome to browse web projects. Currently, people use Firefox, Chrome, Safari, Microsoft Edge, Opera, or Brave, depending on their needs.
Firefox and Chrome were the most popular browsers among developers.
To get started, simply launch your chosen browser and look for the developer tools in the browser menu. Start by looking at the various parts or console tools to see if any errors need to be fixed.
Some development tools also allow us to check if our website design is mobile-friendly.
JavaScript errors can be checked with developer tools, as well as:
- Currently loaded HTML and CSS
- DOM explorer
- Layout
- Animations
- Memory use
- Console logs
- Debugger
- File list
- Source code
And, depending on the in-browser developer tool, many more.
Cross-Browser Compatibility
As we have stated, each browser handles JavaScript differently. This means that our application may not work in all browsers, and we'll have to address issues. Unfortunately, prompting a pop-up box to persuade visitors to download is not sensible. As a result, we must confirm that our websites are compatible with all internet browsers multiple times.
Cross-browser compatibility issues with JavaScript mainly concentrate around contemporary core JavaScript capabilities and some third-party or native JavaScript libraries.
So, either download each of the major browsers and test for browser compatibility one at a time or try out a variety of cross-browser compatibility testing software.
Display Anticipated Results Using console.log()
console.log() is a function that displays messages in the console of our browser. Furthermore, we print strings and other variables so that their values can be seen. This is a great way for us to see if our functions are returning the expected results.
These errors may not prevent our applications from running, but they are still functional errors that we must address.
We can, for example, define an event listener that checks if a specific button is pressed. When the onClick event triggers, a message displays in our console verifying that our function worked.
These tests should ideally be used only during the development stage of a web project, and console.log() events should be removed from the final result.
document.addEventListener('click', function (event) {
  console.log("Clicked!");
}, false);
Similarly, we may use JavaScript alert boxes in the same way.
document.addEventListener('click', function (event) {
   alert("I am in a box with a " + str + "!");
}, false);
Finally!!!
We should be able to fix our JavaScript errors with just a basic understanding of how JavaScript works and some basic coding principles. In addition to these abilities, we have access to hundreds of web resources that can help us in catching those more difficult errors.
Monitor Your JavaScript Applications with Atatus
Atatus keeps track of your JavaScript application to give you a complete picture of your clients' end-user experience. You can determine the source of delayed response times, database queries, and other issues by identifying backend performance bottlenecks for each API request.
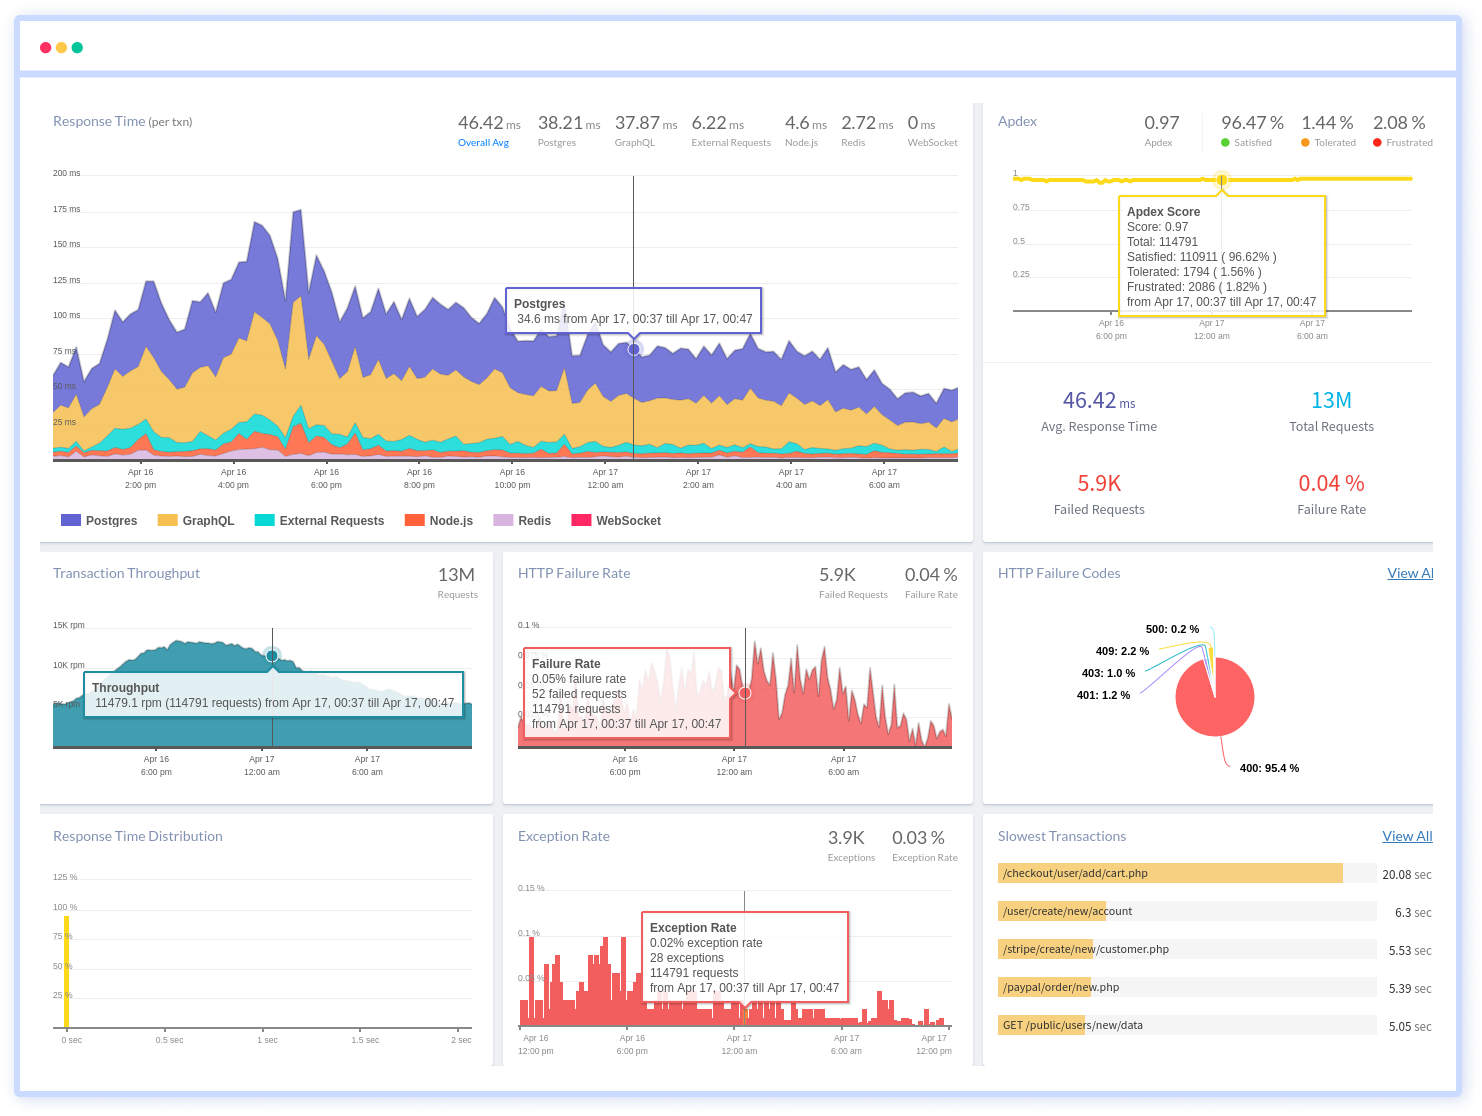
To make bug fixing easier, every JavaScript error is captured with a full stack trace and the specific line of source code marked. To assist you in resolving the JavaScript error, look at the user activities, console logs, and all JavaScript requests that occurred at the moment. Error and exception alerts can be sent by email, Slack, PagerDuty, or webhooks.
#1 Solution for Logs, Traces & Metrics
![]() APM
APM
![]() Kubernetes
Kubernetes
![]() Logs
Logs
![]() Synthetics
Synthetics
![]() RUM
RUM
![]() Serverless
Serverless
![]() Security
Security
![]() More
More