Logging with JavaScript: Basic Tips
In the past few years, JavaScript has evolved in several ways and has come a long way. With the evolving technology, machines are becoming more powerful, and browsers are getting more robust and compatible.
In addition, Node.js’s recent development for JavaScript’s execution on servers, JavaScript has been getting more and more popular than ever before.
Today, web developers continue to create more complex applications by pushing the boundaries with JavaScript execution and trying out new things.
A logging functionality is crucial for every programming language. Although JavaScript has a console.log for performing basic debugging functions, its browser’s console comes with several other functions to perform debugging.
As the scale of a codebase grows, one’s ability to efficiently debug a code gets increasingly critical. To learn more about multiple other debugging functions beyond console.log, have a look at this useful documentation for the browser console.
In today’s article, we shall see some of the crucial aspects of client-side JavaScript logging errors, client-side vs server-side logging, JavaScript built-in logging methods, and more. So, let’s get right into it.
#1 Client-side vs Server-side Logging
You have complete access to the console when you are doing local development. This access allows you to pursue stack traces, recreate errors, interpret cryptic error messages, and debug your heart’s content.
However, when the application or the page reloads, all of the console’s content disappears. Even though this is useful during the development process, one does not have access to the console’s messages once they have published or released their code, and it is already running on the user’s machine.
Therefore, in such situations having a way to send your code’s several error messages from a client to a server for whom you have access would be extremely useful.
A myriad of tools are available for such use cases and situations called logging frameworks. These tools gather or collect all the error messages occurring on the client-side and package them up effectively.
Then they are sent to a storage location for whom you have access once they are nicely bundled up.
Therefore, client-side logging directly brings the entire error management platform from the server you have access to the user’s browser.
However, when the logging is enabled on your server session and the software records the web browser’s behaviour on your server, it is referred to as server-side logging.
The unresolved errors on the client-side logging are automatically picked up and offer a piece of detailed information about the environment.
It bypasses logging to a developer’s server and instead logs the errors directly to the user or the client.
Such direct logging to the client is a beneficial tool to offer immediate support to the customers.
#2 How does JavaScript handle logging?
During the initial stage, developers often get comfortable with the console.log() function the first time they use JavaScript. When you put it on your desired location in a code, it provides contents and information of the term you put within the parentheses.
However, there is a complete array of methods on the console object that are usually underutilized but are extremely beneficial and useful.
Message Levels
JavaScript supports logging messages at several different levels, just like other programming languages. The logging message levels provided and supported by JavaScript are as follows:
1.) Plaintext
The method for plaintext is console.log() that outputs unstyled plain text, as the name suggests.
2.) Info
The method for this message level is console.info(). It typically outputs text with a blue background colour.
3.) Warn
The method for the warn message level is console.warn(). This level is similar to console.log(); however, they need more of the developer’s attention and often comes with stack traces to help you in the debugging as well. You can usually use a console.warn() warning when something unanticipated happens. It typically provides the output of text in a yellow background colour.
4.) Error
The method for error message level is console.error(). You can use a console.error() message when a huge or an application-breaking error happens. This message typically provides an output of a text with a red colour background.
Examples of these message levels are:
console.log("this is a log message");
console.warn("this is a warning message");
console.error("this is an error message");
These messages are nothing but simple cues for you to incorporate quick debugging in the console. They all work in the same common manner, apart from offering different messages and visual styling.
Message Grouping
Just like you write your code with proper grouping and structure, you can also structure your log output through message grouping. In order to create collapsible chunks of your log messages in the console, you can simply use console.group() and console.groupEnd() methods.
Separating log messages is difficult, especially when all of those are present in a common hierarchy within the console. However, through console.group(), you can improve your log message’s readability by organizing them into distinct groups.
console.group() and console.groupEnd() supports nesting, where console.group() accepts label as its parameter label, and messages that are placed between these two are grouped hierarchically and nicely.
For example, let us have a look at the following code:
console.group("This is a Group");
console.log("It is a first line");
console.log("It is a second line");
console.log("It is a third line");
console.groupEnd();
This code snippet will group the lines between console.group() and console.groupEnd() in an organized manner, under the heading “This is a Group Heading” for better visualization and improved text readability. This organized grouping of log messages also helps you find messages you require quickly, with no hassle, and without wasting your time scanning and scrolling.
Code Timing
We all will be excited to know what code timing is and how it will work. To know this you do not have to install any third-party tools.
Let us take an example of the following code:
console.time("Timer Test Process");

// perform some process here
console.timeEnd("Timer Test Process");
JavaScript provides three functions to let you experience stopwatch functionality in your browser’s console.
- console.time() - starts the timer with the “Timer Test Process” label.
- console.timeLog() - logs the current timer value.
- console.timeEnd() - stops the particular timer once the same “Timer Test Process” label is passed.
One can have thousands of timers at the same time on one page with different labels, once the console.timeEnd() function is called the timer is permanently deleted from the memory.
In case you further try to call console.timeEnd() again, it will throw a warning message at the output. Use this simple running time function with ease to know the code’s processes time while building your application.
Catch errors efficiently with try...catch...finally
JavaScript developers implemented a tool to efficiently handle an error-prone code with the help of a try...catch...finally statement.
The code snippet looks like this:
try {
    // code lines
}
catch (error) {
    // code to run for finding our any error
}
finally {
    // the code continues to run irrespective of the error presence
}
This statement enables you to enclose potentially error-prone code in a try block, catch, and logs an error if there is one, allowing the program to continue working in the finally block.
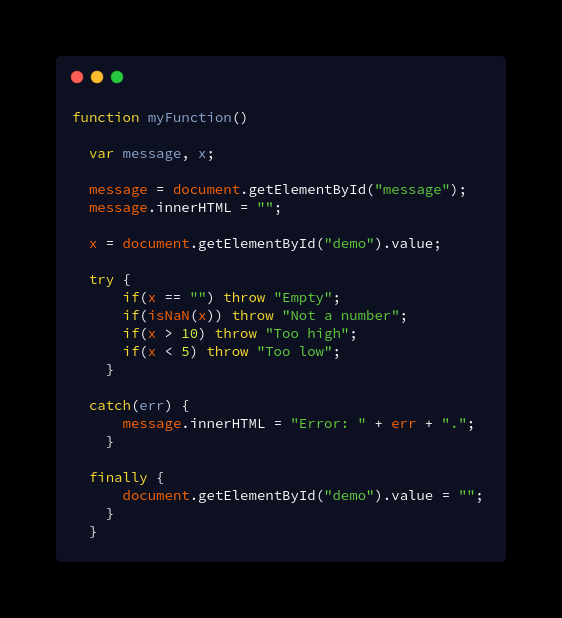
This statement and pattern help coders effectively create error boundaries with their programs to ensure that the program does not crash because of one or multiple errors.
Conclusion
Effectively and efficiently logging is one of the most crucial skills every web developer wish to possess. Client-side logging functionality is only a small part of the entire development process, yet an important part.
Using the logging functionalities helps developers develop codes more efficiently. To learn about more JavaScript functions found on the browser’s console, navigate to the MDN’S documentation to have an in-depth overview of them.
These are the key takeaways we learned in this article:
- If you want to make your log output more readable, use console.log() and its color-coded multiple variations during the development process.
- Logging activities can be streamlined and organized by using console.group() to eliminate the need to search through the console messages.
- Optimize your performance, identify bottlenecks, and check the time it takes a process code to run by using console.time(). Last but not least, use the try...catch...finally statement to reduce the chance of program-breaking and other harmful errors.
Monitor Javascript Errors with Atatus
Track entire JS errors that slows down your application and get to know the root-cause of the issue with the complete stack-trace and exact line of the code where an error has occurred with Atatus.
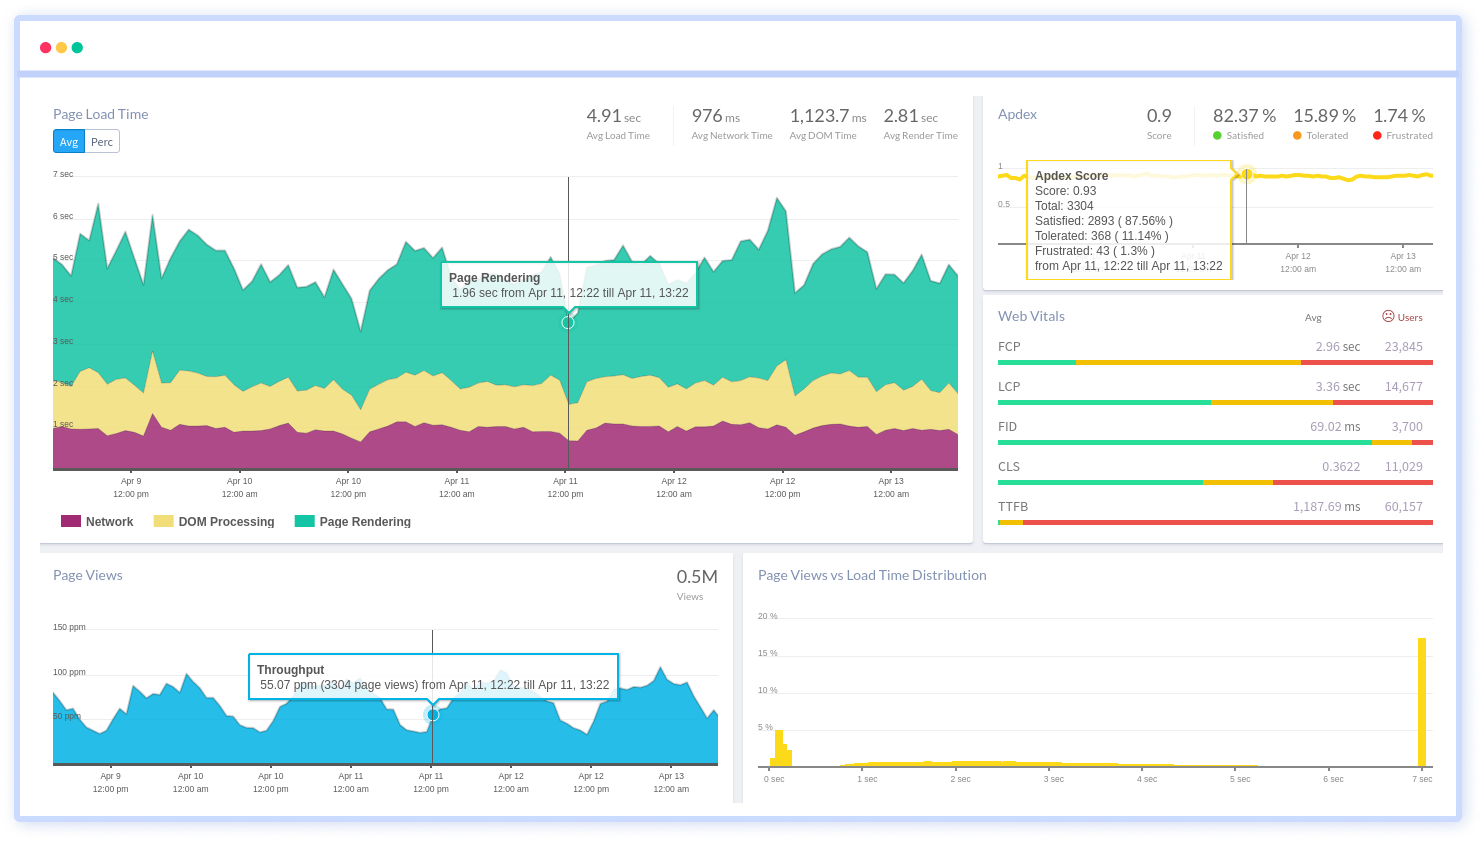
Features that Real User Monitoring offers:
- Google's Core Web Vitals
- Page Monitoring
- Single Page Application Monitoring(SPA)
- AJAX Monitoring
- User Journeys
- Error Tracking
With the above listed features you can monitor your complete front-end code and fix the issues at the right time to optimize end-user experience.
Sign Up for free. 14-day unlimited free trial. No credit card required!!!
Share your thoughts about Javascript Logging in the below comment section.
#1 Solution for Logs, Traces & Metrics
![]() APM
APM
![]() Kubernetes
Kubernetes
![]() Logs
Logs
![]() Synthetics
Synthetics
![]() RUM
RUM
![]() Serverless
Serverless
![]() Security
Security
![]() More
More