JVM Thread Insights: How to Spot and Diagnose Waiting Threads

JVM uses threads to execute every single operation. And during its lifetime, these threads can go through various stages. One such stage, where the threads are unable to move any further or are blocked from operating is called as the thread-waiting situation.
There are various scenarios in which a thread can enter a waiting state. Identifying and diagnosing thread-waiting situations is important for maintaining the performance and reliability of multithreaded applications.
These situations can lead to performance bottlenecks, unresponsiveness, or even application crashes. In the context of the JVM, analyzing thread dumps, monitoring thread states, and understanding the root causes of waiting threads are essential steps to identify and resolve thread-waiting situations effectively.
We will look at all these in detail in this blog.
Table Of Contents:-
- What is a Thread-Waiting Situation?
- Thread-Waiting States and their Meaning
- Analysing Thread dumps to identify a Waiting Thread
- Deadlock, Circular Dependencies and Locked Resources
- Monitoring Wait Conditions
- Importance of Diagnosing Thread-wait Instances
- Preventive Steps
What is a Thread-Waiting Situation?
A thread-waiting situation, also known as a "thread waiting" or "thread in a waiting state," occurs in a multithreaded program or application when one or more threads are temporarily blocked or idling, waiting for a specific condition or event to occur before they can continue their execution. In this state, a thread is not actively performing any work but rather is in a state of inactivity, pending some external stimulus.
Thread Waiting States and their Meaning
Thread-waiting can occur due to various reasons, and on the basis of this, they convey different meanings to person analysing it. Waiting threads are usually waiting due to the factors listed below.
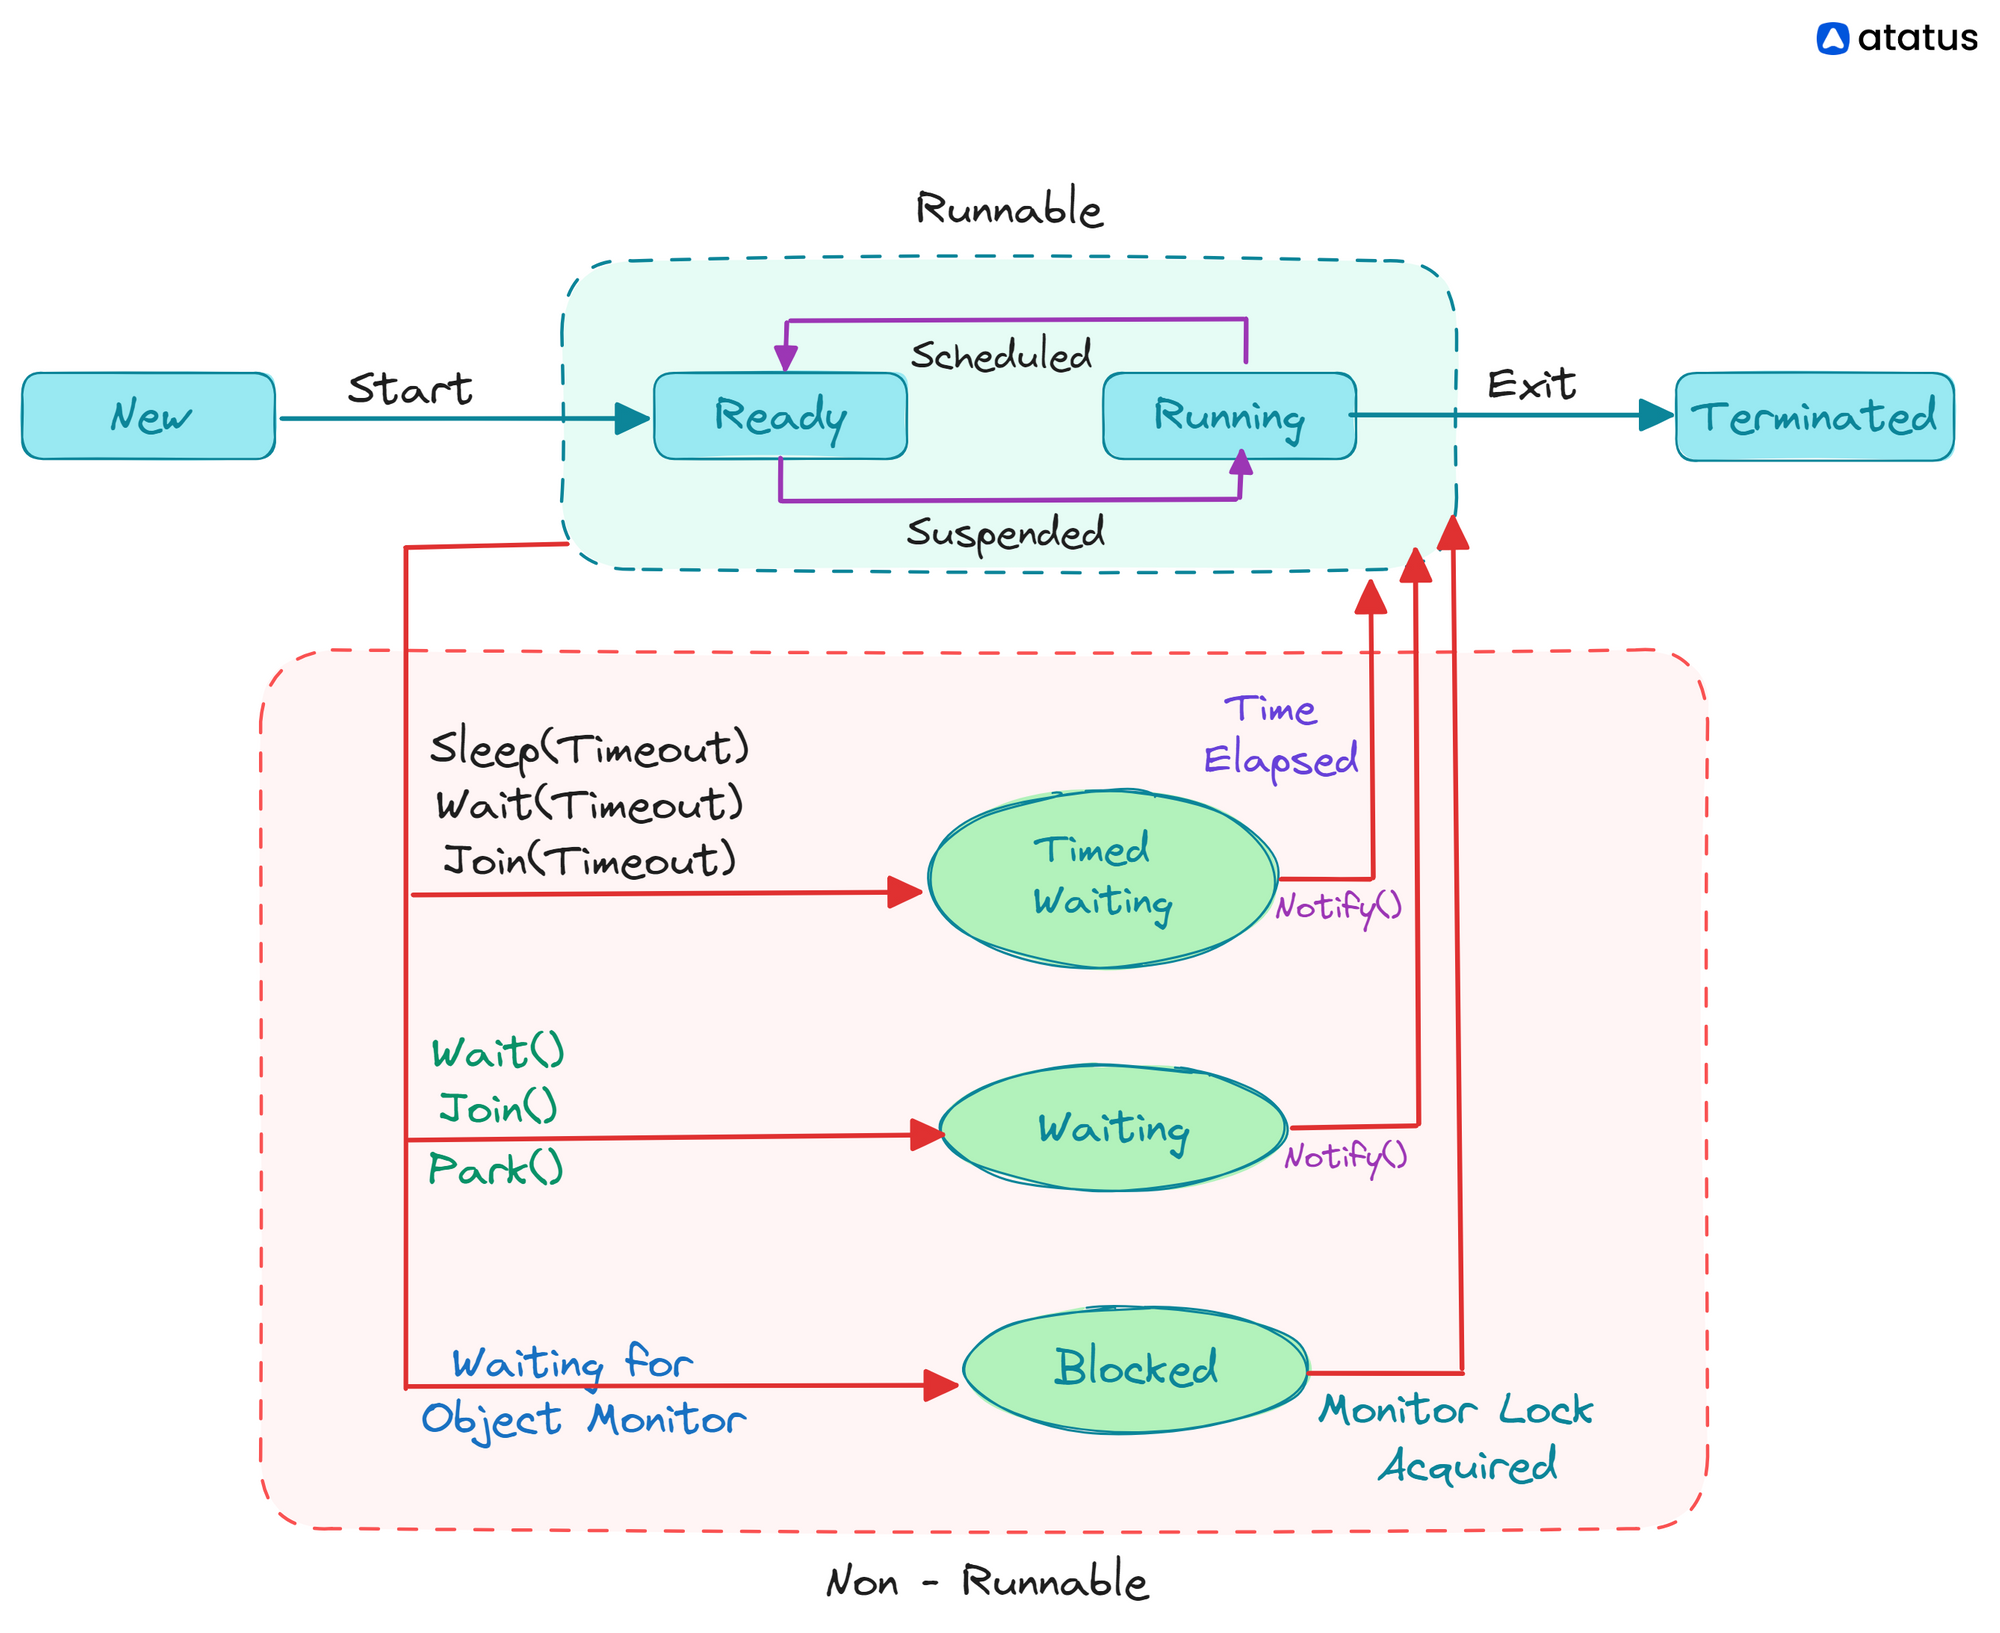
a.) WAITING: Threads in the "WAITING" state are waiting indefinitely for another thread to perform a specific action. They can enter this state through methods like Object.wait(), which requires explicit notification by another thread to awaken the waiting thread. Threads in the "WAITING" state may be waiting for some external event to occur.
b.) TIMED_WAITING: Threads in the "TIMED_WAITING" state are waiting for a specific period of time. This state can occur when threads call methods like Thread.sleep() or Object.wait(timeout). They will remain in this state until the specified time elapses or another thread notifies them.
c.) BLOCKED: Threads in the "BLOCKED" state are waiting for a monitor lock to enter a synchronized block or method. They are blocked because another thread currently holds the required lock. This state typically occurs in situations where multiple threads contend for the same resource.
d.) WAITING_FOR_PERMIT: Threads in this state are waiting for a permit to access a shared resource or perform a specific task. This can occur in situations where thread pools or semaphore-like constructs control access to resources.
e.) WAITING_FOR_IO: Threads may enter this state when waiting for input/output (I/O) operations to complete. This includes operations like reading from files, network sockets, or database connections. Threads can be blocked for a significant amount of time in this state, depending on the I/O operation's completion time.
f.) WAITING_FOR_EVENT: Threads may wait for specific events to occur, such as user input or external signals. This state can be seen in applications that rely on event-driven programming models.
Analyzing Thread Dumps to Identify a Waiting Thread
Analyzing thread dumps to identify waiting threads and diagnosing performance issues in a multithreaded Java application can be a valuable debugging technique. Here's how you can go on about it:
i.) Generate a Thread Dump:
First, you need to obtain a thread dump. There are several ways to do this, depending on your environment:
You can use the jstack command provided with the JDK to generate a thread dump for a running Java process. For example:
jstack <PID>Replace <PID> with the process ID of your Java application.
You can programmatically trigger a thread dump using Java code. For example:
Thread.dumpStack();Example of a dump
"Thread-1" #11 prio=5 os_prio=0 tid=0x0000000017803800 nid=0x1abc waiting for monitor entry [0x000000001824f000]
java.lang.Thread.State: BLOCKED (on object monitor)
at com.example.MyClass.methodA(MyClass.java:20)
- waiting to lock <0x00000007123c5678> (a java.lang.Object)
- locked <0x00000007123c5679> (a java.lang.Object)

"Thread-2" #12 prio=5 os_prio=0 tid=0x0000000017805800 nid=0x1abd runnable [0x000000001825e000]
java.lang.Thread.State: RUNNABLE
at com.example.MyClass.methodB(MyClass.java:30)
We have two threads, Thread-1 and Thread-2, each with a unique thread ID (TID).
"Thread-1" is in the BLOCKED state, indicating that it is waiting for a monitor entry (a lock).
"Thread-2" is in the RUNNABLE state, indicating that it is actively executing code.
The key details to note are:
Thread-1 is blocked on an object monitor, and it's waiting for the lock represented by <0x00000007123c5678> (a unique identifier for the lock).
Thread-2 is runnable, meaning it's not blocked and is actively executing code.
ii.) Examine the Thread Dump
Once you have the thread dump, you can analyze it to identify waiting threads.
Each thread in the dump will have a state associated with it (e.g., "WAITING," "TIMED_WAITING," "BLOCKED," etc.). Focus on threads in "WAITING" and "TIMED_WAITING" states, as these are likely waiting for something specific to happen.
Examine the stack traces of the waiting threads to understand where they are blocked or waiting. The stack traces will show you the call hierarchy and the methods where the threads are currently stuck.
iii.) Identify the Cause of Waiting
To diagnose the cause of thread waiting, consider the following:
- Check if the thread is waiting for a specific resource, such as a lock or a condition variable. This may involve analyzing the stack trace to identify the location in your code where the thread is blocked.
- In some cases, multiple threads may be waiting for resources that other threads hold, leading to a deadlock. Check if there is a circular dependency in the locks held by threads.
- Analyze the code or external components responsible for the wait condition. It might be an issue in your application code or an external resource that is not responding as expected.
Deadlock, Circular Dependencies, and Locked Resources
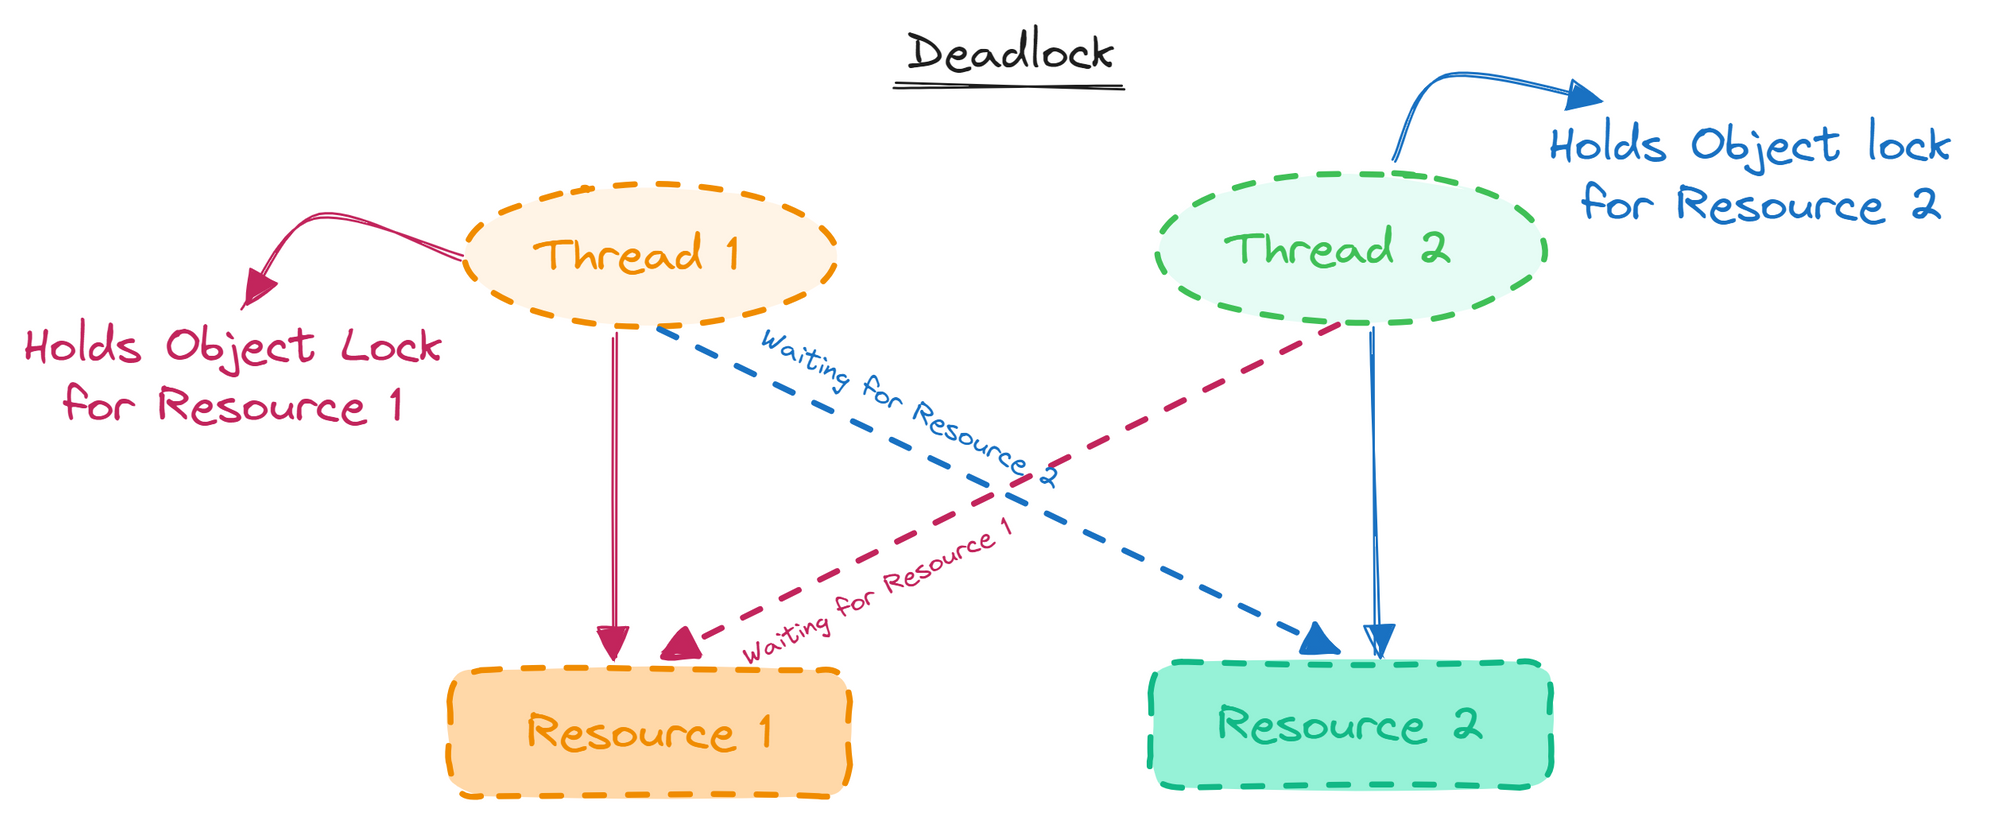
1. Deadlock
A deadlock occurs when two or more threads are unable to make progress because each is waiting for a resource that another holds. In other words, it's a situation where threads are effectively stuck in a mutual waiting pattern.
Causes:
- When threads compete for resources without proper synchronization mechanisms (e.g., not using synchronized or lock constructs).
- If threads lock resources in different orders, it can lead to circular dependencies and, potentially, deadlocks.
2. Circular Dependencies
Circular dependencies occur when a group of threads or processes depends on each other in a circular or cyclical manner, creating a situation where none can proceed.
Causes:
- Threads acquiring locks in different orders can lead to circular dependencies, where each thread depends on a resource held by another.
- Insufficiently designed synchronization strategies can inadvertently create circular dependencies.
3. Locked Resources
A locked resource is a shared resource, such as a database connection, file, or a piece of memory, that is currently held by one thread, preventing other threads from accessing it.
Causes:
- Multiple threads simultaneously trying to access a shared resource without proper synchronization can lead to resource locks.
- Inadequate or overzealous use of locks can lead to unnecessary locking of resources.
Monitoring Wait Conditions
Thread-wait instances in multithreaded applications can arise due to various issues, and identifying the underlying causes is crucial for addressing them effectively. Here are common issues behind thread-wait situations and how to fix or mitigate them:
- Synchronization and Locking Issues:
Threads waiting for locks held by other threads (deadlocks or contention).
Fix: Review and optimize your locking strategy. Use fine-grained locks, consider lock-free data structures or algorithms, and use thread-safe collections where applicable. Also, ensure that threads release locks promptly after use.
- I/O Operations:
Threads waiting for I/O operations, such as reading from files, network communication, or database queries.
Fix: Implement asynchronous I/O or use non-blocking I/O APIs if available. This allows threads to continue executing useful work while waiting for I/O to complete.
- Waiting on Conditions:
Threads waiting for specific conditions or signals.
Fix: Review your condition handling mechanisms. Ensure that conditions are being set correctly and that threads are properly notified when conditions are met. Use high-level synchronization mechanisms like java.util.concurrent classes for safer and more efficient condition handling.
- Deadlocks:
Multiple threads waiting for resources that result in a circular dependency and prevent any of them from progressing.
Fix: Detect and resolve deadlocks by reviewing your code's locking order and release practices. Implement deadlock detection and recovery mechanisms. Tools like thread dumps and profiling can help identify deadlocks.
- Thread Pool Saturation:
Thread pools have a fixed size, and all threads are busy, causing new tasks to wait.
Fix: Adjust the thread pool size based on the workload or switch to a dynamic thread pool implementation. Consider using a work queue to manage tasks effectively.
- External Dependencies:
Consider caching or buffering data from external sources to reduce depenIssue: Threads waiting on external services or resources.
Fix: Implement timeouts for external requests and handle failures gracefully. dencies on their availability.
To diagnose and fix thread-waiting issues effectively, it's essential to use profiling and monitoring tools. Additionally, proper design, synchronization, and concurrency control mechanisms play a crucial role in preventing and mitigating thread-wait situations in the first place.
Importance of Diagnosing Thread Wait Instances
Analyzing thread-wait instances in a multithreaded application is important for several reasons:
- To optimize application performance
- Use resources more efficiently
- To prevent deadlocks and concurrency related issues
- Fine-tuning thread pools
- Improving user experience
- Cost efficient for resource-constrained cloud networks
- Makes troubleshooting easier
Ways to Prevent Such Occurrences
Identifying the issue is half the work done, but there still lies correcting that issue. However, all of this can be prevented if we adopt proficient preventive strategies from the very beginning. For example, in case of thread-wait instances, you can follow these steps to make it a lot easier:
- Use fine-grained locks to reduce contention. Instead of locking entire data structures or sections of code, lock only the minimum necessary to ensure data consistency.
- Consider using lock-free or wait-free algorithms and data structures when possible. These can eliminate the need for traditional locking mechanisms, reducing thread-wait situations.
- Implement optimistic concurrency control mechanisms, such as versioning or compare-and-swap operations, which allow multiple threads to work independently until they need to reconcile their changes.
- Utilize asynchronous I/O operations to minimize the time threads spend waiting for input/output. Asynchronous operations allow threads to continue executing useful work while I/O operations are in progress.
- Optimize thread pool configurations, including the number of threads and task scheduling policies. Ensure that the thread pool size matches the application's requirements.
- Carefully manage thread priorities to avoid situations where high-priority threads monopolize resources, leaving lower-priority threads waiting.
- Distribute workloads evenly across threads to avoid situations where some threads are idle while others are overburdened.
- When interacting with external services or resources, implement timeouts and retries to handle cases where the resource is temporarily unavailable or slow to respond.
- Implement robust logging and monitoring to track the behavior of threads and detect anomalies or contention issues early.
Conclusion
In this article, we saw how thread-wait situations arise, and what to do when it arises. While most of the time, the reasons are synchronization errors and locked data structures.
However, analyzing thread-wait instances is essential to improve performance and provide a better user experience to customers. It allows developers to detect and address concurrency-related issues, optimize resource usage, and address any latency issues.
By doing so, an application becomes more reliable, responsive, and cost-effective, making it more competitive in today's software landscape.
Monitor your Entire Java Application with Atatus
With Atatus Java performance monitoring, you can monitor the performance and availability of your Java application in real-time and receive alerts when issues arise. This allows you to quickly identify and troubleshoot problems, ensuring that your application is always running smoothly.
Monitor the performance of your Java application down to the individual request level. This allows you to see exactly how long each request is taking to process, as well as any errors or exceptions that may have occurred.
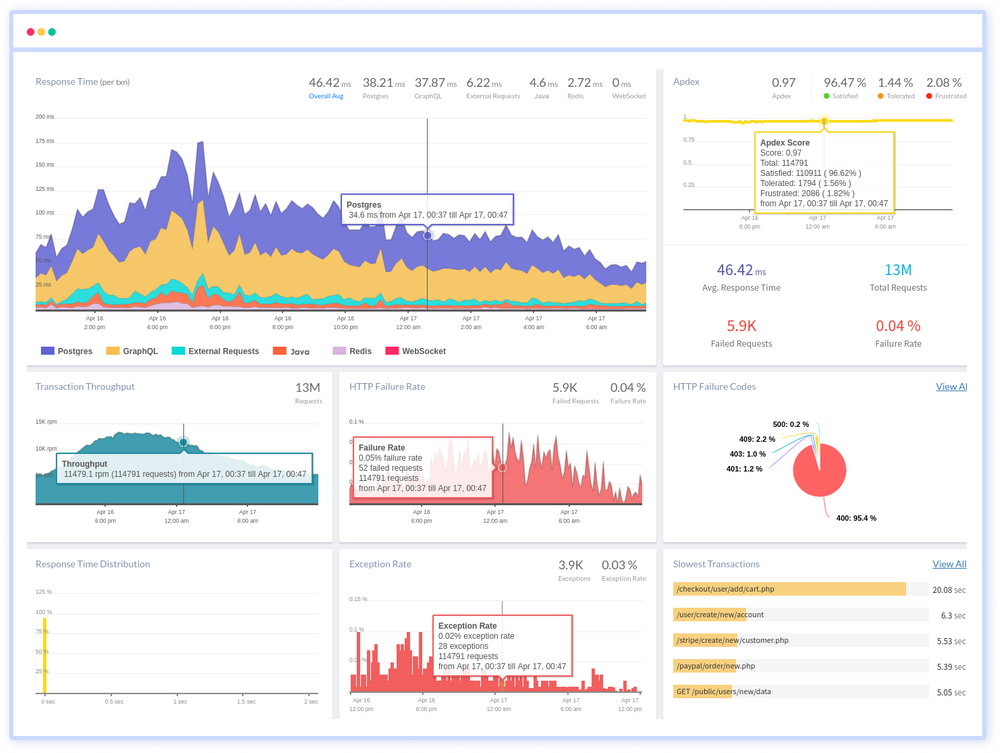
You can also see a breakdown of the different components of your application, such as the web server, database, and external services, to see how they are affecting performance.
Atatus also offers a range of tools and integrations that can help you to get the most out of your monitoring. For example, you can integrate Atatus with popular tools like Slack, PagerDuty, and Datadog to receive alerts and notifications in your preferred channels.
If you are not yet a Atatus customer, you can sign up for a 14-day free trial .
#1 Solution for Logs, Traces & Metrics
![]() APM
APM
![]() Kubernetes
Kubernetes
![]() Logs
Logs
![]() Synthetics
Synthetics
![]() RUM
RUM
![]() Serverless
Serverless
![]() Security
Security
![]() More
More