10 Critical Server Performance Metrics You Should Consider
More and more developers are worried about the end-to-end delivery of online apps as the DevOps movement gains attention. This covers the application's launch, functionality, and upkeep.
Understanding the function of the server becomes more and more important as an application's user base grows in a live setting. You must collect speed data for the computers hosting your web apps in order to assess the health of your applications.
Similar server speed measures apply to all varieties of web servers (such as Apache, IIS, Azure, AWS, and NGINX, for instance). The majority of my knowledge in this area comes from Microsoft Azure, which offers a simple user interface for locating and gathering data.
The capacity to run apps in Azure App Services (PaaS) or Azure Virtual Machines is provided by working with Microsoft Azure. (IaaS). With this setup, you can examine the various metrics for the program or server that is currently operating.
Table of Content
- What are Server Performance Metrics?
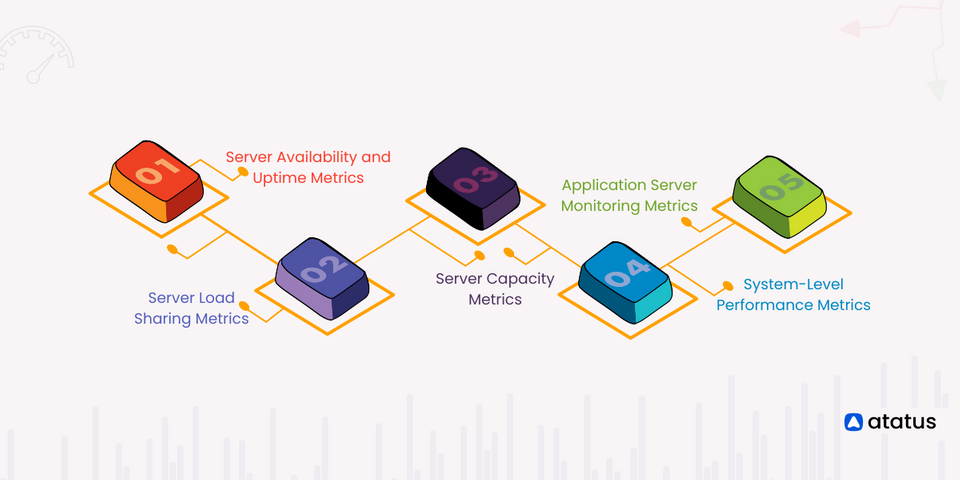
- Server Capacity Metrics
- Application Server Monitoring Metrics
- System-Level Performance Metrics
- Server Load Sharing Metrics
- Server Availability and Uptime Metrics
- How Performance Metrics Helps in Maintaining Server Health?
- Tips to Monitor Server Health
What are Server Performance Metrics?
Server metrics assist you in keeping track of what's going on with the server that's running your application and in troubleshooting any problems that might be degrading the speed and user experience.
They are also referred to as server-side analytics, and they assist you in digging deeper to find the underlying causes of hardware and software problems so you can stop them from happening again.
The user experience is adversely affected by outages, slow reaction times, and various other performance problems, and the underlying cause for a problem may be challenging to identify given the wealth of complex data accessible.
By identifying important server measures, you can lower error rates and raise your organisation's general efficiency and revenue.
We are going to see two types of metrics in this blog:
- App Performance Metrics
- User Experience Metrics
Metrics for app performance are specific to the pace of the active web applications. These metrics are indeed a fantastic place to start if an application is running slowly and you're experiencing problems.
Server Capacity Metrics
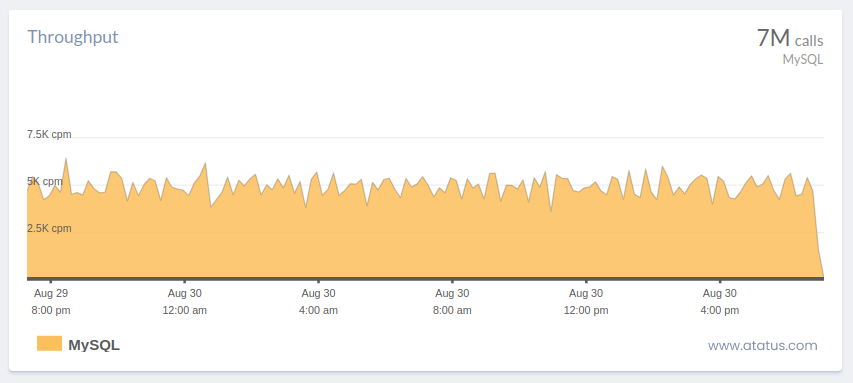
i.) Requests Per Second
The term "requests per second" (also known as "throughput") refers to the quantity of requests that are made of your server each second.
The primary function of a remote server, which is to receive and process requests, is measured by this core statistic. Up to 2,000 queries per second are typical for large-scale systems.
The amount of queries that a system handles concurrently is represented by server threads. The number of active and inactive threads can be used to gauge a server's overall workload and determine the maximum number of queries it can handle. To make operating systems more efficient, you can establish a server option that restricts the number of requests a server may handle.
Any server can crash with enough traffic. When evaluating the effects, remember that requests constitute only a single request towards the server. This measure does not take into account what is occurring with all of these requests.
The HTTP server rate of error is an important performance measure, despite the lack of a direct connection to application speed.
The overall amount of internal server errors—also known as HTTP 5xx numbers—that were communicated to customers is provided. Applications that aren't working correctly will send these errors when an exception or other blunder isn't handled properly.
It is a wise strategy to set up a warning for whenever these errors occur. 500 mistakes are almost always preventable, so you can be positive your software is reliable. By getting alerts for each time an HTTP server fails, you can stay aware of any problems that may be occurring. This prevents the issue of the programme's errors building up over time.
ii.) Data In and Data Out
The following measure is both data in and data out, which I advise you to look at. The data in criterion is the size of request payload heading to the remote server.
For this statistic, a lower rate is desirable (lower suggesting that little payloads being sent into the server). A high data in metric can suggest the application is seeking extra knowledge than it needs.
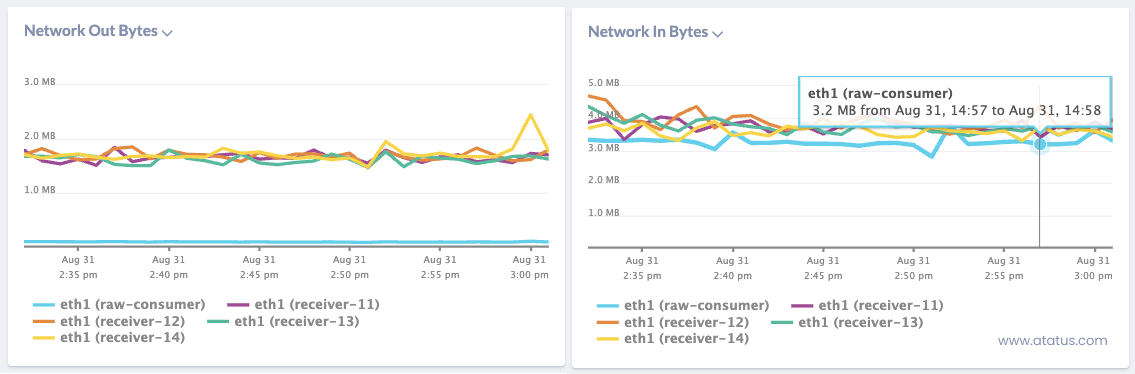
The response payload that is sent to clients is data out. As webpages are having got bigger as time passes, this creates a problem particularly for those with delayed network connections.
Bloated response payloads cause websites to load slowly, and users will be unhappy with these websites. Once the website becomes too slow, these users leave and go somewhere else.
Application Server Monitoring Metrics
i.) Average Response Time
The average response time (ART), as defined in its simplest form, is the average amount of time it takes the server to answer to each request. This number provides a good indication of the application's overall performance and the usability of the app.
In general, a smaller value for this number is preferable. Yet, research indicate that a user can only spend a maximum of one second navigating around an application.
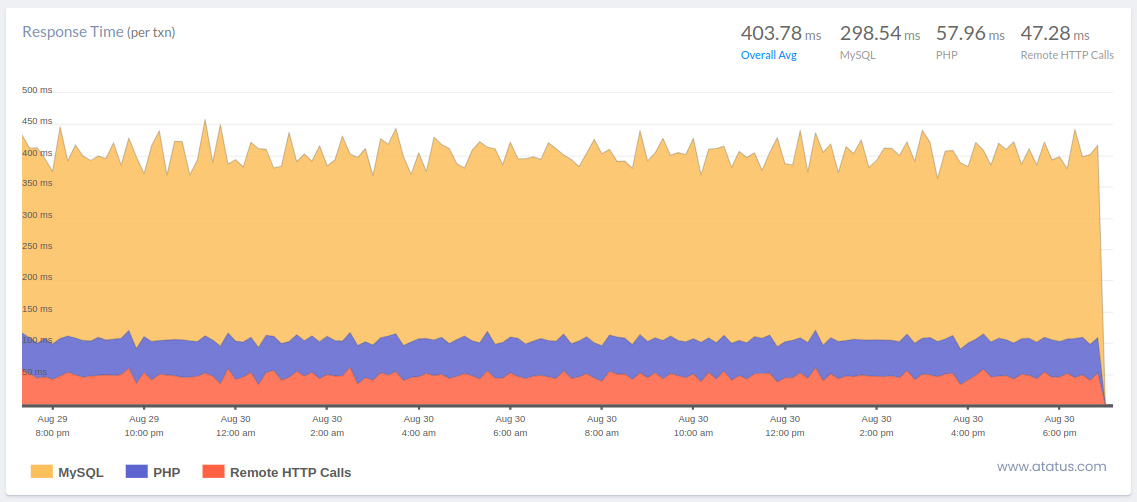
Understand what the acronym means for when thinking about ART—just it's an average. High outliers can entirely skew the number, as they can with any statistic that is calculated by an average, and cause the process to appear slower than it actually is. When combined with the following metric on our list, ART is most beneficial.
ii.) Peak Response Time
The peak response time (PRT), which is calculated from the lengthiest responses for all requests sent to the server, is calculated similarly to the average response time. This is a reliable sign of the application's performance bottlenecks.
PRT will assist you identify the parts of your applications that are creating hangups as well as identify their underlying causes. This indicator can help you determine where to look, for example, if a certain web page or call is unusually slow.
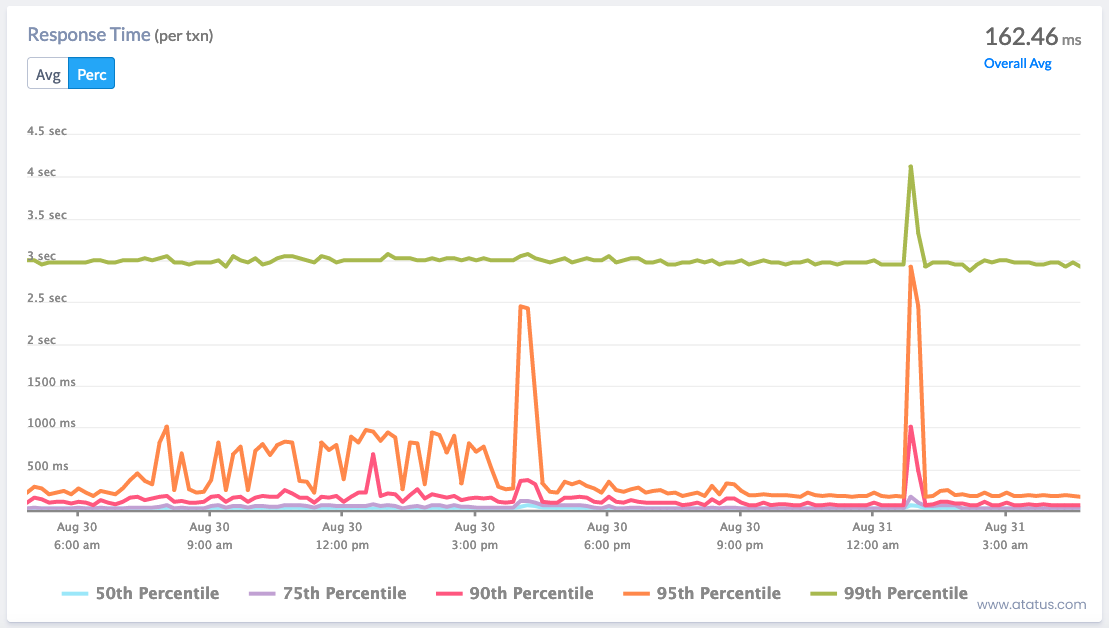
Although peak response time (PRT) tracks the longest duration of request processing, average response time (ART) pertains to how long it typically takes for a server to process a request. By contrasting your peak to your average, ARTs and PRTs can show you where you can enhance your system functioning.
Discover key API Performance metrics to optimize your API performance and enhance user experiences.
System-Level Performance Metrics
i.) Hardware Utilization
Let's move on to discussing total system utilisation. The resources allotted to a computer or programme determine how much of each they can use.
As a result, monitoring resource usage is essential, particularly to ascertain whether a resource limit is present. There are three main factors about a server to think about:
- RAM (memory)
- CPU
- The disk capacity and utilization
You should search for anything that might turn into a barrier for the entire system when taking these into account. Efficiency is only as good as its weakest link, as any real (or virtual!) machine operating with these parts will demonstrate. This measure can help you identify the speed bottleneck and identify which physical component needs to be changed.
Disks keep temporary files, supporting files, and online request server records. Disk activity gauges how long it takes the system drivers to handle requests; a reduced utilisation rate indicates more optimum performance. Check the disc request queue and usage percentage to see if you can reduce the duration of the wait and usage percentage.
For instance, rendering material to a physical hard disc might present problems. The I/O exchanges between gathering data and displaying them to the viewer will become clogged as a result. Other physical components are inactive while the hard disc rotates and collects data. The performance of the complete programme would increase after switching to a solid-state disc because the bottleneck would no longer exist.
Server Load Sharing Metrics
i.) Thread Count
The next measure, a server's thread count, indicates how many concurrent queries are being handled by the server at any given moment. You can use this measure to determine how a server is generally loaded at the request level. It will also show you how much work operating numerous threads puts on the server.
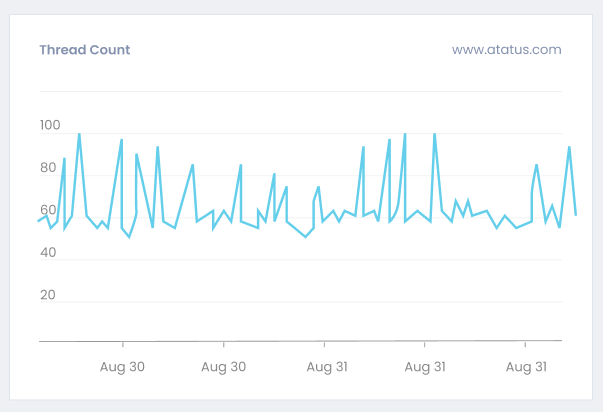
A limit thread count can typically be set for a computer. You are establishing a maximum number of inquiries that can be made at once by doing this. All pending requests will be delayed until there is room in the backlog to handle them if the number of threads exceeds this upper limit. These delayed inquiries usually time out if they take too long.
Till now we have seen about different app performance metrics. Now we will see about user experience metrics. After discussing app speed indicators, let's move on to some that are focused on the user experience. These server speed metrics can gauge how happy your customers are with your web apps generally.
ii.) Latency
Latency denotes the time it takes for a request to journey from a user's device to the server and back, resulting in a response. When considering server load distribution, latency provides insights into the server's promptness in addressing incoming requests.
Lower latency signifies a more agile server, whereas higher latency implies potential delays in processing requests.
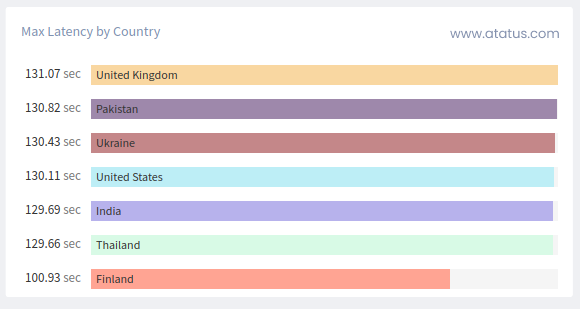
For instance, if a server is experiencing high latency, it might take longer for a user's action (like clicking a button or submitting a form) to yield a visible response on their screen. Monitoring and optimizing latency is crucial because users generally prefer quick and smooth interactions. High latency can lead to a poor user experience and dissatisfaction.
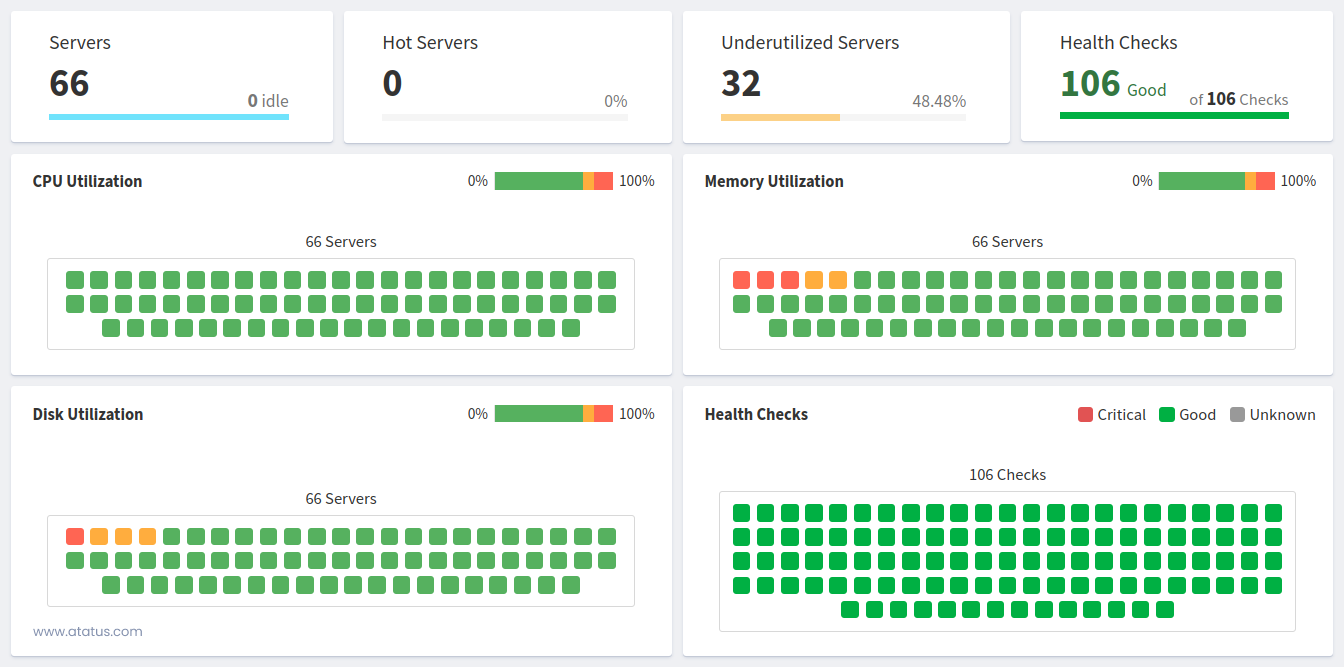
iii.) Healthy / Unhealthy Hosts
This metric focuses on the overall health of the servers that are part of your load-sharing infrastructure. Each host (server) can be in either a healthy or an unhealthy state. This determination is usually based on various factors like CPU usage, memory consumption, network connectivity, and more.
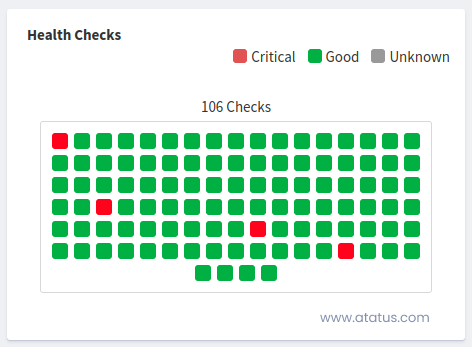
Monitoring the health of hosts helps ensure that the load is distributed efficiently and that no single server is overloaded while others are underutilized.
An unhealthy host might struggle to handle incoming requests, leading to increased response times, errors, or even server crashes. On the other hand, a healthy host can manage its share of the load effectively, contributing to a smoother user experience.
Server Availability and Uptime Metrics
i.) Uptime
A server's availability reflects how long it has been running and is still accessible to respond to client queries. Metrics for server uptime are usually quantifiable in seconds, starting with when the system is turned on. Measuring availability enables you to keep an eye on instances when a system goes down so you can diagnose any problems and restart the system.
The server's uptime, though unrelated to speed, is an important measure. The uptime of a website indicates how much of it is accessible. When looking at web hosting services, you'll often find instances of 99.9% uptime (or more), even though you should ideally be striving for 100% uptime.
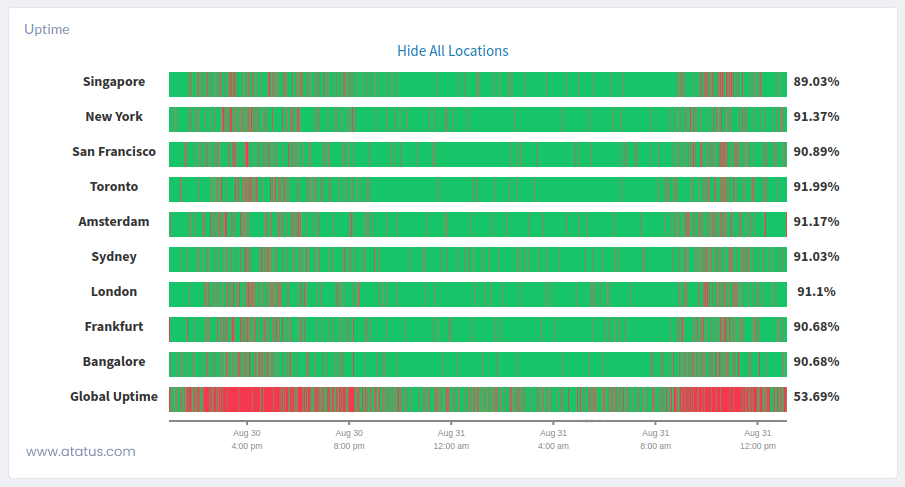
Software initiatives frequently adhere to a service level commitment that specifies a specific server availability percentage. There are numerous third-party services, like Updown.io, that can verify your uptime data if your server is unable to do so naturally.
ii.) HTTP Server Error Rate
Although it has no clear correlation to application speed, the HTTP server rate of error is a crucial performance metric. It gives the total number of internal server failures (also known as HTTP 5xx numbers) that were given to consumers.
When an exception or other mistake is not being managed properly, malfunctioning applications will send these errors. Setting up an alert for whenever these mistakes happen is a smart practise.
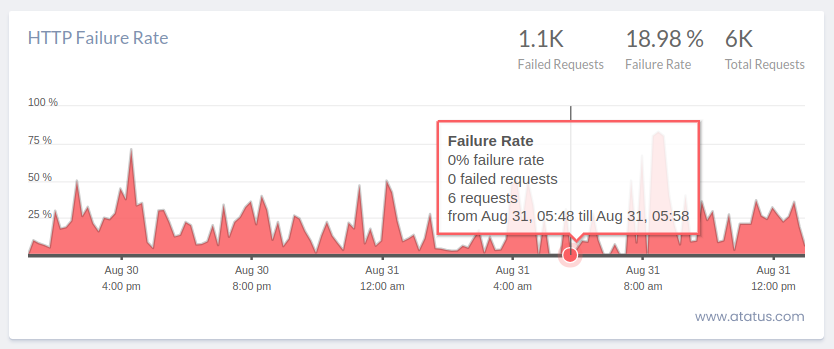
You can be sure your programme is robust because 500 mistakes are almost always avoidable. You can remain informed of any errors happening by receiving notifications for every HTTP server failures. This avoids the problem of the programme accumulating mistakes over time.
How Performance Metrics Helps in Maintaining Server Health?
- Performance metrics serve as an early warning system, enabling administrators to detect deviations from normal behavior and identify potential issues like resource shortages before they cause disruptions.
- These metrics help locate system bottlenecks, such as processing capacity indicated by high CPU utilization or storage performance issues suggested by high disk I/O latency, prompting corrective actions for performance optimization.
- Performance metrics guide load balancing decisions by monitoring request rates and server loads, facilitating effective distribution of incoming traffic across multiple servers to ensure optimal performance and prevent overloads.
- By analyzing performance metrics, administrators can make informed resource allocation decisions, such as adding more RAM if memory usage is consistently high, and adjusting configurations to maintain load balance.
- Identify slow-performing components and fine-tune code or configurations for improved effectiveness.
- Performance metrics help validate the impact of server environment changes, ensuring that modifications do not inadvertently lead to performance setbacks or disruptions.
- Metrics related to response times, latency, and error rates play a direct role in user satisfaction, prompting administrators to address performance bottlenecks for faster application response times and better overall user experiences.
Tips to Monitor Server Health
- Use APM Tools for Performance Monitoring: Application Performance Monitoring (APM) tools are indeed crucial for tracking the speed and performance of your server and applications. These tools can help you identify bottlenecks, errors, and provide real-time insights into the health of your hardware and software.
- Identify Network and Hardware Components: Understanding your network infrastructure, including devices, switches, routers, and their connections, is fundamental. This knowledge allows you to effectively monitor and manage your network hardware.
- Establish Performance Benchmarks: Setting up benchmarks for system efficiency helps you gauge the performance of your servers against industry standards. It also provides a reference point for identifying anomalies and areas needing improvement.
- Regularly Evaluate Server Performance: Regular evaluations are essential for maintaining optimal server performance. Automated evaluations using APM tools can help track performance metrics over time, identifying trends and potential issues.
- Create an Escalation Strategy and Alerts: Having a well-defined escalation strategy ensures that the right people are informed promptly when issues arise. Exception-based alerts help you focus on critical problems and avoid unnecessary notification fatigue.
- Implement Continuous Monitoring: Continuous monitoring is crucial for maintaining high availability and quickly addressing issues as they arise. Real-time alerts enable you to respond promptly, reducing downtime and ensuring consistent service availability.
Conclusion
Servers are used by many sectors to record, keep, access, and optimise digital work processes. To determine the efficacy of the system and to assist you in managing the volume of data transferring into and out of the server, you can analyse these servers using a variety of performance measures.
Knowing the right measures for server monitoring may enhance your productivity and organisation if your job involves using a server.
You can establish minimal and maximum processing boundaries in order to optimise system operations by looking at server efficiency. Specialists are frequently designated to watch, manage, or update system servers for companies that rely on hardware and software technological advances to function.
In this blog, we have seen two types of server metrics- app performance and user experience metrics, also some tips for server monitoring that would help you to enhance the efficiency of the server’s performance. It is important that we use performance monitoring tools, establish benchmark for tracking and evaluate the efficiency of the server.
Infrastructure Monitoring with Atatus
Track the availability of the servers, hosts, virtual machines and containers with the help of Atatus Infrastructure Monitoring. It allows you to monitor, quickly pinpoint and fix the issues of your entire infrastructure.
In order to ensure that your infrastructure is running smoothly and efficiently, it is important to monitor it regularly. By doing so, you can identify and resolve issues before they cause downtime or impact your business.
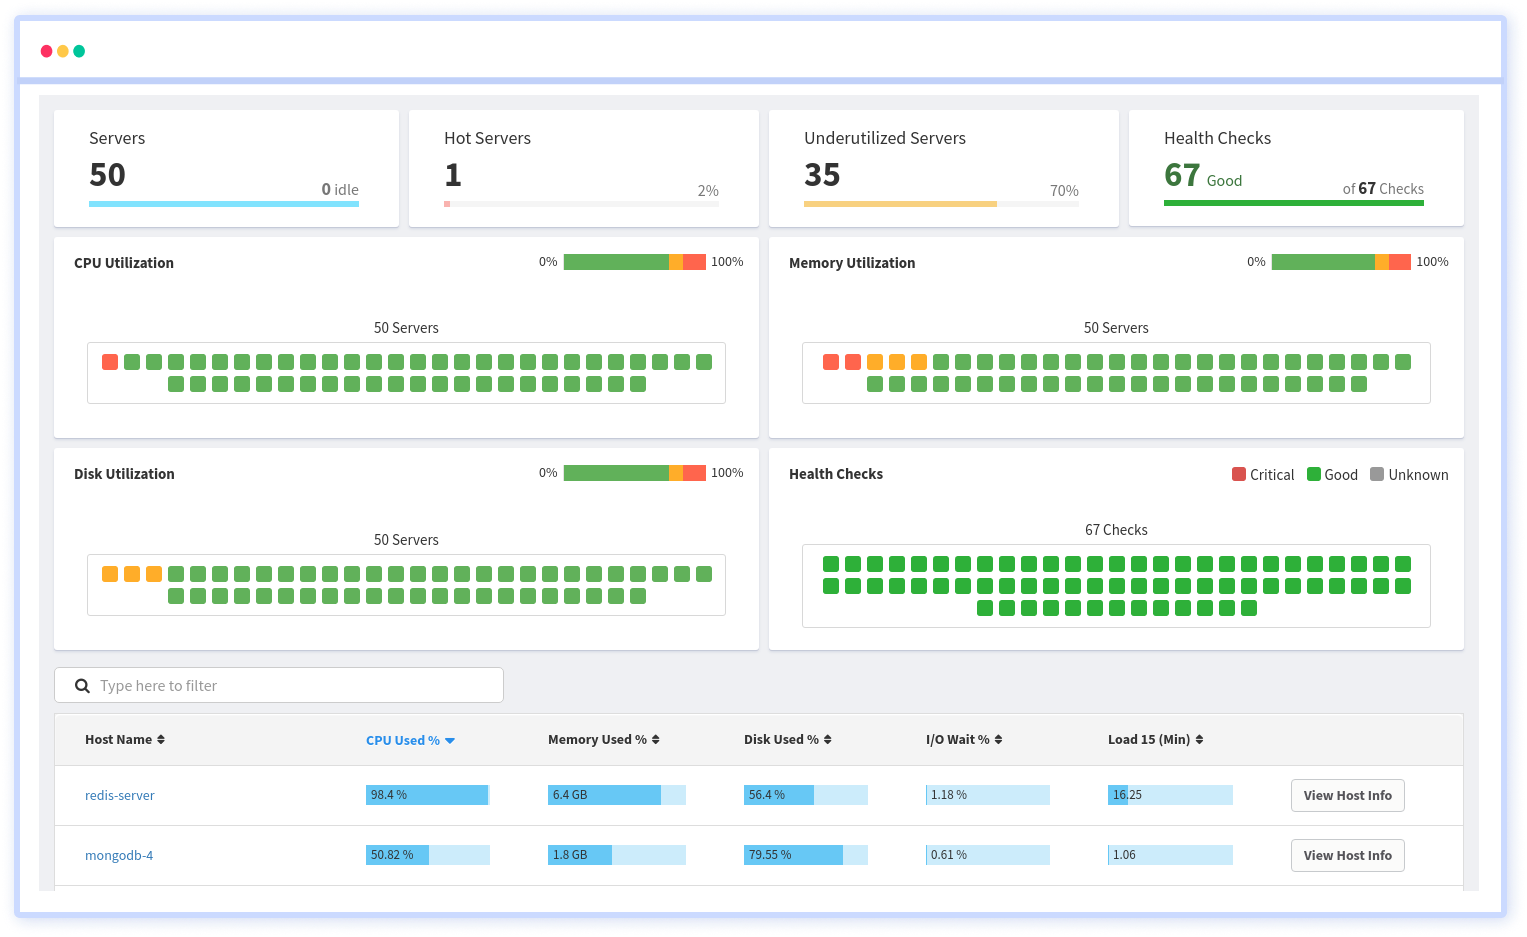
It is possible to determine the host, container, or other backend component that failed or experienced latency during an incident by using an infrastructure monitoring tool. In the event of an outage, engineers can identify which hosts or containers caused the problem. As a result, support tickets can be resolved more quickly and problems can be addressed more efficiently.
Start your free trial with Atatus. No credit card required!
#1 Solution for Logs, Traces & Metrics
![]() APM
APM
![]() Kubernetes
Kubernetes
![]() Logs
Logs
![]() Synthetics
Synthetics
![]() RUM
RUM
![]() Serverless
Serverless
![]() Security
Security
![]() More
More