Top API Metrics for Different Teams That You Should Monitor
Building and utilizing modern applications now essentially requires APIs. They are a crucial component of every company's automated workflow, and as more customers depend on your APIs to power their applications, the demand for them to be trustworthy is growing.
Your business will suffer if its performance, availability, or health degrades, thus proactive API monitoring is essential to ensure its dependability.
We'll go through the most important API metrics in this article.
- CPU Usage
- Memory Usage
- Uptime
- Average and Max Latency
- Errors Per Minute
- Request Per Minute (RPM)
- API Calls Per Business Transaction
- API Retention
- API Usage Growth
- SDK and Version Adoption
- Top Customers by API Usage
- Unique API Consumers
Introduction
When it comes to APIs, each team must monitor a particular set of KPIs. The API metrics that matter to teams working on infrastructure are different from those that matter to teams working on API platforms or products.
The stage of the product life cycle in which the API is at can also affect metrics. A freshly released API will give up dependability and backward compatibility in favor of enhancing design and usage.
A team that manages an API that is often used by enterprise teams may put more emphasis on encouraging the adoption of new features per account and prioritize reliability and backward compatibility over design.
The following are the API metrics to track.
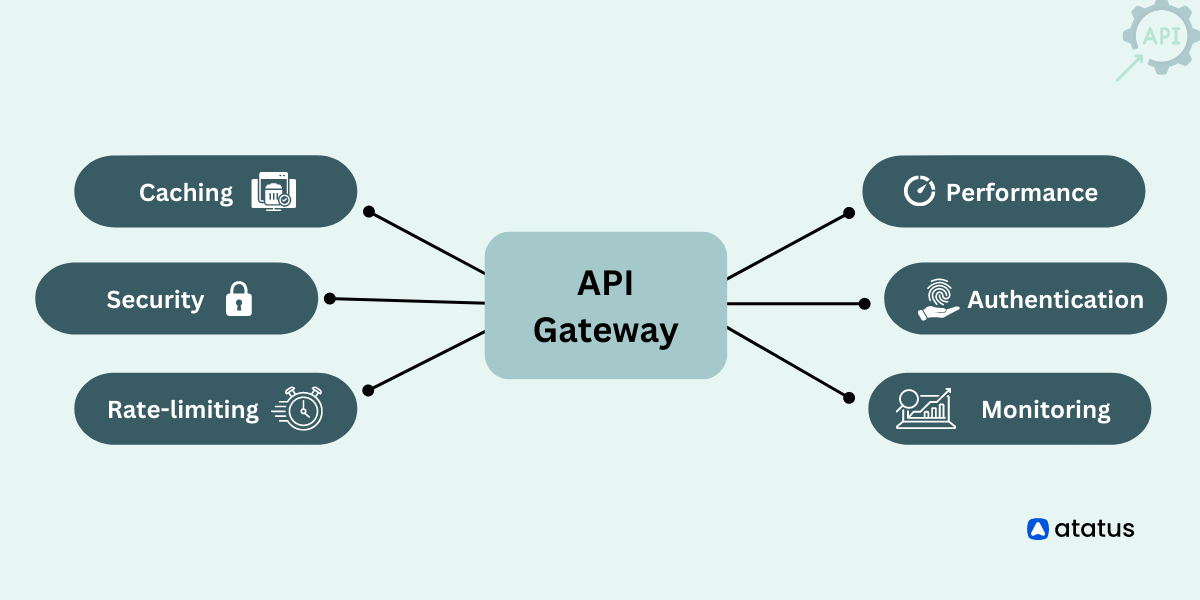
Infrastructure API Metrics
Possibly for several engineering teams, make sure the servers are up and that the limited resources are allocated properly.
Application Performance Monitoring (APM) solutions and infrastructure monitoring companies focus on several of these KPIs.
#1 CPU Usage 💽
One of the most well-known performance metrics that can serve as a proxy for application responsiveness is CPU usage. A performance issue in your application, such as an excessive number of spinlocks, or an oversubscribed and overloaded server are also possible causes of high server CPU utilization.
CPU utilization and its sibling statistic, memory percentage, are used by infrastructure engineers to plan resources and assess system health. Some applications, such as API gateways and high bandwidth proxy services, as well as workloads that heavily rely on floating point math, such as video encoding and machine learning workloads, naturally use more CPU than other measures.
When debugging APIs locally, Task Manager on Windows (or Activity Monitor on Mac) makes it simple to view the system and process CPU utilization. However, running the top command while SSH'ing into a server is probably not a good idea.
This is where different APM suppliers can be helpful.
APMs have an agent that can be installed on the server or included in your application to collect metrics like CPU and memory utilization. As an example of application-specific monitoring, thread profiling is also possible.
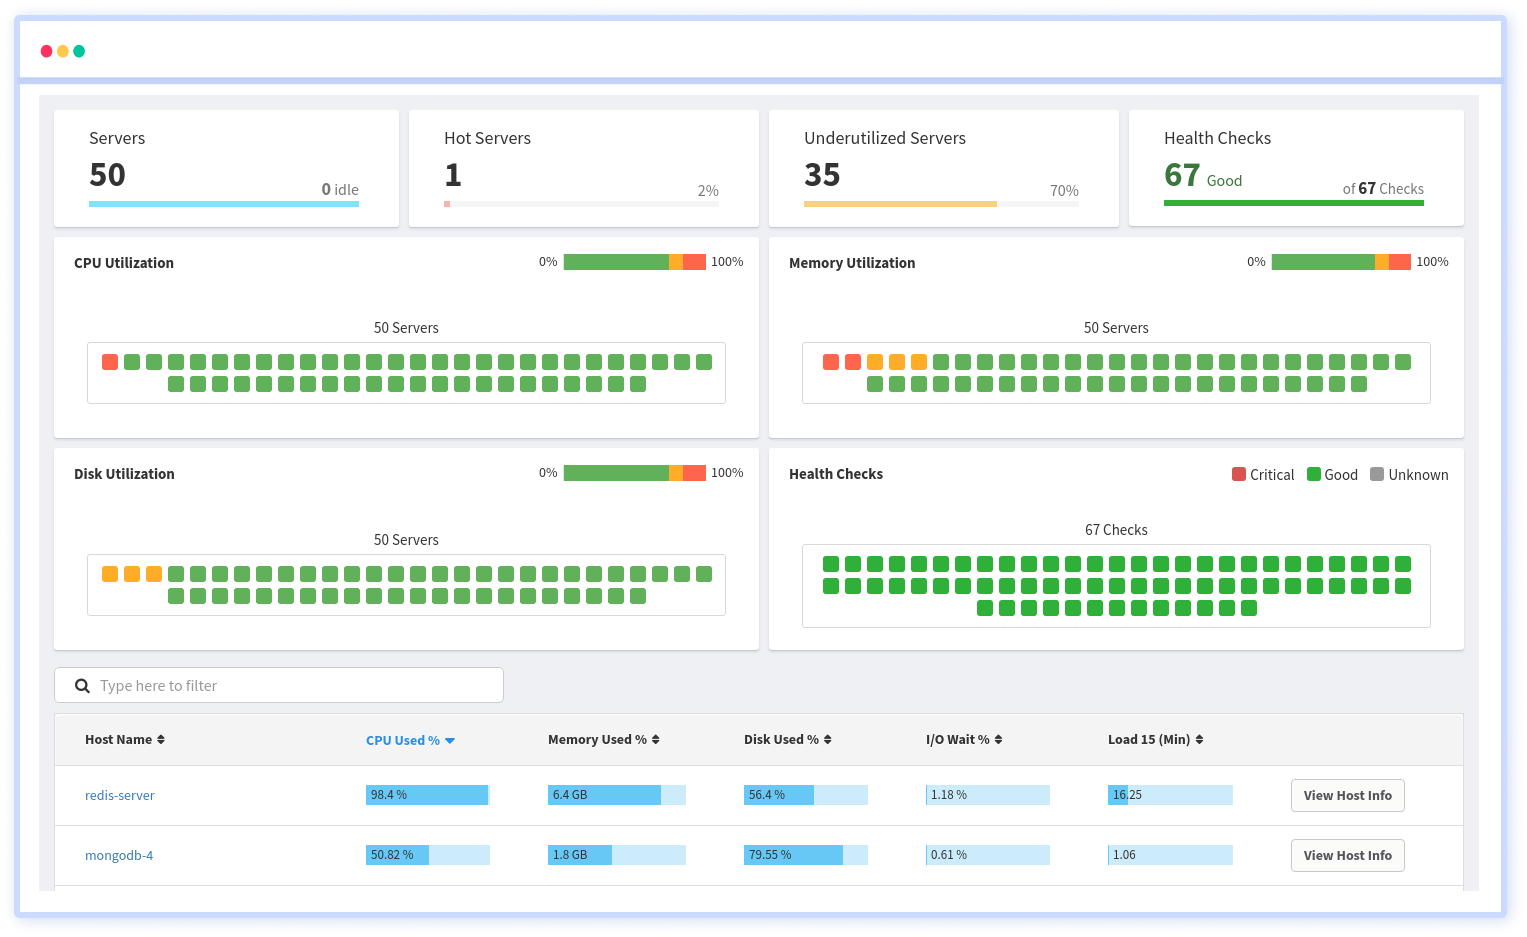
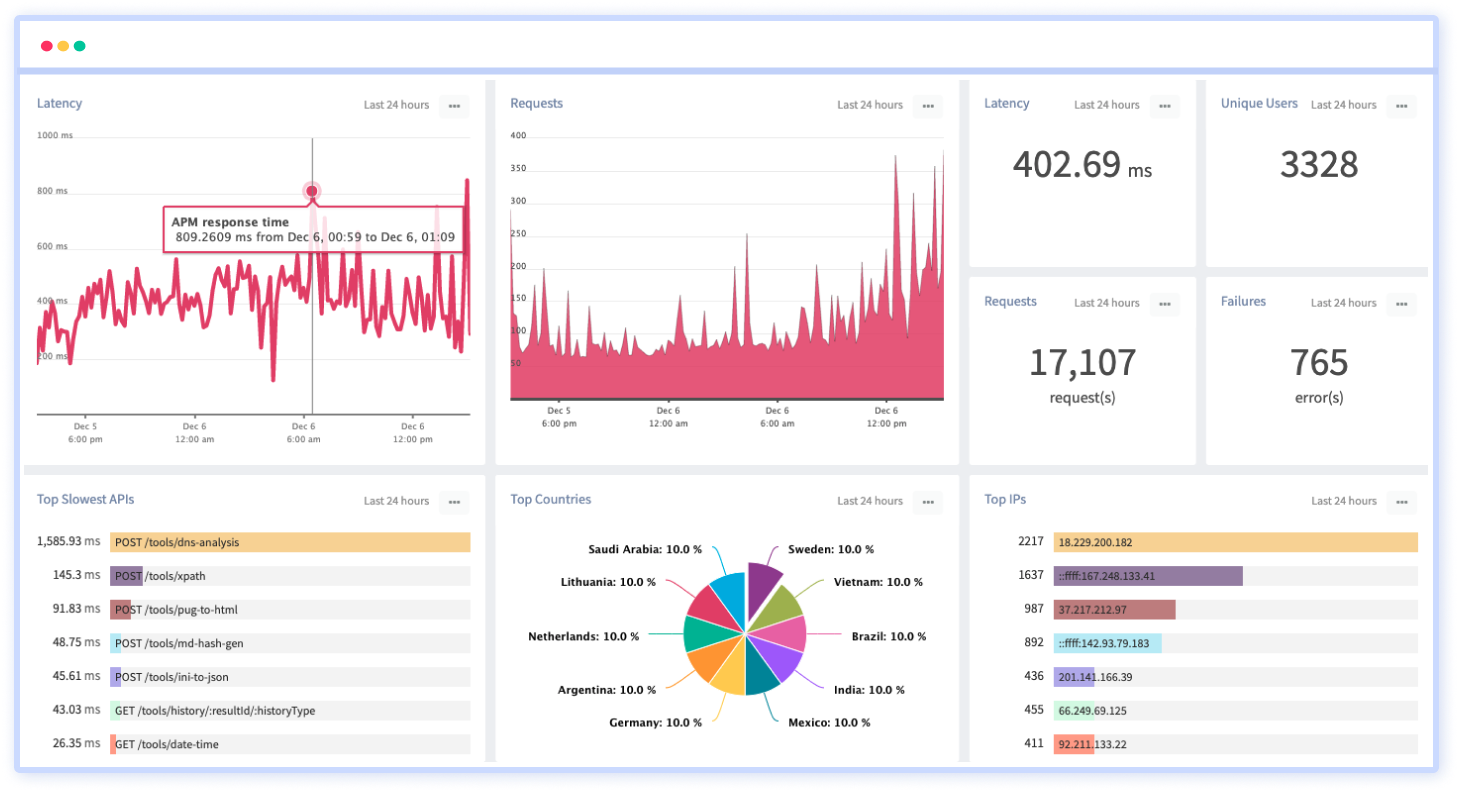
Atatus Observability Platform that allows you to review issues as if they happened in your application. You can discover how your servers or cloud instances are being used in real-time. You can monitor all key infrastructure performance metrics of your hosts including CPU, memory, i/o, disk, network, load averages, and see the trends for all your servers.
It's crucial to examine CPU usage per virtual CPU when examining overall CPU usage (i.e. physical thread). Unbalanced utilization can indicate improperly threaded applications or an inadequately sized thread pool.
#2 Memory Usage 🧠
Memory usage is a good proxy for CPU usage since memory and CPU capacity are physical resources, as opposed to metrics that could be more configuration-dependent.
If a virtual machine (VM) has extremely low memory use, it might be reduced or given more services so that it uses more memory.
On the other hand, excessive memory use may point to overcrowded servers. Production databases, massive data queries, and stream processing typically need a lot more memory than a CPU.
In reality, the amount of memory allocated to each virtual machine (VM) is an excellent predictor of how long a batch query might run because additional memory can speed up checkpointing, network synchronization, and disk paging.
In addition to looking at memory utilization, you should also count page faults and I/O operations. An application that is set up to only use a small portion of the available physical memory can easily lead to artificially high page virtual memory thrashing.
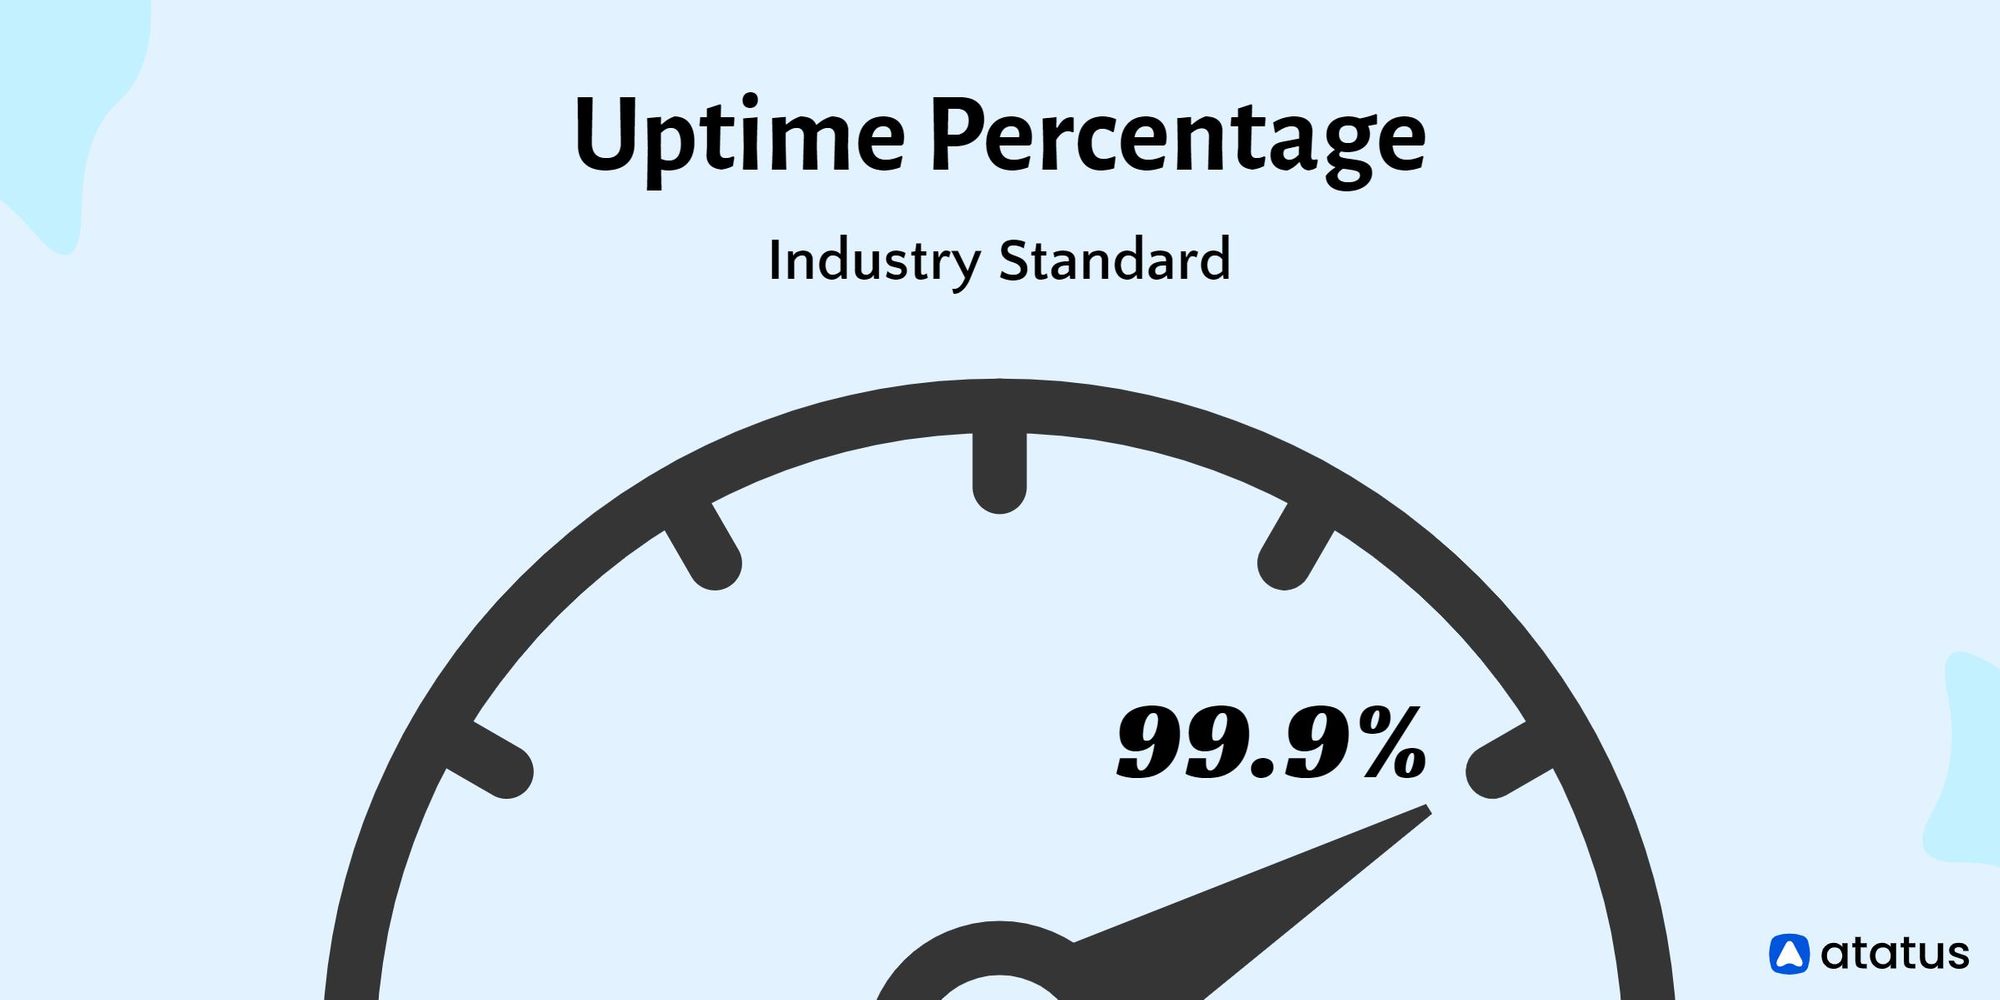
#3 Uptime 👍
The basic performance metrics of an SLA (Service Level Agreement) are included in a service's uptime or availability. To show the uptime and downtime throughout the year, the availability measures are in a series of 9s.
Certain services frequently experience lower uptime while managing outages without suffering any effects. Even at the most crucial phases of monitoring the API, SDKs are utilized to queue data.
To back up data or store other services without interfering with your application interface, uptime performance metrics can be used to configure probes to run at regular intervals.
By anticipating application call behavior, synthetic testing may be another method of analyzing the experience of your customers. Even if it does not accurately reflect real-world traffic, you can have a simple monitoring method and keep your uptime.
Application API Metrics
It is the responsibility of API developers to update APIs with new capabilities while resolving application-specific issues with the business logic of the API. Products like API as a Service, plugins, and connectors for partners, APIs incorporated into bigger products, or whatever else could be these products.
#4 Average and Max Latency 🤔
The latency or elapsed time of an API is one of the most crucial metrics to monitor user experience. The user perception of responsiveness may not truly rise if infrastructure level measurements like CPU utilization go up, but API latency most certainly will.
If you only track latency, you might not fully understand why an increase happened. To identify the underlying cause of the rise in latency, it's critical to keep track of any update to your API, including new API versions issued, new endpoints added, schema modifications, and more.
Looking at latency breakdowns by route, geography, and other fields to segment is crucial since when looking at aggregate latency, problematic slow endpoints may be hidden.
Even though many DevOps/Infrastructure teams will also look at latency, we classify it as an application/engineering concern. To ensure that a group of virtual machines (VMs) are not overburdened, an infrastructure person typically looks at aggregate latency rather than application-specific metrics like per route.
#5 Errors Per Minute ❌
Errors per Minute, often known as error rate, is a crucial metric for measuring how error-prone and buggy your API is. It is the number of API calls per minute with status codes outside the 200 families. It's critical to comprehend the types of errors occurring to measure errors per minute.
While multiple 400 errors could indicate user error from a poorly built or written API, 500 errors could indicate something is wrong with your code. This means it's crucial to use the correct HTTP status code while creating your API.
You can look further to determine the source of these issues. Several 401 Unauthorized errors coming from single geolocation could indicate bots are trying to exploit your API.
#6 Request Per Minute (RPM) 🤝
When comparing HTTP or database servers, RPM (Requests per Minute) is a performance metric that is frequently employed. Your actual RPM will typically be significantly lower than the advertised RPM, which is more of an upper bound for a simple "Hello World!!!" API.
Since a server does not take into account the delay experienced during I/O operations to databases, third-party services, etc. Even though some people enjoy boasting about their high RPM, an engineering team's objective should be efficiency and a reduction in this number.
It is possible to reduce the number of API calls required by some business functions by combining them into fewer calls. Along with making sure you have a flexible pagination strategy, common patterns like batching many queries into one request can be very helpful.
Your RPM may change based on the day of the week or even the hour of the day, particularly if your API is designed for other businesses with lesser traffic on the weekends and after hours. Other terminologies associated with RPM include RPS (Requests per Second) and QPS (Queries per Second).
API Product Metrics
To understand how their APIs are utilized, API-driven businesses need to look at more than just engineering metrics like errors and latency. The API product managers are responsible for making sure the appropriate features are built.
#7 API Calls Per Business Transaction 🤙
Even if more is better for many product and business metrics, it's crucial to minimize the number of calls required for each transaction. This measure accurately depicts how the API was created.
The API may not have the proper endpoints available if a new user has to make three separate calls to piece the data together.
Instead of only considering features and endpoints, it's critical when building an API to consider a business transaction or what the customer is attempting to accomplish. It can also show that your API lacks sufficient filtering and pagination flexibility.
#8 API Retention 🟢
You can choose a path based on retention and churn. A product that has a high rate of product retention is more likely to have a product-market fit than one that has a churn issue.
Product retention, as opposed to subscription retention, monitors how a product, like an API, is used. Despite being connected, the two are not the same.
In general, product churn is a precursor to subscription churn since users who don't see the value in an API may be locked into an annual contract even if they aren't utilizing it.
Web retention will include users who logged in but may not have yet integrated the platform, so API retention should be higher than web retention. While API retention considers clients who have been integrated.
#9 API Usage Growth 📈
The most important metric for measuring API adoption, in the eyes of many product managers, is API usage together with unique customers.
An API should not only be error-free but also develop over time. In contrast to requests per minute, API usage should be measured over longer time frames, such as days or months, to identify true trends.
To eliminate bias caused by variances in weekend vs. weekday usage as well as differences in the number of days in a month, we advise using 28 days for measuring month-over-month API growth.
For instance, February might only have 28 days while January had a full 31 days, giving the impression that February has less utilization.
#10 SDK and Version Adoption 🗃️
Several SDKs and connectors may also be maintained by many API platform teams. In contrast to mobile, where iOS and Android are the only two main operating systems, there may be tens or even hundreds of SDKs.
When introducing new features, this may turn into a maintenance nightmare. Less important features may be selectively rolled out to less popular SDKs while more important features may be rolled out to your most popular SDKs.
Measuring the API or SDK version is crucial when deciding whether to deprecate particular endpoints and functionality. Without first asking them why they use it, you wouldn't want to phase out the endpoint that your biggest paying client uses.
#11 Top Customers by API Usage 😇
Tracking the top API users may be a major advantage for any business with a B2B focus in terms of understanding how your API is used and where to upsell chances lie.
Many experienced product leaders are aware that many products have power law dynamics, with a small number of power users using them disproportionately more than the average user. Unsurprisingly, these same power users are the ones who typically provide your business with the most income and organic referrals.
Accordingly, keeping tabs on what your top 10 clients are doing with your API is essential.

What endpoints they are calling and how they are calling them can be used to further segment this.
#12 Unique API Consumers 🤠
It's crucial to track API DAU (Monthly Active Users), or unique consumers of an API, because a month's rise in API consumption may be ascribed to just one customer account. This metric can help you assess the growth and acquisition of new customers overall.
To get a complete picture of the health of a product, many API platform teams compare API MAU to their web MAU. If web MAU growth is outpacing API MAU growth, a leaky funnel during integration or implementation of a new solution may be the cause. This is particularly true for businesses whose primary offering is an API, as is the case for many B2B/SaaS companies.
Business/Growth
In contrast to product metrics, business/growth metrics are more concerned with revenue, adoption, and customer success. To better understand who your API users are and track business growth, analytics platforms like Atatus allow enhancing user profiles with customer information from other analytics services.
Conclusion
Tracking the appropriate API metrics is essential for anyone creating and using APIs. Without the proper engineering and product instrumentation, the majority of businesses would not introduce a new web or mobile product.
Similar to this, you wouldn't want to introduce a new API without a means of instrumenting and monitoring the appropriate API metrics. As we witnessed with the API usage metrics, sometimes the KPIs for one team can overlap with those for another team.
The same underlying measure can be seen in various ways. Teams should continue to concentrate on examining the appropriate metrics for their team. For instance, just as IT teams shouldn't care about API retention, product managers shouldn't worry about CPU usage.
With only a fast SDK installation, you can start tracking these KPIs with the help of tools like Atatus API Analytics.
Atatus API Monitoring and Observability
Atatus provides Powerful API Observability to help you debug and prevent API issues. It monitors the consumer experience and is notified when abnormalities or issues arise. You can deeply understand who is using your APIs, how they are used, and the payloads they are sending.
Atatus's user-centric API observability tracks how your actual customers experience your APIs and applications. Customers may easily get metrics on their quota usage, SLAs, and more.
It monitors the functionality, availability, and performance data of your internal, external, and third-party APIs to see how your actual users interact with the API in your application. It also validates rest APIs and keeps track of metrics like latency, response time, and other performance indicators to ensure your application runs smoothly.
#1 Solution for Logs, Traces & Metrics
![]() APM
APM
![]() Kubernetes
Kubernetes
![]() Logs
Logs
![]() Synthetics
Synthetics
![]() RUM
RUM
![]() Serverless
Serverless
![]() Security
Security
![]() More
More