Maximizing Java Application Performance - Configuration and Tuning Tips
In the past, there was a persistent misconception that Java was slow compared to other programming languages. But this idea comes from a time when Java was just starting out. Back then, Java did have some problems that made it seem slow.
For example, it took a long time for Java programs to start running, and the way Java made user interfaces for applications was not very fast.
But things have changed a lot since then. Hence, the outdated belief that Java is slow is exactly that – outdated. Today, Java is much faster and more efficient.
Java has better technology now, like the part that runs Java programs, called the JVM, which has gotten much faster. Also, the way Java makes the parts of programs you see on the screen has improved.
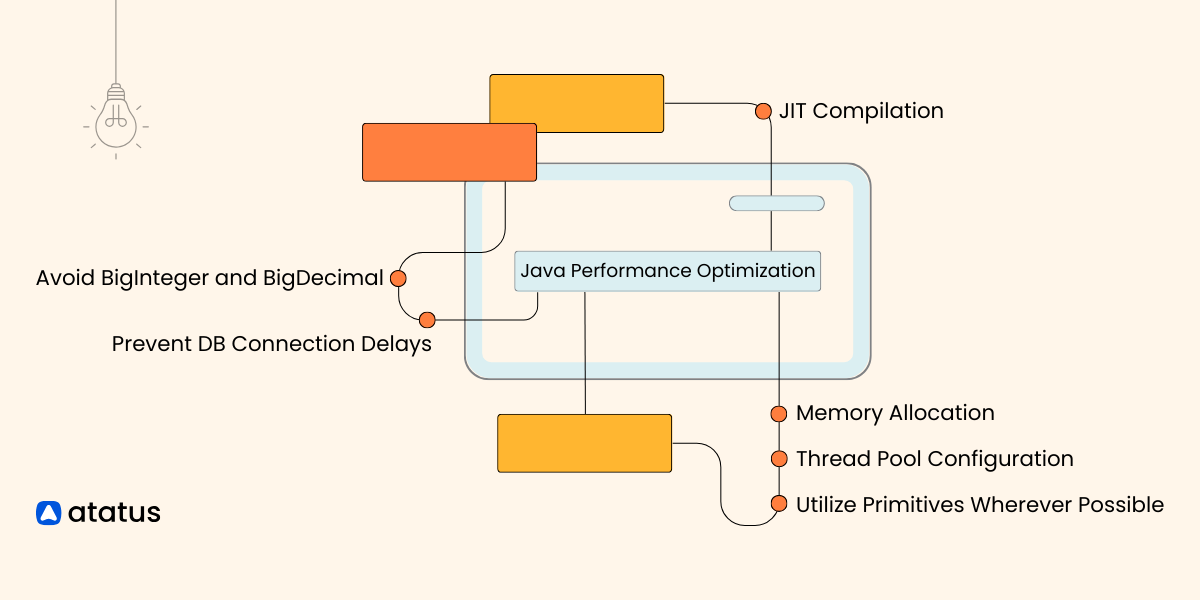
Well! In this blog, we will discuss the concept of Java performance optimization. Let us explore tips, techniques, and strategies that will enhance your Java performance, making your applications as efficient as possible.
So, let's leave behind the misconceptions of the past and unlock the true potential of Java.
- Use the Latest Version of Java
- JIT Compilation
- Utilize Primitives Wherever Possible
- Avoid BigInteger and BigDecimal
- Memory Allocation
- Selecting the Optimal Garbage Collection Algorithm
- Thread Pool Configuration
- Use Profiling and Monitoring Tools
- Optimize When Essential
- Prevent Delays in Database Connections
1. Use the Latest Version of Java
Utilizing the most up-to-date version of Java can offer a strategic advantage in optimizing the performance of your Java applications. When Java undergoes updates, it frequently introduces refinements that result in accelerated and more efficient execution of your code.
These enhancements play a vital role in ensuring that your programs manage computer memory in a more resourceful manner, contributing to seamless operations.
Furthermore, embracing the current Java version guarantees that your applications remain safeguarded against glitches and security vulnerabilities.
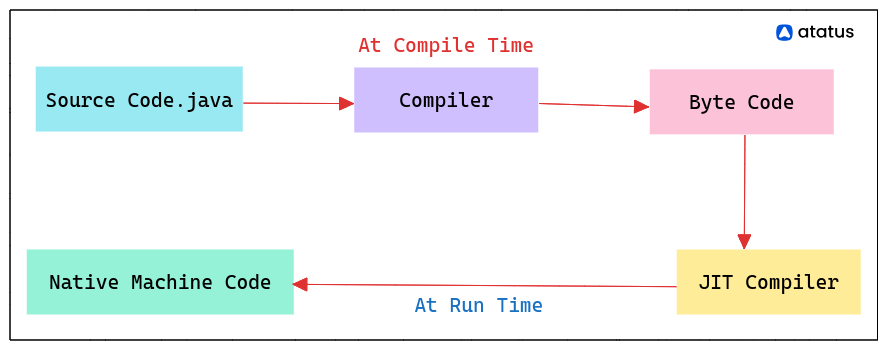
2. JIT Compilation
Java's Just-In-Time (JIT) compiler plays a significant role in optimizing the performance of your application by converting bytecode into native machine code. Here are some JIT compilation considerations:
a. Use the Latest JVM: Keep your Java Virtual Machine up to date. Newer JVM versions often include improvements in JIT compilation and runtime optimizations that can boost your application's performance.
b. Profile and Optimize: Profile your application to identify hotspots - sections of code that consume a disproportionate amount of CPU time. Optimize these hotspots to improve overall application performance.
c. Ahead-of-Time Compilation: Consider using ahead-of-time (AOT) compilation with tools like GraalVM. AOT compilation can reduce startup times and improve the overall performance of your application.
Running your application for a few minutes allows JIT to optimize code paths, resulting in better performance.
3. Utilize Primitives Wherever Possible
When you are working on making your Java programs faster, consider using basic data types like numbers, characters, and true/false values whenever you can.
These types are like the building blocks of computer programming – they're easy for the computer to work with and understand quickly. These basic types take up less space in the computer's memory compared to more complex types.
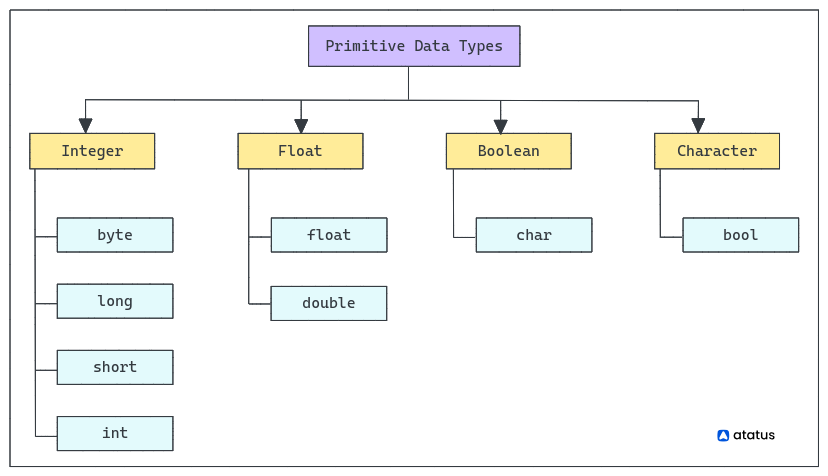
When you use these basic types, your program can perform operations faster. This is especially important when you are doing calculations or tasks that need to be done quickly. This helps your program run more efficiently.
Whenever appropriate, use primitive types to minimize memory overhead and increase execution speed.
4. Avoid BigInteger and BigDecimal
When you're writing code in Java, it's usually best to stick to regular numbers like 1, 2, 3, and so on. But sometimes, you might need really big or super precise numbers for things like really large calculations or dealing with money. That's where BigInteger and BigDecimal come in. They're like special tools that can handle these big and precise numbers.
However, these special tools can also slow down your code because they need extra work from the computer. Regular numbers are faster for the computer to handle. So, if you can, try to use regular numbers whenever possible, especially for everyday calculations. Save the BigInteger and BigDecimal features for those times when you really need them.
Remember, it's all about balance. Using regular numbers can make your code faster, but sometimes you might need the extra power of BigInteger and BigDecimal for specific tasks. If high performance is a priority and precision requirements allow, consider using primitive types or fixed-point arithmetic instead.
Here's an example of adding two large numbers using both BigInteger and long:
import java.math.BigInteger;

public class LargeNumberExample {
    public static void main(String[] args) {
        // Using BigInteger
        BigInteger bigInteger1 = new BigInteger("123456789012345678901234567890");
        BigInteger bigInteger2 = new BigInteger("987654321098765432109876543210");
        BigInteger sumWithBigInteger = bigInteger1.add(bigInteger2);
        System.out.println("Sum with BigInteger: " + sumWithBigInteger);

        // Using long
        long long1 = 1234567890123456789L; // Note the 'L' suffix for long literals
        long long2 = 9876543210987654321L;
        long sumWithLong = long1 + long2;
        System.out.println("Sum with long: " + sumWithLong);
    }
}
In this example, we're adding two large numbers represented as strings using BigInteger and as long variables. While BigInteger can handle arbitrarily large numbers, it's slower and requires more memory compared to long. For numbers within the range of long, using the primitive data type is more efficient.
5. Memory Allocation
Efficient memory management is a cornerstone of Java application performance. Proper memory allocation can significantly impact both the responsiveness and the scalability of your application.
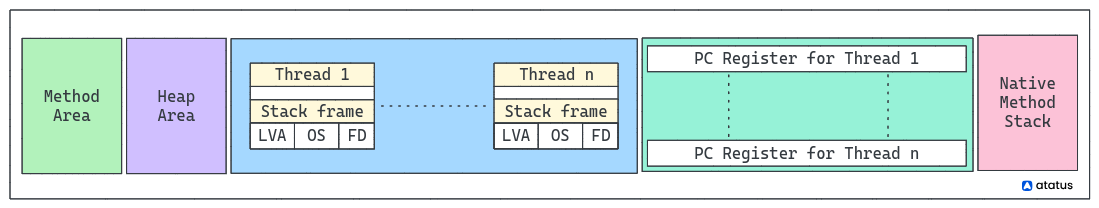
Here are some memory allocation strategies to consider:
a. Heap Size Tuning: The Java Virtual Machine (JVM) uses a memory pool called the heap to store objects. It's crucial to configure the heap size according to the requirements of your application. Setting it too small can lead to frequent garbage collection, causing application stalls, while setting it too large can result in wasted memory.
b. Object Pooling: Reusing objects through object pooling can reduce the overhead of creating and destroying objects, thus improving memory efficiency. Libraries like Apache Commons Pool can help implement object pooling in your application.
6. Selecting the Optimal Garbage Collection Algorithm
When developing Java applications, it is important to think about memory management, especially how the language deals with data that is no longer needed, often called "garbage". The process of Garbage Collection (GC) identifies and clears out memory that is taken up by things we don't need anymore. However, Java offers various GC algorithms, each with distinct characteristics suited to different scenarios.
If you don't specifically tell the application which Garbage Collection (GC) method to use when you start it, the Java Virtual Machine (JVM) will automatically pick the default one. However, this choice of GC method can have a big impact on how well your application works.
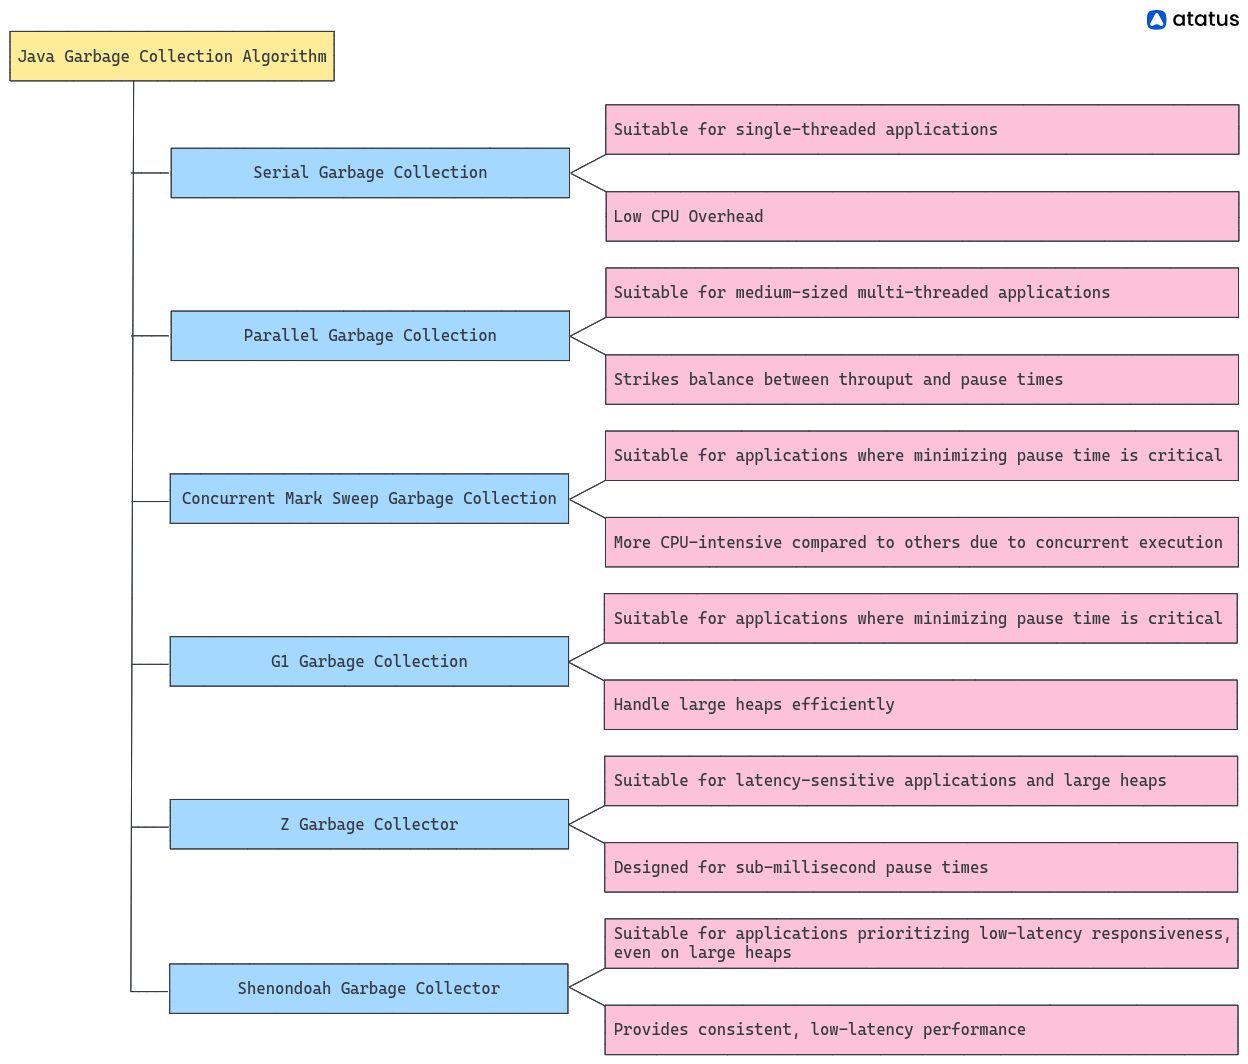
Deciding which GC method to use depends on what your application is like and what it needs. You should think about things like how your application uses memory, how fast it needs to respond, and what kind of hardware it's running on. Thus, when it comes to GC algorithms, making the right choice can really make a difference in how your application performs and responds to users.
7. Thread Pool Configuration
Thread management is crucial for achieving optimal concurrency in Java applications. Poorly configured thread pools can lead to resource contention, deadlock, or inefficient CPU utilization. Here are some thread pool configuration tips:
a. ThreadPoolExecutor: Use the ThreadPoolExecutor class to create custom thread pools. It allows you to set the core and maximum pool sizes, keep-alive times, and queueing strategies, which can be tailored to your application's specific needs.
b. Monitor and Adjust: Continuously monitor the thread pool's performance metrics, such as the thread utilization and queue size. Adjust the configuration parameters as needed to strike a balance between concurrency and resource utilization.
c. Consider Asynchronous Programming: In some cases, you can improve responsiveness and reduce the need for large thread pools by embracing asynchronous programming techniques. Java provides CompletableFuture and reactive programming frameworks like Project Reactor or RxJava to handle tasks asynchronously, which can be particularly beneficial for I/O-bound operations.
Avoid overloading the system with too many threads, which can lead to contention and decreased performance.
8. Use Profiling and Monitoring Tools
Profilers serve as specialized tools that illuminate the inner workings of code execution, revealing areas where performance might be compromised. This approach not only helps developers understand where delays occur but also enables them to comprehend the underlying reasons behind their occurrence.
By using different kinds of profilers like CPU and memory profilers, developers can get a better understanding of the various aspects that affect how well their program works.

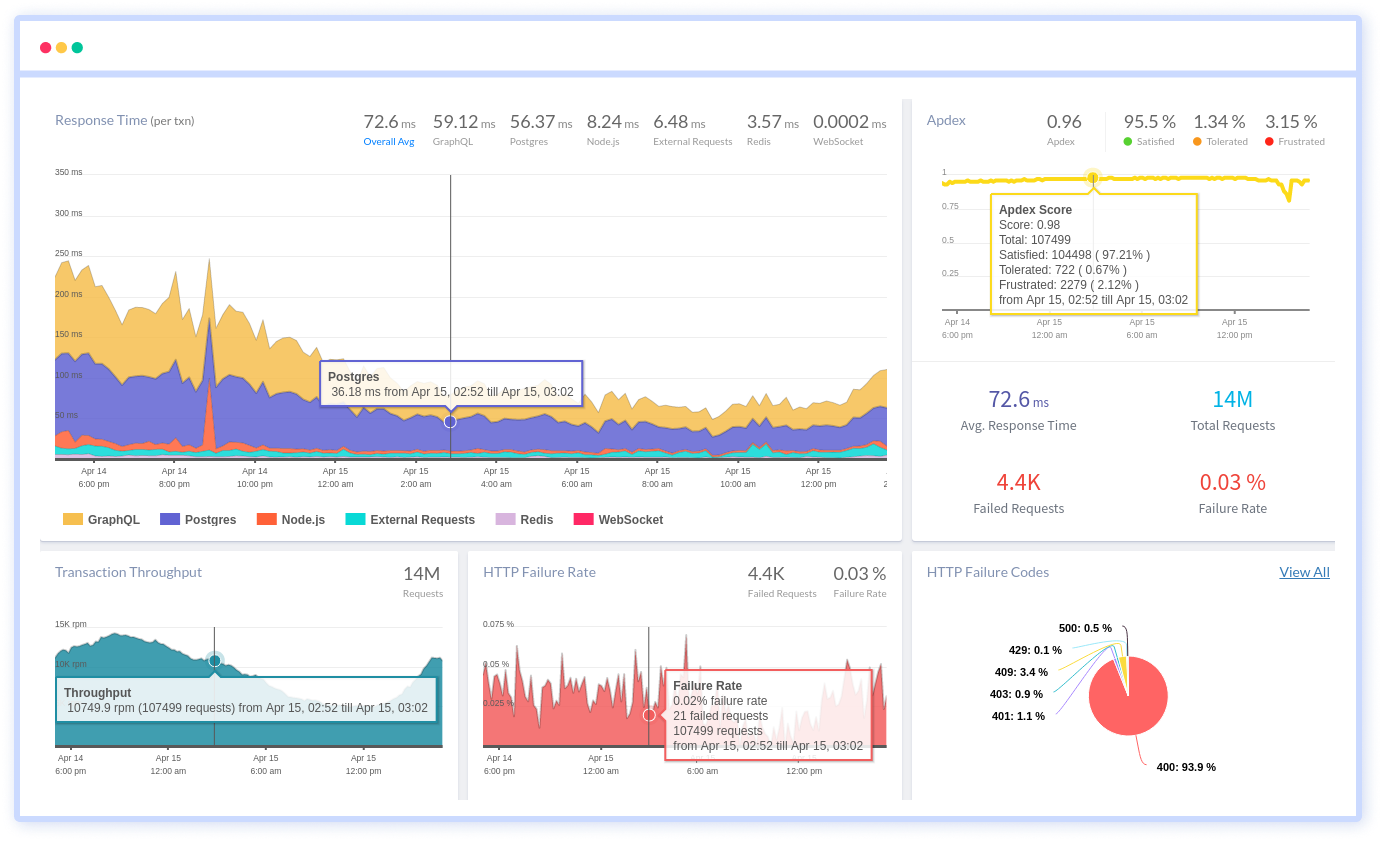
Use profiling tools like VisualVM, YourKit, or JProfiler to analyze your application's performance. Profilers can help you identify bottlenecks, memory leaks, and areas for improvement.
Also, consider using Application Performance Monitoring (APM) solutions like Atatus to gain deep insights into your application's performance and troubleshoot issues proactively.
9. Optimize When Essential
Creating valuable programs is more important than aiming for speed from the start. If a program lacks efficiency, its structure should allow for improvements later. Good programs follow the principle of keeping data organized and separate, so changes can be made without causing problems in the whole system.
This doesn't mean ignoring performance issues until the program is done. Although individual implementation problems can be resolved at a later stage for the purpose of optimization, issues originating from the fundamental architecture could necessitate a complete revamp to rectify.
10. Prevent Delays in Database Connections
Establishing a database connection often incurs a notable time overhead, potentially surpassing the time required for executing the actual queries post-connection.
To overcome this, the prevalent practice in modern web applications is to implement connection pooling. Connection pooling involves pre-establishing a set of connections to the database. These connections are then made available for application components to borrow, utilize, and subsequently return to the pool.
This method makes the most out of using the same connections for different tasks, which helps cut down on the extra work needed to create new connections each time something needs to be done.
Minimize the time spent establishing database connections by using connection pooling libraries like HikariCP or Apache DBCP. Additionally, optimize your database queries and indexing to reduce query execution times.
Thus, it is important to carefully adjust the settings to make the most of connection pooling's performance advantages and avoid problems that can arise from incorrect sizing.
Conclusion
Java was once perceived as a slow language when compared to other programming languages. But, today it has evolved into a powerhouse of efficiency and speed. Thus by applying the right strategies, we can harness this potential to its fullest.
We have discussed the critical tips, from keeping your Java version up-to-date for improved performance to using profiling tools for bottleneck identification. We've emphasized the importance of maintaining a balance between optimization and good design, ensuring your programs are both fast and well-structured.
Furthermore, we have highlighted the significance of addressing primary bottlenecks first, employing basic data types for efficiency, and being mindful of when to use specialized numeric classes.
Therefore, equipped with these insights, you can enhance your Java applications, ensuring they run at peak performance and respond to user needs quickly.
Monitor your Java application for errors & exceptions with Atatus
When it comes to ensuring the optimal performance and reliability of your Java applications, monitoring is key. The ability to detect bottlenecks, identify slowdowns, and troubleshoot issues in real-time can significantly enhance the user experience and streamline your development workflow. That's where Atatus comes in.
With its powerful features and intuitive interface, you can gain deep insights into your application's performance metrics, traces, and errors. By visualizing the entire request lifecycle, pinpointing problematic areas becomes a breeze.
With Atatus Java performance monitoring:
- Root Cause Analysis: Quickly pinpoint the root causes of performance regressions.
- Improve User Experience: Deliver faster response times and smoother interactions for users.
- Code Profiling: Profile code execution to identify CPU-intensive or slow sections.
- Reduced Downtime: Minimize downtime through early identification and resolution of issues.
If you are not yet a Atatus customer, you can sign up for a 14-day free trial .
#1 Solution for Logs, Traces & Metrics
![]() APM
APM
![]() Kubernetes
Kubernetes
![]() Logs
Logs
![]() Synthetics
Synthetics
![]() RUM
RUM
![]() Serverless
Serverless
![]() Security
Security
![]() More
More