Top 10 LogicMonitor Alternatives
In today's fast-paced digital world, businesses rely heavily on IT infrastructure monitoring tools to ensure optimal performance and reliability.
LogicMonitor has carved a niche in the market as a comprehensive monitoring solution for complex IT environments. However, the recent security mishap has pushed us to look for other alternatives as well.
Fairly recently, LogicMonitor was in hot waters for its weak default passwords, ultimately leaving them vulnerable to ransomware attacks. The team has responded swiftly and are taking appropriate action, however, we could always guard up better.
And that is why I am bringing you this article on LogicMonitor alternatives. We will discuss some of the top infrastructure monitoring tools available out there, adept with their features and pricing, so that you get a headstart when scourging for security for your infrastructure.
Let’s get started!
Table Of Contents:-
LogicMonitor - Features and Specs
LogicMonitor is a comprehensive SaaS-based monitoring and observability platform designed to help businesses monitor and manage their IT infrastructure, including networks, servers, cloud services, applications, and more.
It offers a range of features and capabilities to ensure the performance, availability, and reliability of your IT systems.
Key Features and Specifications
- Multi-Cloud and Hybrid Monitoring - LogicMonitor supports monitoring of on-premises, cloud-based, and hybrid environments, including AWS, Azure, Google Cloud, and others.
- Automatic Discovery - It automatically discovers devices and services within your environment, reducing the need for manual setup.
- Real-time monitoring and customizable dashboards - Provides real-time visibility into the performance and health of your infrastructure, applications, and services.
- Alerting and Notification - Customizable alerting and notification capabilities allow you to set up alerts for specific conditions and receive notifications via various channels (email, SMS, etc.).
- Performance Metrics - Monitors a wide range of performance metrics, including CPU usage, memory, bandwidth, latency, along with root cause analysis.
- Automation and Integration - Supports integrations with various third-party tools and automation platforms, Offers RESTful API access for custom integrations and extending functionality.
- Scalability - LogicMonitor is designed to scale with your business, accommodating the monitoring needs of small to enterprise-level organizations.
- Community and Support - A wide and vibrant knowledge community to help you with any glitches along the way. Also boosts a mobile application for monitoring on the go.
LogicMonitor is known for its user-friendly interface and its ability to provide end-to-end visibility into IT infrastructure. Its feature set makes it suitable for IT professionals and organizations of varying sizes, from small businesses to large enterprises, looking to proactively manage and optimize their IT systems.
Top LogicMonitor Alternatives:-
Let's look at the top 10 LogicMonitor Alternatives one by one:
1. Atatus
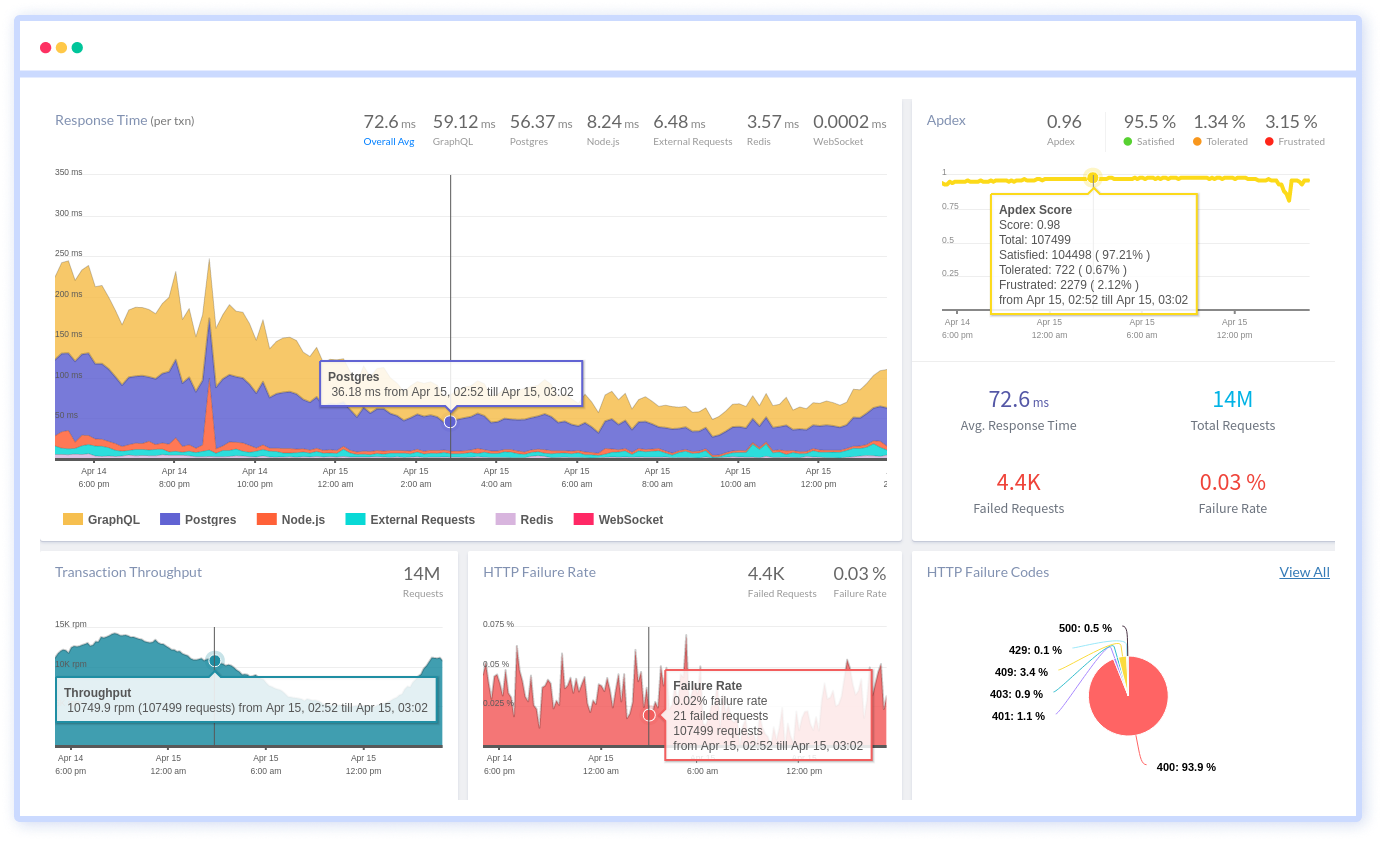
Atatus is an observability and analytics platform, a best LogicMonitor alternative, that provides unified monitoring solutions for Apps, Websites, Servers, and Logs. They provide actionable, real-time insights on your web and backend applications.
Besides APM, RUM, Logs, and API Analytics, they provide an attractive infrastructure monitoring solution. Atatus provides full visibility into infrastructure performance and availability issues of server and cloud instances in an all-in-one dashboard.
- APM with Database Monitoring - Monitor application performance and database interactions for improved troubleshooting and optimization.
- Real User Monitoring - Gain insights into how real users experience your application with performance metrics and user behavior analysis.
- API Analytics - Track and analyze API usage, response times, and errors for better API performance management.
- Host Monitoring - Monitors and manages host performance by taking cues from CPU, memory, and Disk usage among I/O wait time and system uptimes.
- Process Monitoring - Threshold-based alerts for processes using more resources than allotted to them.
- Health Checks - Continuous health checks of all the applications running on the servers, notifications for slow request processing, and so on.
- Package Tracking - Easily identify packages based on their names and versions.
- Container Monitoring - Monitor the performance and resource utilization of containerized applications to optimize resource allocation.
- Kubernetes Monitoring - Gain visibility into Kubernetes clusters to track resource usage, performance, and health of containerized workloads.
- Docker Monitoring - Monitor Docker containers to ensure their performance, resource usage, and availability within your environment.
Also, it Integrates with various third-party tools, including incident management, DevOps, and collaboration tools, to streamline workflows and ensure data is accessible where needed.
With easy installation and great value for price, Atatus offers one of the best infrastructure monitoring solutions available today. Check out the card-less 14-day unlimited free trial here.
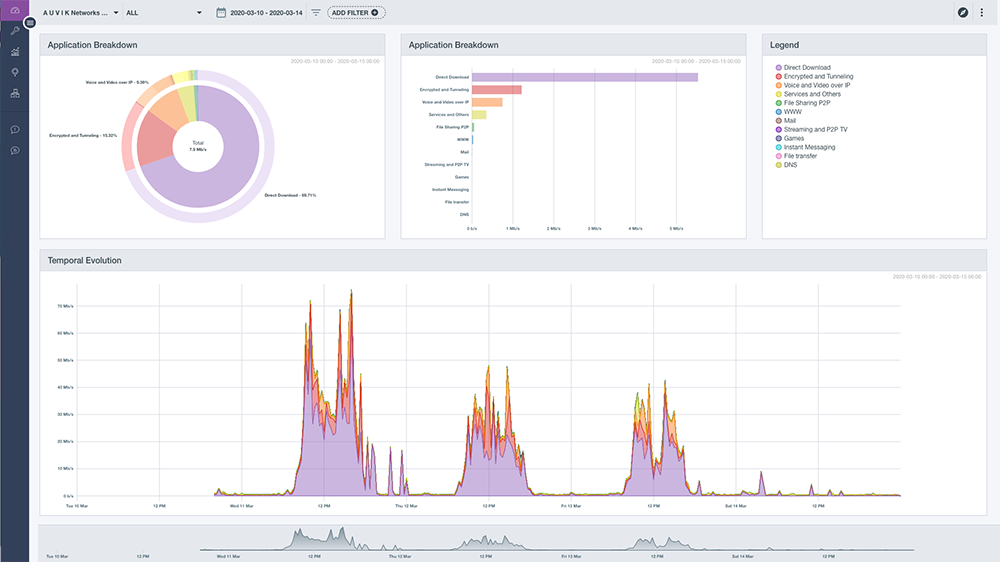
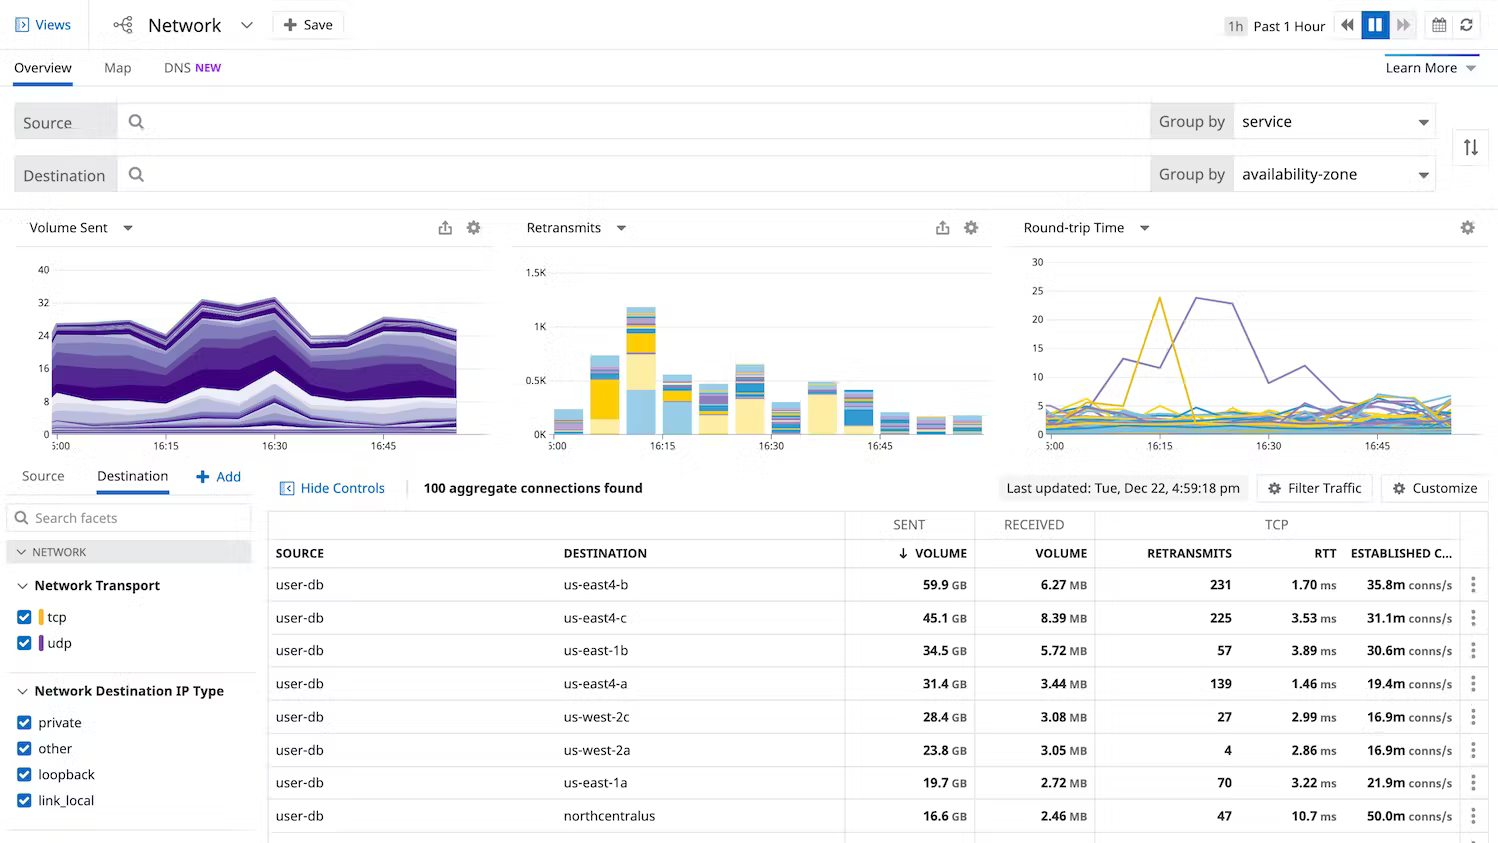
2. Auvik
Auvik specializes in network monitoring and management. Unlike tools primarily focusing on server or application monitoring, Auvik's primary domain is network infrastructure. It is designed to offer IT teams insights into network devices like routers, switches, firewalls, and Wi-Fi controllers across multiple vendors.
- Automated network discovery
- Configuration management and backups
- Auvik integrates with other IT management tools like Professional Services Automation (PSA) systems and ticketing tools. This integration allows for streamlined operations and better workflow management.
- For managed service providers (MSPs), Auvik offers a multi-tenant architecture, making it easier to manage multiple client networks from a single dashboard.
- Auvik TrafficInsights shows who’s on the network, which apps they’re using, and where their traffic is going.
Cons:-
- Although easy to set up, Auvik needs custom OIDs for even simple out-of-the-box monitoring.
- Charges extra for NetFlow monitoring and any other add-ons.
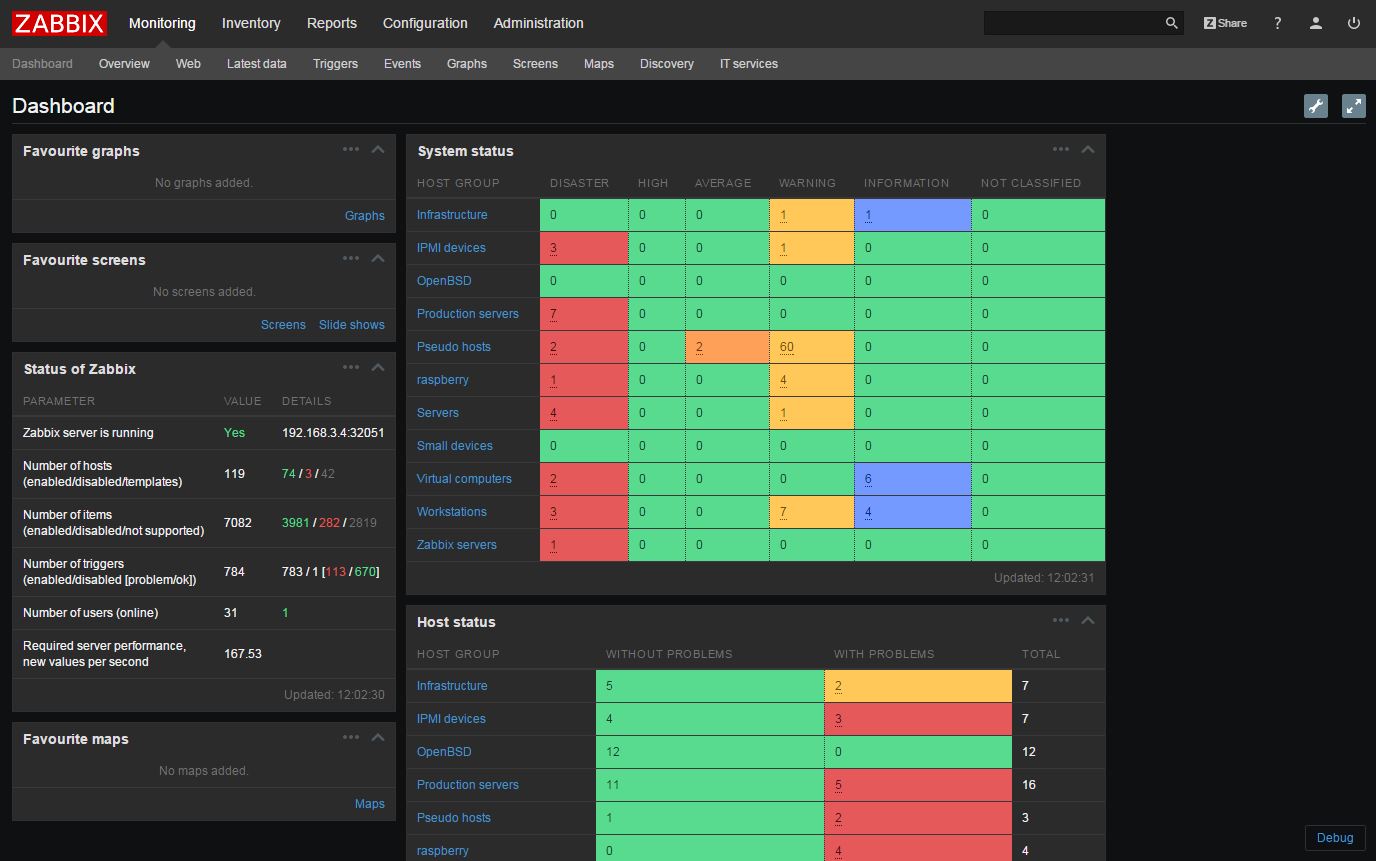
3. Zabbix
Zabbix is an open-source network performance monitoring software. It includes prebuilt official and community-developed templates for integrating with networks, applications, and endpoints and can automate some monitoring processes. Apart from that,
- It is very easy to build out even very large environments via the templating system. You can also start where you are - network monitoring, server monitoring, etc. and then build it out from there as time and resources permit.
- Provides a "plugin architecture" (via XML templates) to allow end users to extend it to monitor all kinds of equipment, software, or other metrics that are not already added into the software already.
- Easy on the pricing and has a lower learning curve.
Cons:
- Difficulty in handling larger loads, having SSDs and adequate server infrastructure while going beyond a hundred hosts.
- IPMI (intelligent platform management interface) checks are not properly carried out.
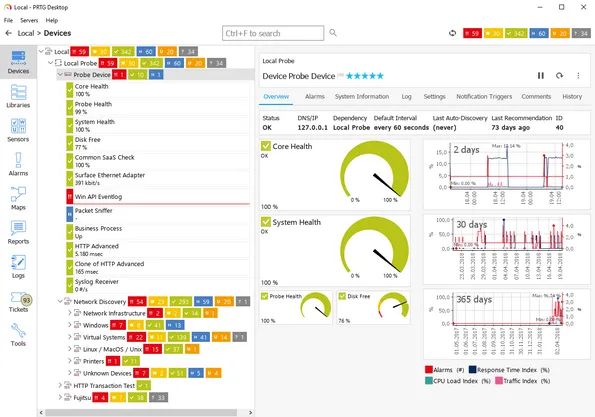
4. PRTG Network Monitor
PRTG Network Monitor, developed by Paessler AG, is a popular network monitoring solution designed to help administrators monitor the performance and availability of their network and IT infrastructure. PRTG provides a comprehensive view of an organization's IT environment and offers various features to ensure the smooth operation of networked systems. Here's an overview of PRTG Network Monitor's key features and functionalities:
- Multi-protocol support - supports SNMP, WMI, Ping and Flow Protocols
- Monitoring in PRTG is based on "sensors." Each sensor monitors a specific aspect or metric of a device, such as CPU load, bandwidth usage, or disk space.
- Offers log monitoring, network and bandwidth monitoring apart from cloud.
- Support for NetFlow, sFlow, jFlow, and other flow protocols provides deeper insights into network traffic and usage patterns.
- SSL encryption, two-factor authentication, and user access rights management ensure the security and integrity of monitoring data.
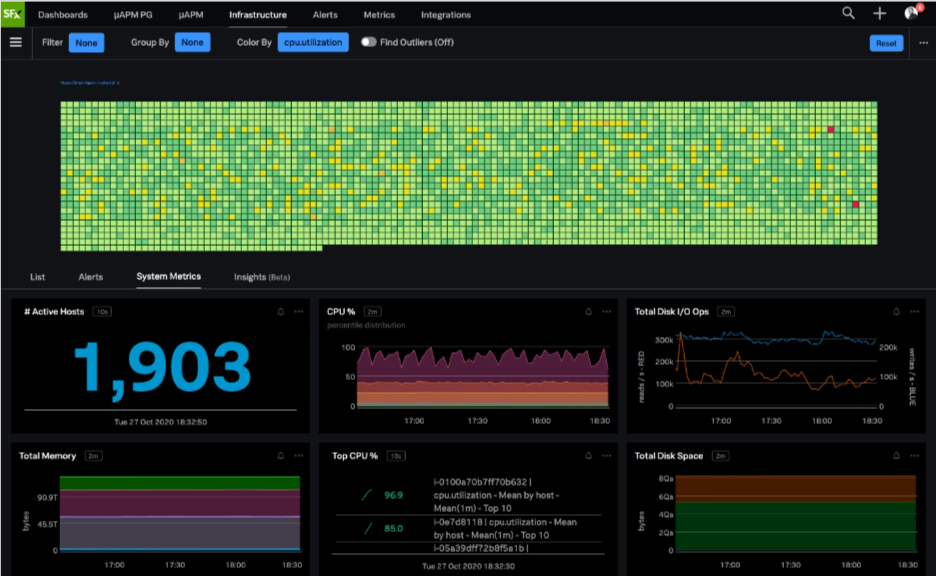
5. Splunk
SignalFX is Real-Time Cloud Monitoring and Observability for Infrastructure, Microservices and Applications. Splunk acquired SignalFX in August 2019.
A new SignalFX product, SignalFx Microservices APM, was released in March 2020 to detect issues, provide real-time app troubleshooting, and future-proof expectations. Pricing starts at $15 per month.
- A unified platform for observability and monitoring
- Supports integrations with popular infrastructure components, cloud platforms, and third-party tools.
- Splunk supports monitoring of infrastructure provisioning and changes through Infrastructure as Code (IaC) platforms like Terraform and Ansible.
- Supports interactive and real-time data exploration.
- Anomaly detection and infrastructure mapping
- Container and orchestration support
- Utilizes machine learning and artificial intelligence for predictive analysis and AIOps capabilities to proactively identify and resolve infrastructure issues.
Cons:
- Reports of false alarms
- Mobile application is not easily navigable
- No library for .net
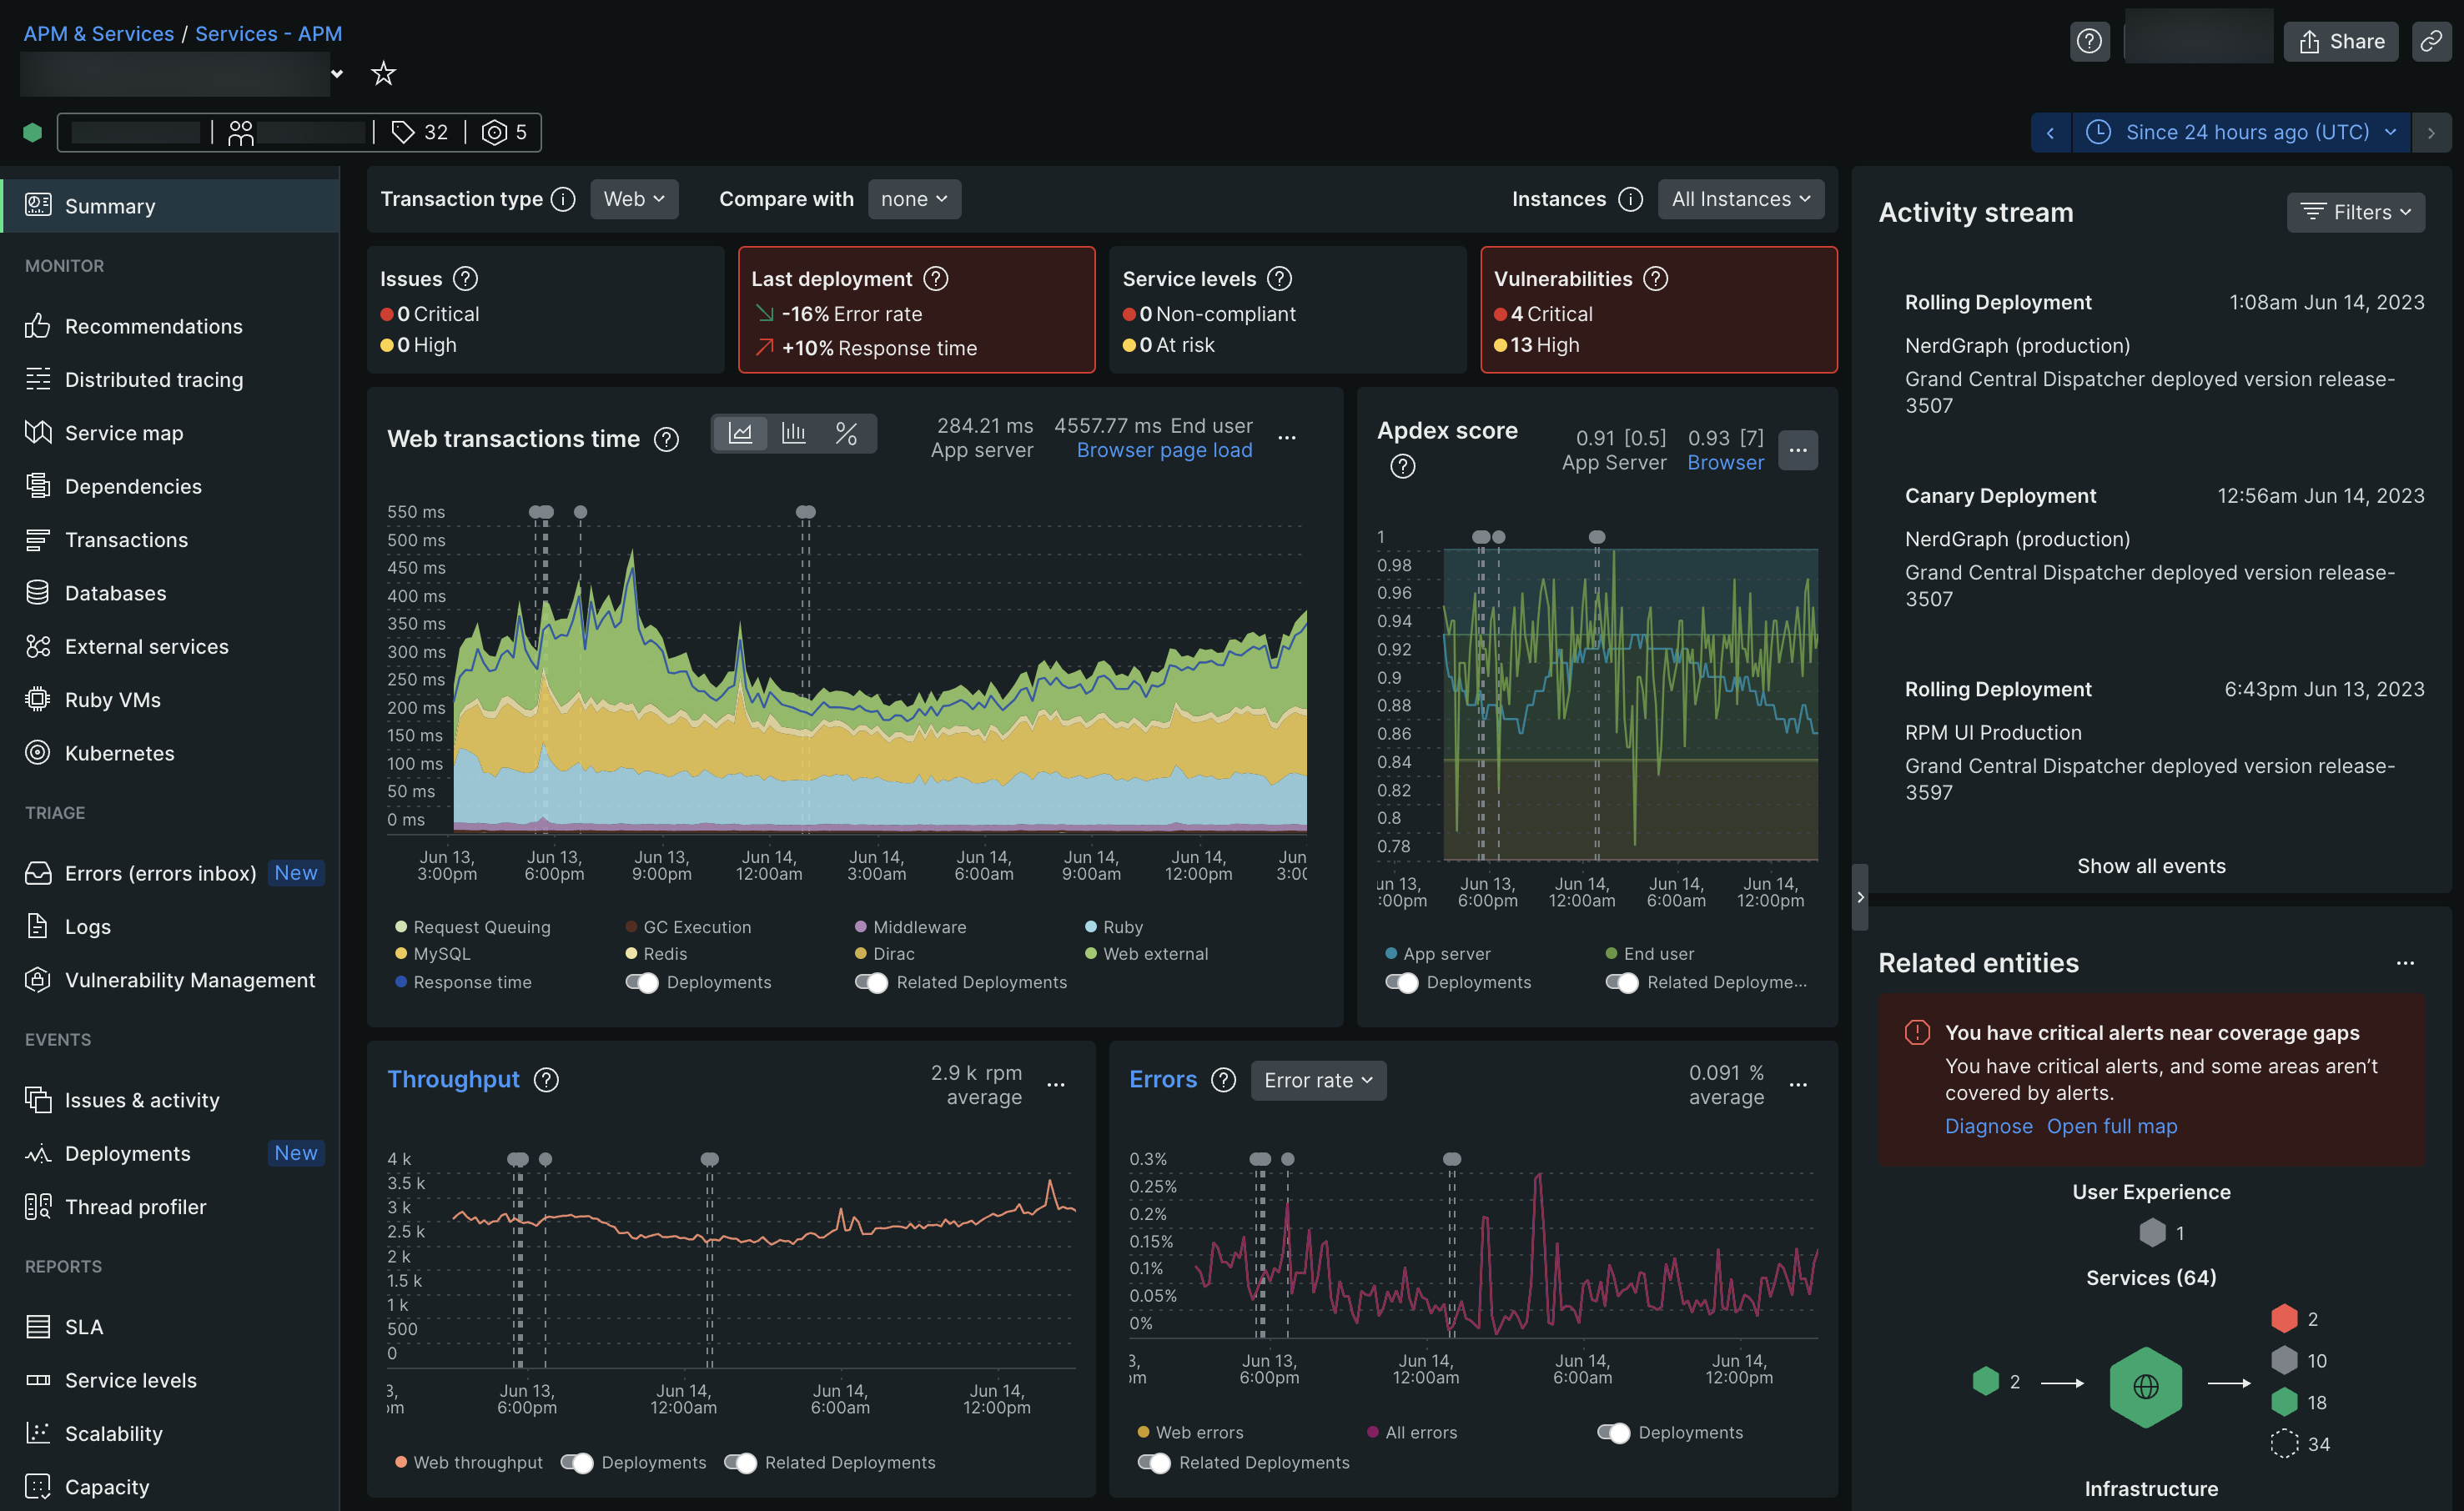
6. New Relic
New Relic is a SaaS-based web and mobile application performance management provider for the cloud and the data center. They provide code-level diagnostics for dedicated infrastructures, the cloud, or hybrid environments, and real-time monitoring.
Their standard monitoring package starts at $99 per month per user. Also, New Relic has a native integration with IaaS service which makes it easier to set up and deploy.
- Deep visibility into application code and performance
- Track CPU, memory, disk, and network usage for better resource management
- Track user experiences and identify performance problems
- Centralized log management and analysis
- Monitor AWS Lambda functions and Azure Functions
- On-premises and cloud deployment options
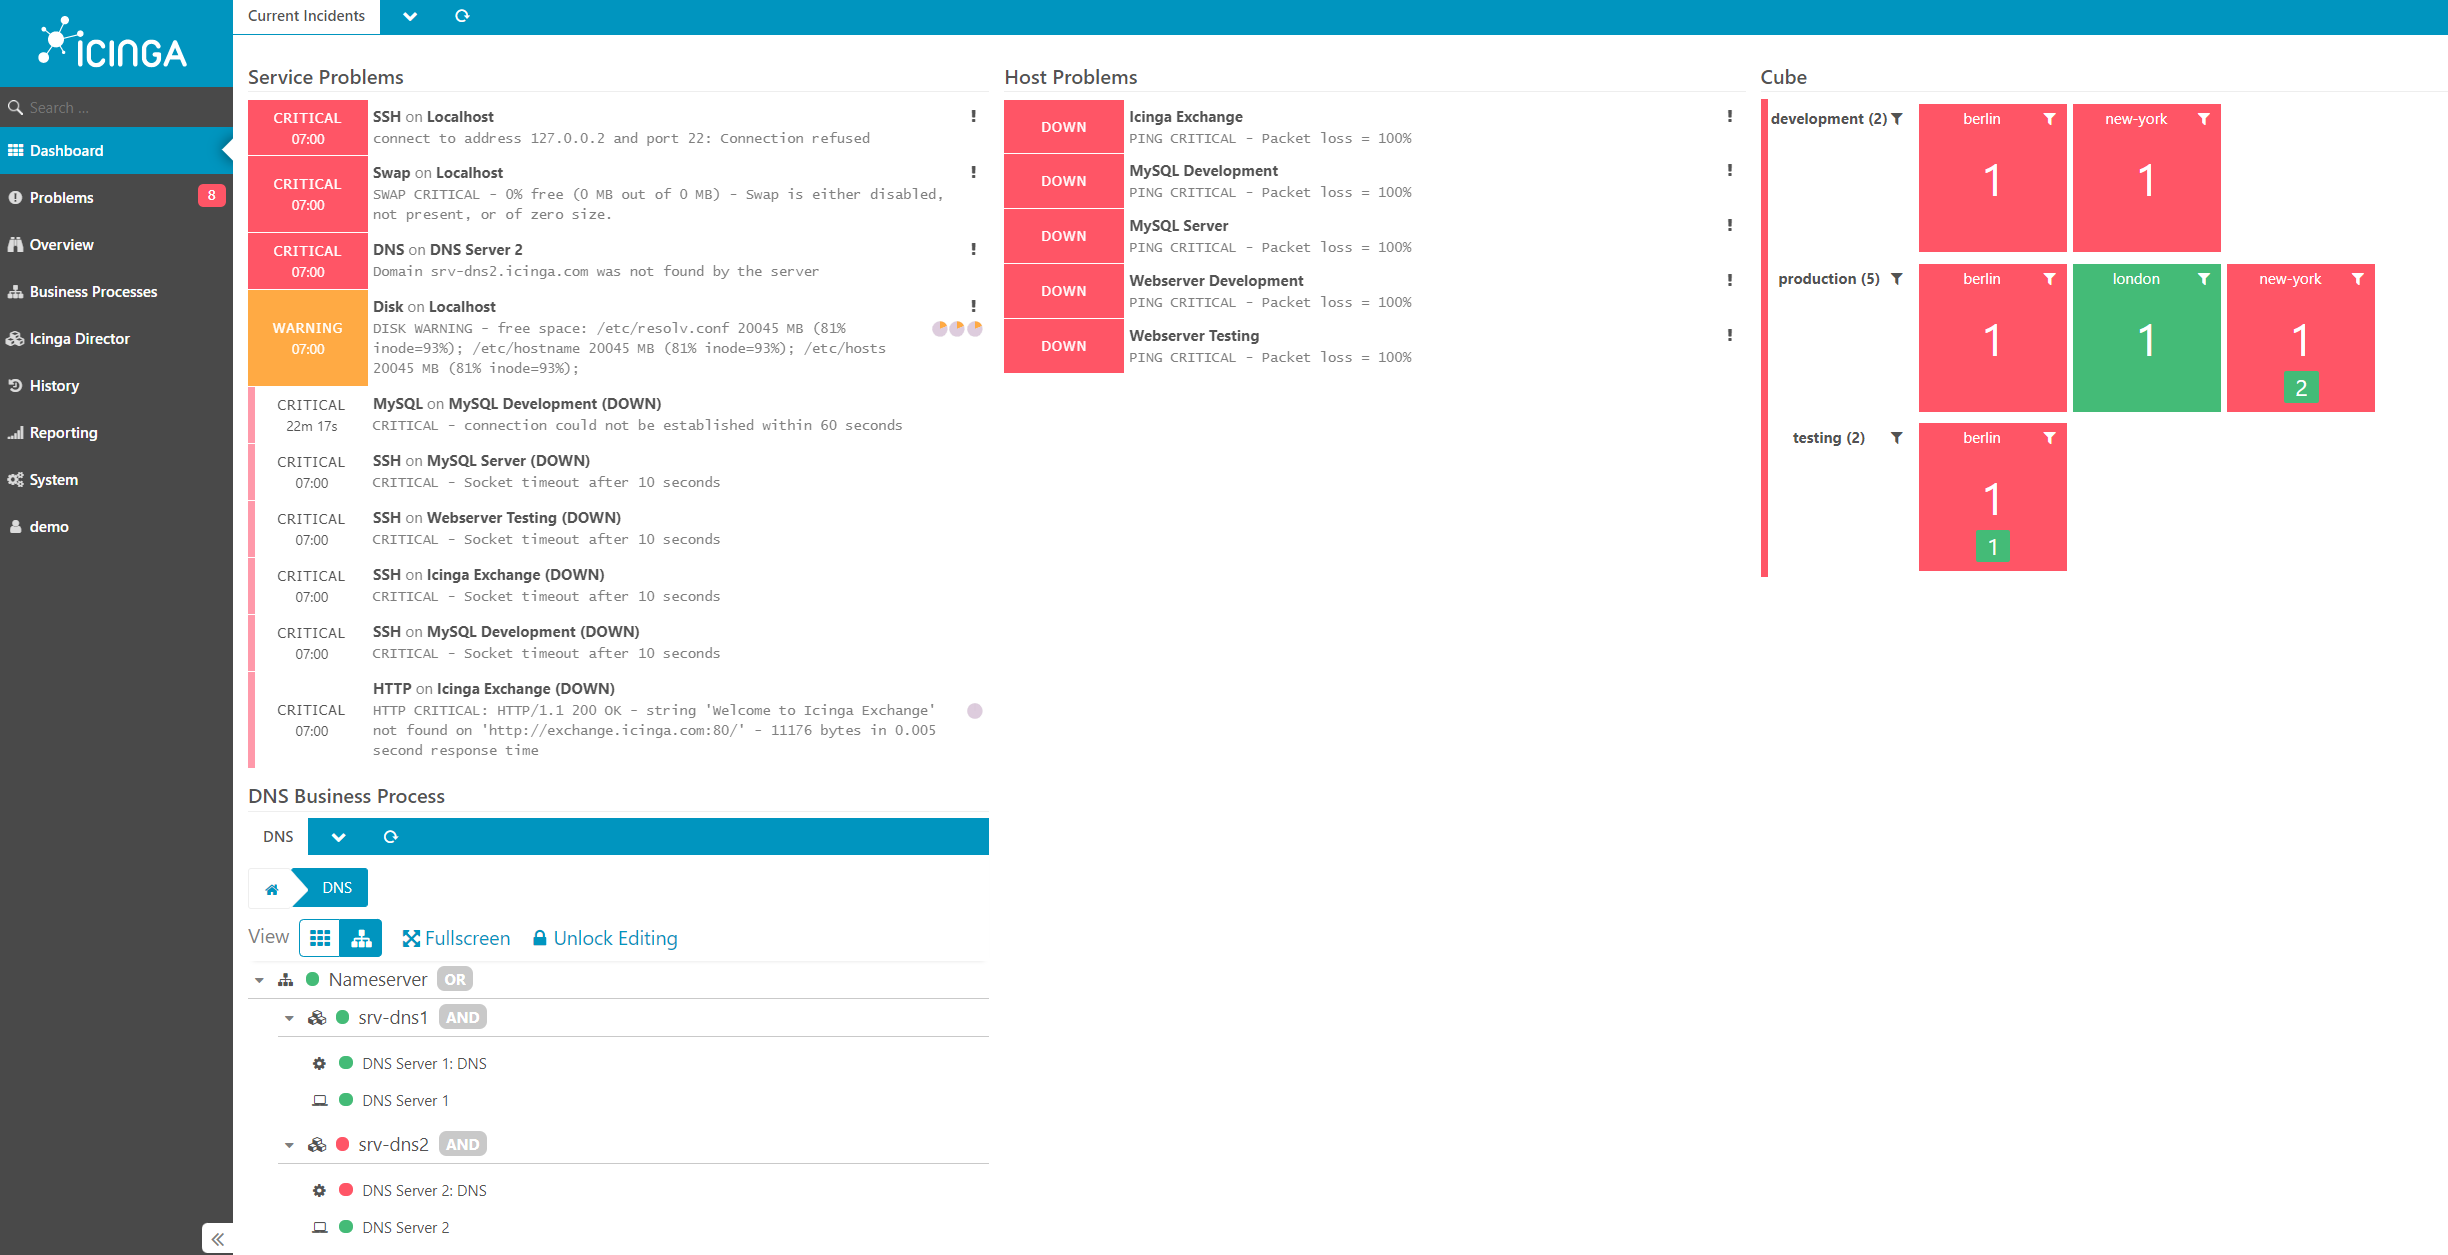
7. Icinga
Icinga is an open-source infrastructure monitoring and alerting system designed to monitor a wide range of infrastructure elements, including servers, network devices, and services.
- Multi-platform support - Linux, Unix, and Windows.
- Events, logs, host monitoring, and distributed tracing
- Icinga allows you to define dependencies between services, ensuring that alerts are only generated for root causes and not for downstream consequences of an issue.
- Notifications and alerts
Cons:
- Need to keep the dashboard open to get alerts
- No segregation of environments or clients and the data can be overwhelming
- Icinga supports a centralized configuration system akin to something like svn or git. Understanding how this works and using it in practice can be a challenge for beginners.
8. Datadog
Datadog is a monitoring service for IT, and DevOps teams who write and run applications at scale, and want to turn the massive amounts of data produced by their apps, tools and services into actionable insight.
Pricing starts at $15 per month per host for infrastructure monitoring and can be customized to monitor 500+ hosts at the enterprise level.
- Agent-based monitoring of CPU usage, memory, disk I/O and network traffic
- Comes with autodiscovery
- Comprehensive metric collection with built-in integrations
- Easy integration with Datadog APM
- Offers both cloud and on-premises monitoring support
- APIs and libraries to create custom solutions for your application
- Easy alerts and notifications
Setbacks:
- Set-up is tiring and requires expertise
- Bit on the higher side of the learning curve
- Unavailability of open-source tools integrations
Scored a 100% on the marketing promises and 89% on delivering good value for the price.
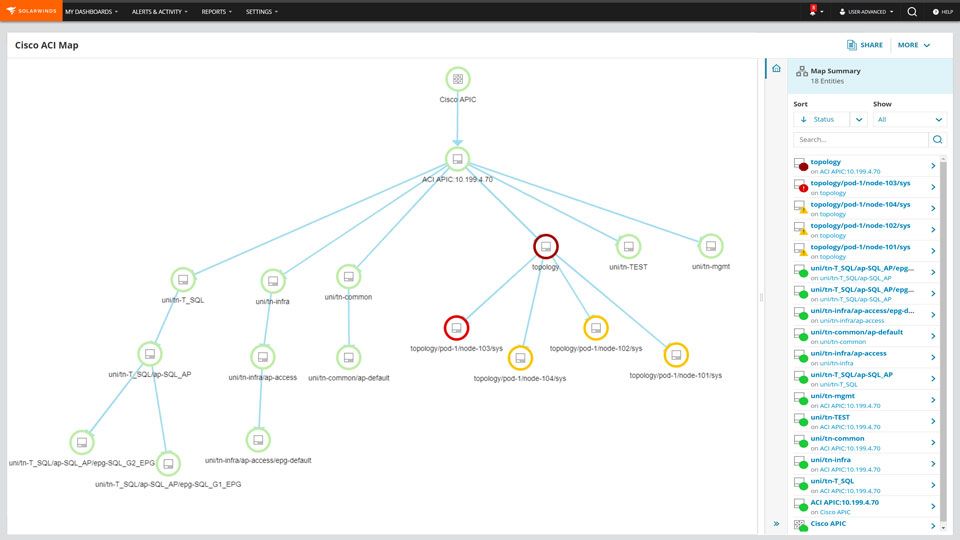
9. SolarWinds Server and Application Monitor
SolarWinds SAM is a versatile solution suitable for organizations of different sizes and industries looking to proactively manage and optimize their server and application infrastructure.
SolarWinds SAM is a versatile solution suitable for organizations of different sizes and industries looking to proactively manage and optimize their server and application infrastructure.
The entire package comes for $2995, though it might sound costly, this is still less than LogicMonitor. But less is not always best. Users have found LogicMonitor features more exciting and useful than SAM, visual interface being better to navigate and its ability to manage much larger dataset.
- Server monitoring
- APM - application monitoring, transaction tracing and code-level insights
- Integrates with VMware and Hyper-V for infrastructure monitoring
- Tracks storage performance
- Integrates with all other Solarwinds products, supports third-party applications
- Good customer support and a vibrant community.
Setbacks:
- Higher learning curve and not very user-friendly
- Setting up is a task.
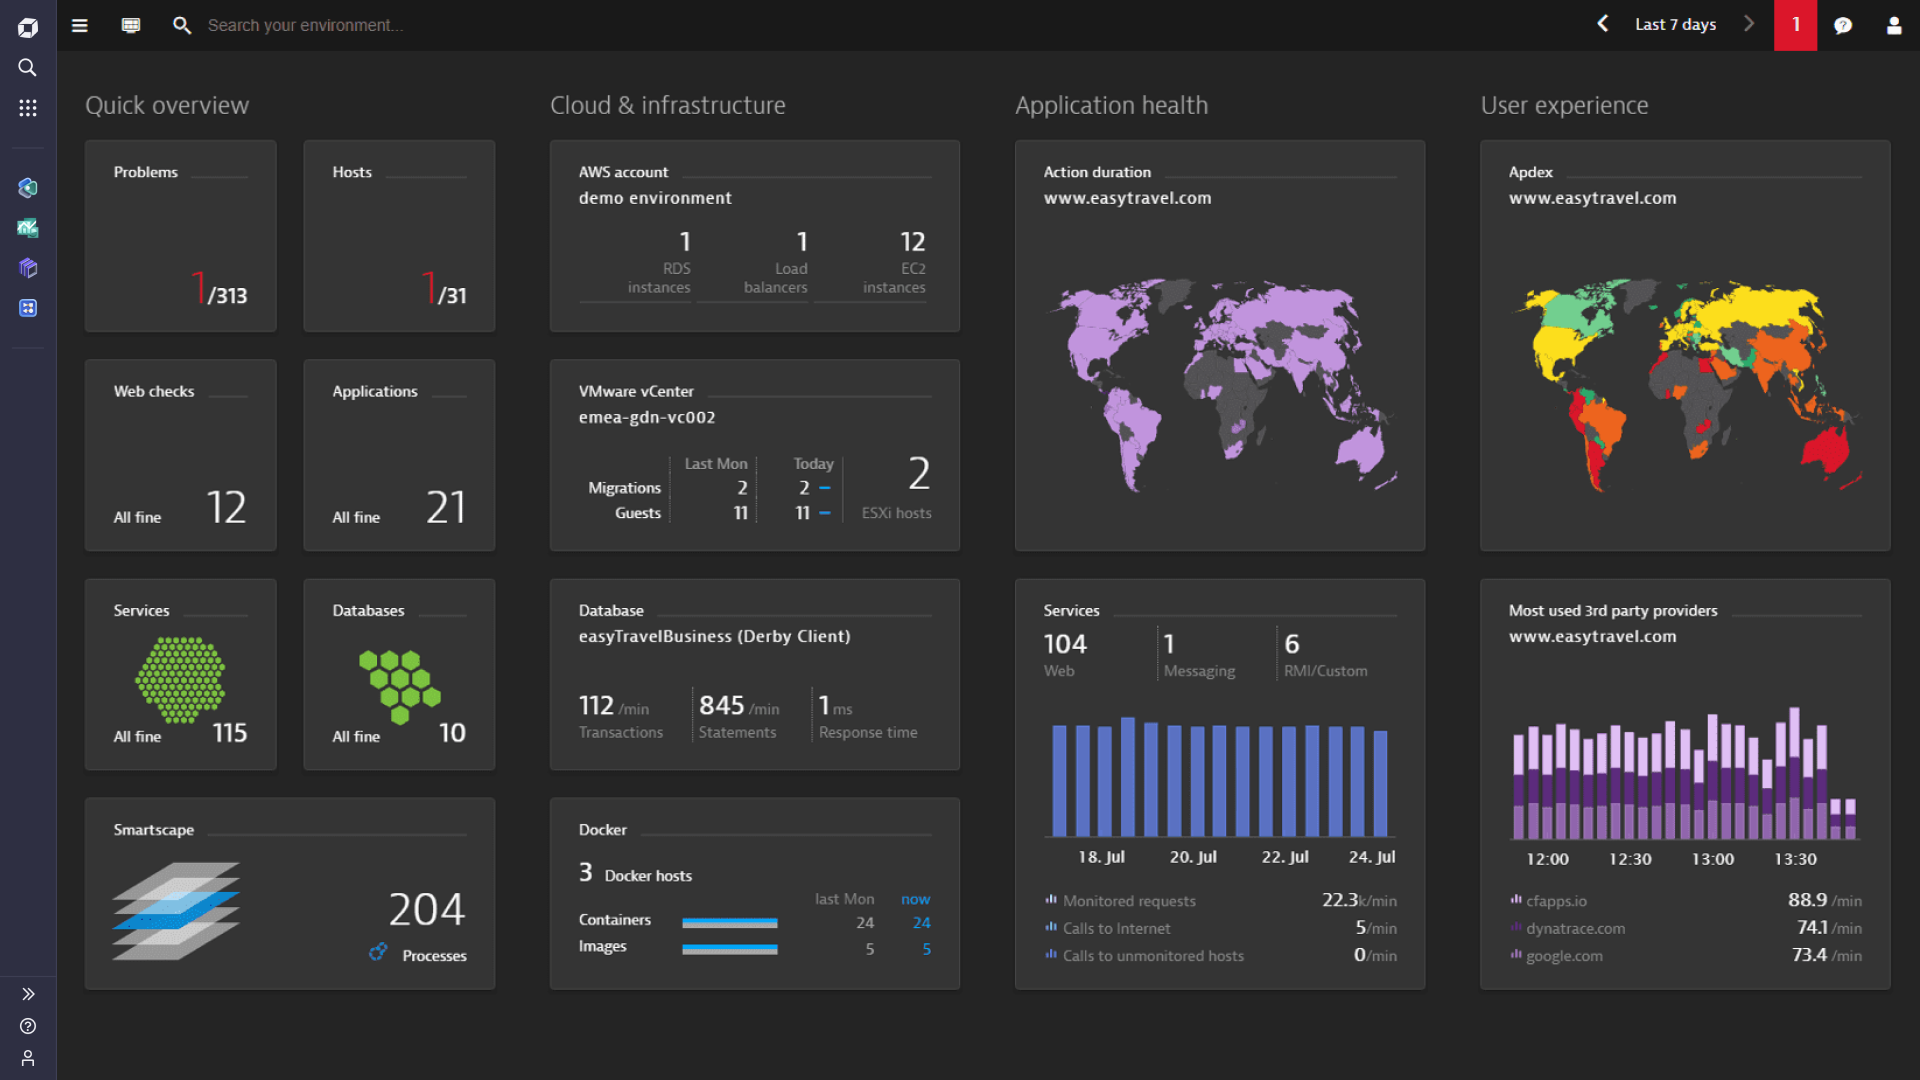
10 .Dynatrace
Dynatrace Infrastructure Monitoring provides real-time visibility into the performance, health, and resource utilization of your IT infrastructure components, both on-premises and in the cloud. Here are the key aspects and features of Dynatrace Infrastructure Monitoring:
- Automated discovery
- Establishes dynamic baseline for every metric it collects
- AI-driven root cause analysis and topology maps
- Provides full-stack monitoring, cloud, container and network monitoring
- API access and third-party integrations with maximum scalability
Dynatrace Infrastructure Monitoring is part of the larger Dynatrace platform, which includes Application Performance Monitoring (APM), digital experience monitoring, and more—providing actionable insights into the entire stack, from infrastructure to end-user experience.
Summary
There are several alternatives to LogicMonitor that can help businesses effectively monitor their infrastructure and applications. Atatus, Auvik, Dynatrace, Datadog, New Relic, Splunk, SolarWinds, PRTG, Zabbix, and Icinga are all viable options with their own unique features and benefits.
When considering which solution to choose, it's important to assess your organization's specific needs and budget. Whether you're looking for a comprehensive solution with advanced analytics or a more budget-friendly option with basic monitoring capabilities, there is an alternative out there that can meet your requirements.
Ultimately, choosing the best infrastructure monitoring solution can help businesses optimize their operations, minimize downtime, and improve overall performance.
#1 Solution for Logs, Traces & Metrics
![]() APM
APM
![]() Kubernetes
Kubernetes
![]() Logs
Logs
![]() Synthetics
Synthetics
![]() RUM
RUM
![]() Serverless
Serverless
![]() Security
Security
![]() More
More


![New Relic vs Splunk - In-depth Comparison [2026]](/blog/content/images/size/w960/2024/10/Datadog-vs-sentry--19-.png)
![New Relic vs Sentry - Which Monitoring Tool to Choose? [2026]](/blog/content/images/size/w960/2024/10/VS--1-.png)