What to Expect When You Migrate to Atatus APM

As organizations aim for exceptional software reliability and user satisfaction, migrating to Atatus APM is a key upgrade in application monitoring.
With nearly 80% of companies facing costly downtime exceeding $300,000 per hour, robust APM solutions like Atatus are crucial. It helps teams quickly identify bottlenecks, optimize performance, and improve the customer experience through comprehensive, real-time insights.
This migration journey empowers teams with easy onboarding, intelligent deployment tracking, and unified dashboards to ensure reliable, high-performing applications that drive business growth.
Table of Contents:
- Why Choose Atatus for Application Performance Monitoring?
- Getting Started: Your Atatus Migration Journey
- Key Metrics and Their Impact
- How Atatus APM Dashboard Features Help Your Team
- Best Practices Post-Migration with Atatus APM
Why Choose Atatus for Application Performance Monitoring?
Modern applications span microservices, APIs, cloud workloads, containers, and complex user flows. Atatus was designed to address the operational challenges of these environments with real-time monitoring across each backend component, granular visibility into transactions, and actionable analytics for rapid problem resolution.
Request a demo for your application today and see how Atatus can provide real-time insights to optimize your application's performance.
Key strengths of Atatus APM include:
- Full end-to-end tracing across microservices, queues, and distributed environments for faster root-cause analysis
- Effortless integration with cloud and multi-cloud stacks, setup takes only a few simple steps
“It's easy to set up, simple to use, has great metrics, and is simple to pinpoint pain points in the app. Great customer support.” - G2 Review →
- Dynamic service map that visualizes every service dependency and interaction in one unified view
- Deep API analytics to track endpoint performance, slow calls, spikes, and failure patterns effortlessly
- Real-time metrics covering throughput, error rates, latency, and resource usage to spot issues instantly
- Atatus does not limit your visibility to the last 30 days. You can track performance and errors over longer periods,
- Atatus offers a clear pricing model. There are no hidden tiers, no confusing formulas for data usage or feature access.
“The pricing system is very transparent and understandable. The support is top-notch, always in touch and helps to solve any questions.” - Capterra Review →
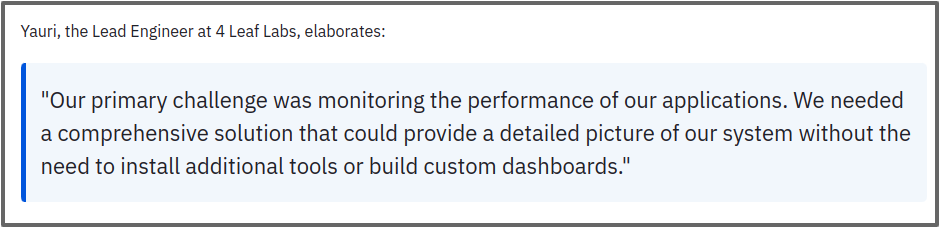
Here is a real-world example of how Atatus helped a team simplify monitoring, improve performance, and gain full-stack visibility. Click to read the full 4 Leaf Labs case study
Getting Started: Your Atatus Migration Journey
When you begin your migration to Atatus APM, after creating your projects and accessing the dashboard, the next crucial step is installing the appropriate monitoring agents for your applications. Atatus supports multiple programming languages with dedicated agents designed for seamless instrumentation and detailed performance insights.
Depending on your application’s stack, you can select and follow the specific guides below:
- PHP Agent — Monitor PHP applications and frameworks with step-by-step installation and customization instructions.
- Node.js Agent — Tailored for Node.js environments, helping you track event loops, async calls, and database queries.
- Java Agent — For Java applications, supporting JVM monitoring and transaction tracing.
- Ruby Agent — Custom-built to handle Ruby and Rails app performance.
- Python Agent — Instrument your Python services including Django and Flask.
- Go Agent — Optimized for Go applications, providing efficient trace collection.
- .NET Agent — Comprehensive monitoring for .NET frameworks and applications.
Additionally, explore the general Atatus APM Guide for tips on project setup, dashboard usage, and feature overviews.
Installing the correct agent(s) ensures that your application’s performance metrics, errors, and transaction traces are accurately collected, giving you deep insight from day one of your migration.
Once your projects are set up in Atatus, using the APM monitoring is straightforward:
- Navigate to the APM section in the Atatus dashboard.
- You will see a list of all active projects along with their names, types, and status.
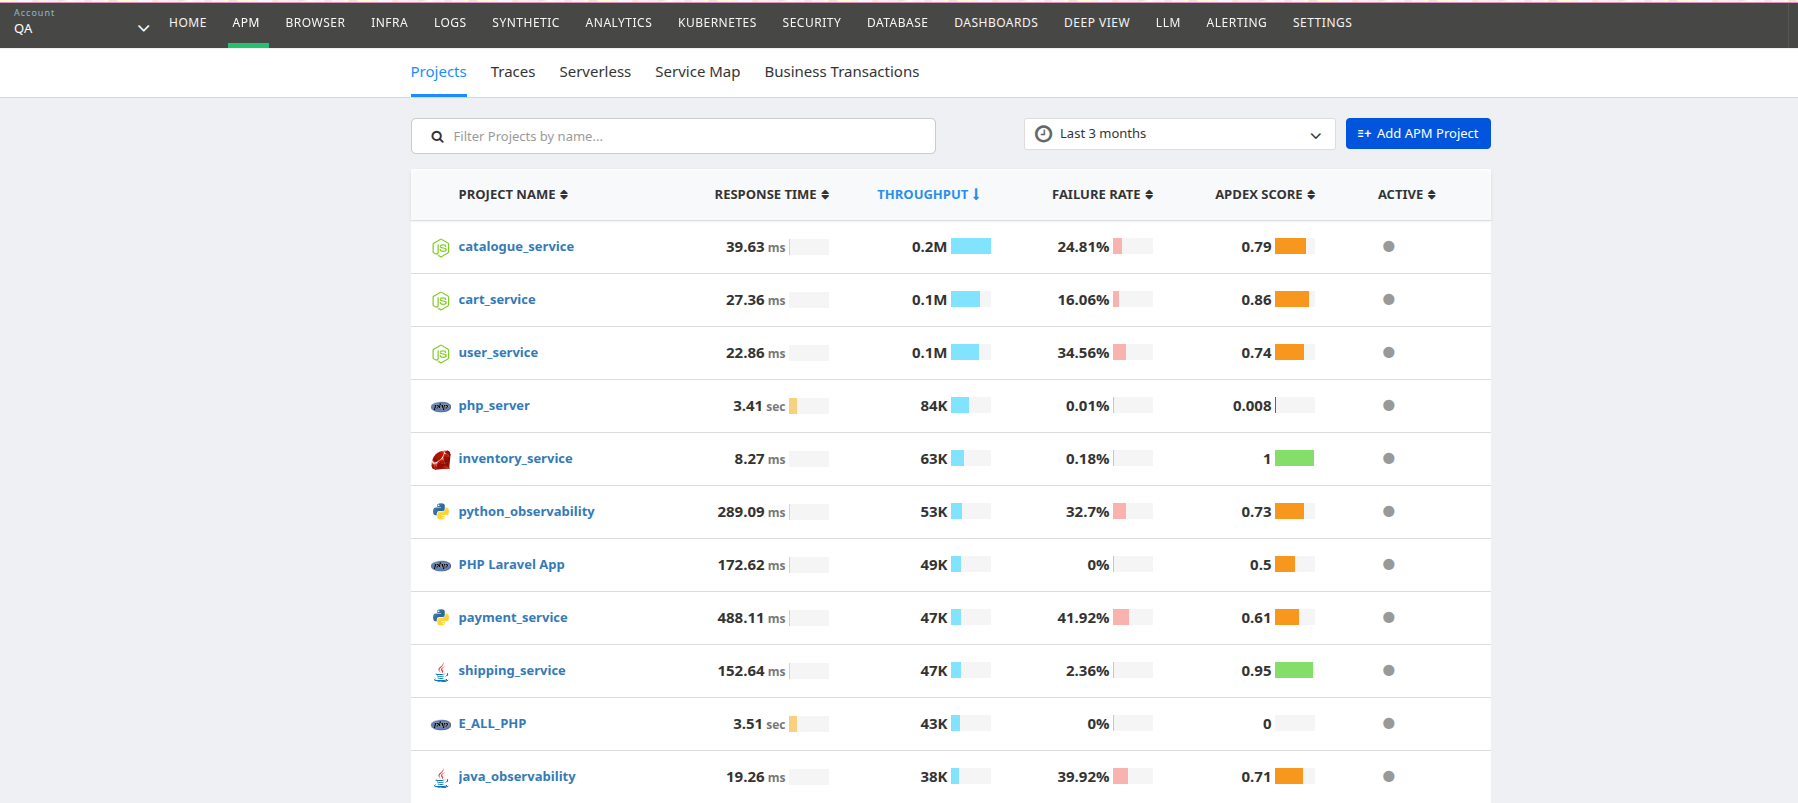
- Click on a project name to view detailed insights for that project.
- This detailed project page displays the project dashboard, including metrics on exceptions, databases, transactions, and more.
- To add a new project, use the New APM Project button on the APM page and follow the setup instructions.
This intuitive navigation lets you quickly access the performance data and start troubleshooting and optimising your applications immediately after migration.
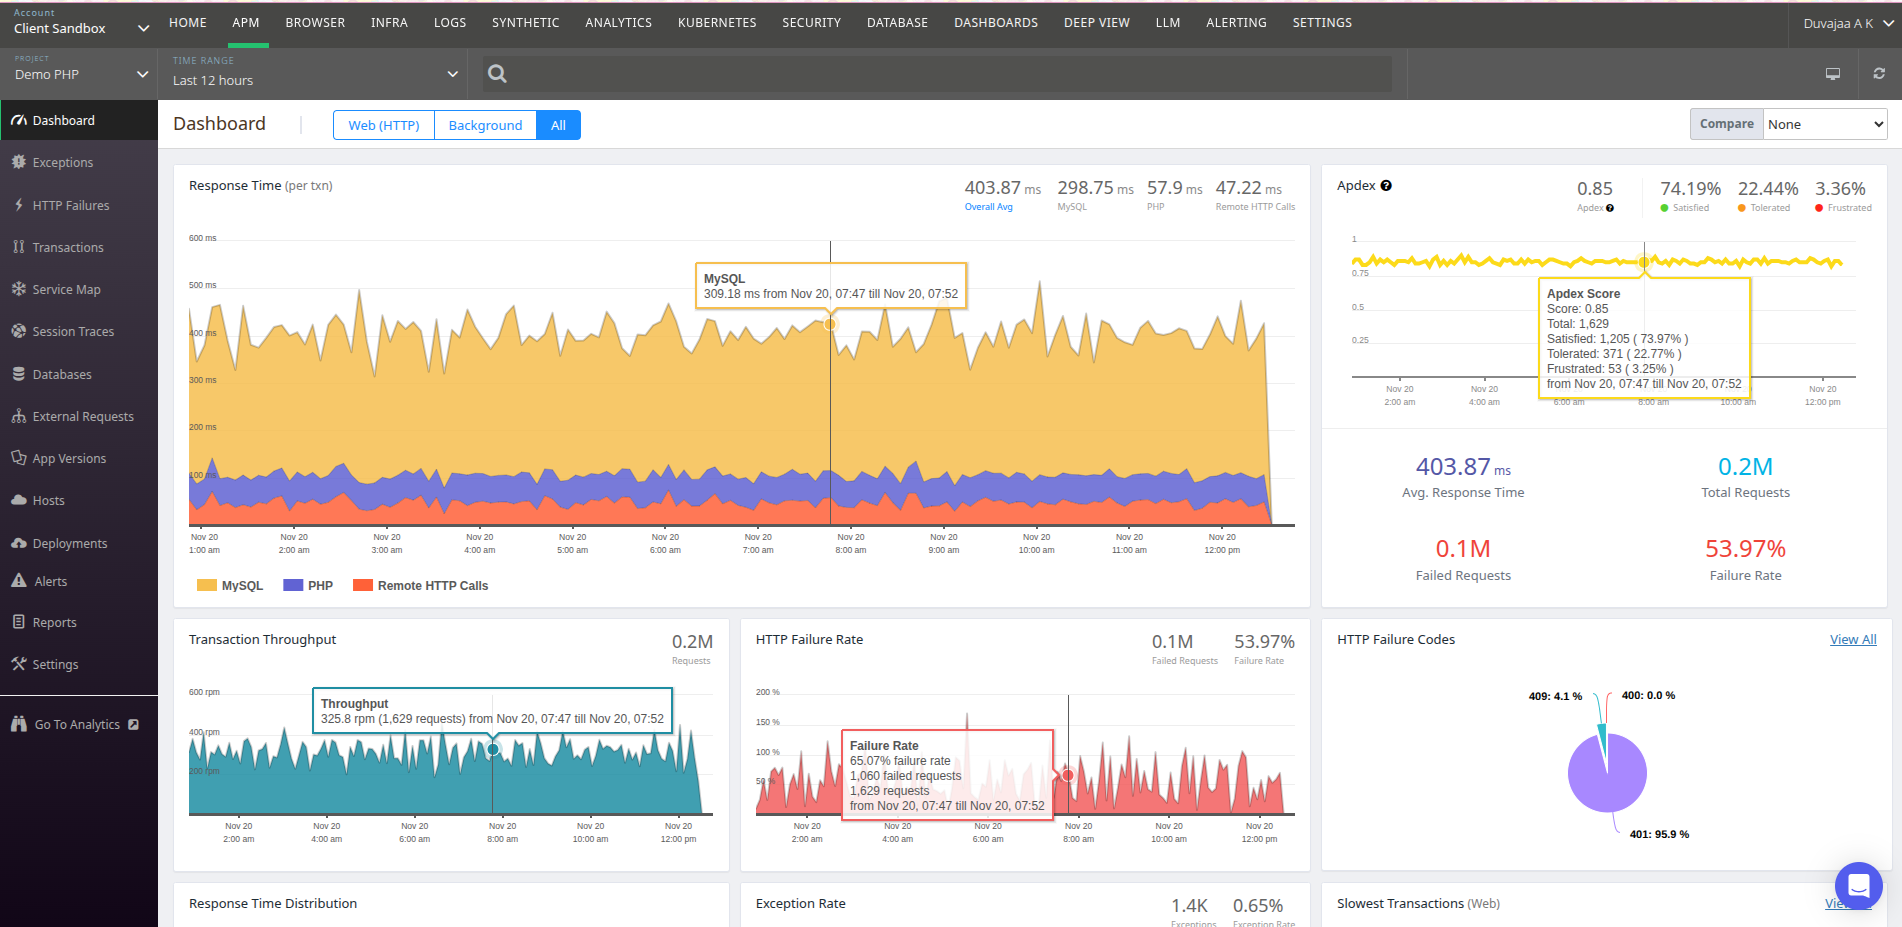
The Atatus dashboard offers a graphical overview of your application’s key performance indicators (KPIs) through intuitive visualisations and deep analytics. Each metric plays a crucial role in helping you understand your application’s health and performance.
Let’s take a closer look at the most important metrics you will encounter, what they represent, and how they can help you identify bottlenecks and improve user experience.
Key Metrics and Their Impact
- Application Response Time: Displays the average duration your servers take to complete transactions during a selected timeframe. This metric highlights backend latency issues so you can quickly identify if resource saturation or code inefficiencies are slowing your app. Understanding response time trends enables you to improve system responsiveness, reducing user frustration.
- Transaction Throughput: Illustrates the volume of requests processed per minute, helping you observe usage spikes or drops. Monitoring throughput informs your capacity planning and scaling strategies, ensuring your infrastructure can handle peak loads smoothly.
- HTTP Failure Rate & Error Codes: Visualizes the frequency and types of HTTP errors returned by your application. This aids rapid diagnosis by surfacing which endpoints experience frequent failures and their root causes, such as server errors (5xx) or client errors (4xx). Timely resolution reduces downtime and prevents customer-impacting problems.
- User Experience Scoring: Categorizes user interactions into satisfactory, tolerated, or frustrating performance bands, directly correlating system status to real user sentiment. With this insight, development teams can prioritise fixes that will raise overall customer satisfaction.
- Response Time Distribution: Breaks down all request latencies to find unusually slow or fast transactions. Pinpointing outliers supports preventive maintenance by revealing transient performance spikes that degrade UX but might otherwise be hidden in averages.
- Slowest Transactions: Identifies the most time-consuming operations requested from various geographic locations. Focusing optimisation efforts on these transactions yields maximum performance improvement and better experience for end users.
Also, explore our detailed guide on the Top 15 Application Performance Metrics every developer and SRE should monitor to ensure optimal performance and reliability.
How Atatus APM Dashboard Features Help Your Team
The Dashboard is not just a reporting tool, it supports multiple facets of your application lifecycle:
- Proactive Monitoring: Real-time visibility with alerts lets you spot and mitigate issues before users report them, reducing mean time to detect (MTTD) and mean time to repair (MTTR).
- Root Cause Analysis: Transaction monitoring breaks down every operation into segments, linking slowdowns or failures to specific functions, database queries, or external API calls, accelerating root cause identification and fix deployment.
- Error Resolution: Atatus groups errors by type and frequency, tracking exact lines of code and app versions where issues occur, helping your developers efficiently triage and resolve bugs.
- Performance Optimisation: Database monitoring highlights slow SQL queries and inefficient calls, enabling backend optimisation to improve overall responsiveness.
- Dependency Health: Monitoring of external requests identifies whether third-party or internal microservices contribute to latency or errors, allowing you to collaborate with external teams or re-architect dependencies.
- Collaborative Insights: Centralized dashboards facilitate communication between developers, operations, and business units, aligning metrics with business goals and customer satisfaction.
Don’t Just Take Our Word for It
While we have highlighted the key reasons businesses choose Atatus over other monitoring tools, don’t just blindly trust us, listen to what our customers are saying. For example, take a look at this detailed review.
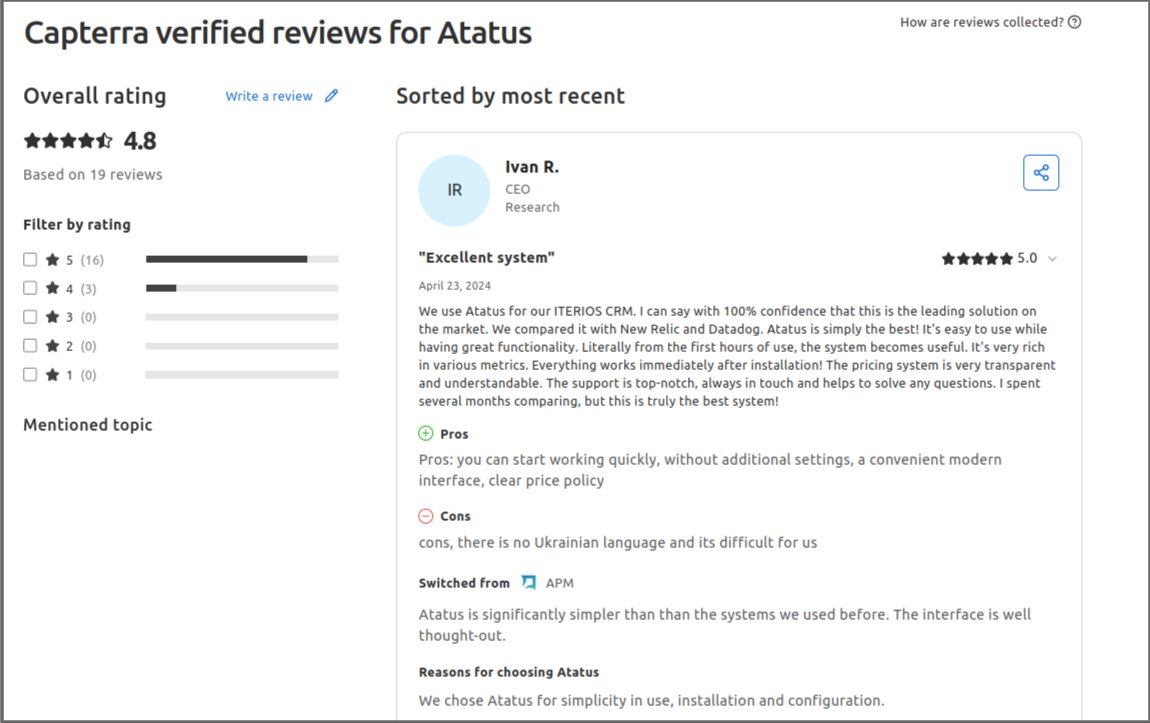
Want to see more? Explore all customer reviews to see what users are saying about their experience with Atatus: All Atatus Reviews on Capterra / All Atatus Reviews on G2
Best Practices Post-Migration with Atatus APM
Following these best practices helps you get clearer insights, fix issues faster, and keep performance steady over time:
- Establish performance baselines using initial data from Atatus dashboards to track improvements or regressions.
- Customize dashboards and alerts for critical transactions aligned with business priorities to reduce noise and focus on impactful issues.
- Use detailed transaction tracing and waterfall views to quickly identify bottlenecks in code, databases, and external services.
- Monitor dependencies like third-party APIs and microservices to proactively detect external slowdowns or failures.
- Enable log correlation to link APM data with logs for faster troubleshooting.
- Enable alerts for critical transactions to ensure timely notifications.
- Use tags for environment, version, and release ID to filter and analyze performance by deployment details.
- Set up SLA/SLO dashboards to monitor service level commitments and user experience.
- Incorporate regular reviews and reporting in team meetings to align stakeholders and drive continuous improvement.
- Train teams regularly on Atatus tools to ensure effective use.
These practices empower both engineering and SRE teams to maintain reliable application performance and rapidly resolve issues using Atatus.
Conclusion
Atatus is built for teams seeking monitoring without complexity. It offers a clean interface, quick setup, and real-time insights, enabling engineers to focus on improving performance rather than managing tools. Users consistently praise its comprehensive monitoring, actionable dashboards, and responsive support as key differentiators.
Customer Highlights:
- Transparent pricing with no hidden tiers
- Intuitive dashboards providing instant visibility
- Full historical data for trend analysis and error tracking
- Fast, human-centered support for immediate help
For teams looking for a simpler, more effective APM solution, Atatus delivers faster insights, unified monitoring, and easy setup for your applications and infrastructure.
💸 Switch to Atatus — Your Powerful APM Solution
Experience faster insights, unified monitoring, and a simpler setup tailored for your application needs.
Start Your Atatus Migration Journey Today#1 Solution for Logs, Traces & Metrics
![]() APM
APM
![]() Kubernetes
Kubernetes
![]() Logs
Logs
![]() Synthetics
Synthetics
![]() RUM
RUM
![]() Serverless
Serverless
![]() Security
Security
![]() More
More


![New Relic vs Splunk - In-depth Comparison [2026]](/blog/content/images/size/w960/2024/10/Datadog-vs-sentry--19-.png)