OpenTelemetry Collector - A Beginner's Guide
In the fast-pace world of technology, keeping an eye on how well our applications are doing is crucial.
Indeed, opentelemetry offers a comprehensive framework designed to capture the nuances of software applications. At the core of this framework lies the opentelemetry Collector, responsible for aggregating, processing, and exporting telemetry data.
Why is this important? Well, when you have big and complex computer systems the Collector helps gather all those, making a complete picture of what's happening. This way, if something goes wrong or if you want to make your programs better, you can look at the big picture and figure out what to do.
As organizations navigate the complexities of distributed systems, understanding the significance and capabilities of the opentelemetry Collector becomes paramount.
This introduction sets the stage for an exploration into how this critical component simplifies data collection, promotes standardization, and enhances the overall observability of applications.
Table of Contents
- What is Opentelemetry Collector?
- Significance of Opentelemetry Collector
- Components of Opentelemetry Collector
- How OTEL Collector Works?
- How Do You Set up an OpenTelemetry Collector?
- Instrumentation with Opentelemetry
What is Opentelemetry Collector?
Opentelemetry is a comprehensive observability framework that provides APIs and libraries to collect telemetry data (metrics, traces, logs) from software applications, offering insights into their performance.
The opentelemetry Collector is a critical component in the opentelemetry ecosystem, serving as a centralized mechanism for receiving, processing, and exporting telemetry data from instrumented applications. The collector is responsible for receiving, processing, and exporting telemetry data.
The collector is designed with performance in mind to minimize impact on application performance. Its extensibility allows for customization, making it a versatile solution for organizations seeking efficient and standardized telemetry data management in distributed systems.
Significance of Opentelemetry Collector
The opentelemetry Collector, transforms the landscape of observability in distributed systems. The Collector oversees the collection, processing, and export of telemetry data, ensuring uniformity and scalability across diverse applications. Now, what renders this collector indispensable?
Reasons to Use Opentelemetry Collector
- Promotes standardized instrumentation for consistent data gathering.
- Centralized hub for aggregating, processing, and filtering telemetry data.
- Supports various data formats and protocols, facilitating compatibility and migration.
- Streamlines analysis by aggregating telemetry data from different services.
- Centralized configuration simplifies management of data collection, processing, and export.
- Integrates seamlessly with diverse observability backends, supporting different solutions.
- Benefits from a vibrant community, regular updates, and integration with opentelemetry components.
- It gathers crucial host metrics such as RAM, CPU, and storage capacity, providing comprehensive insights into the performance and health of the underlying infrastructure.
Components of Opentelemetry Collector
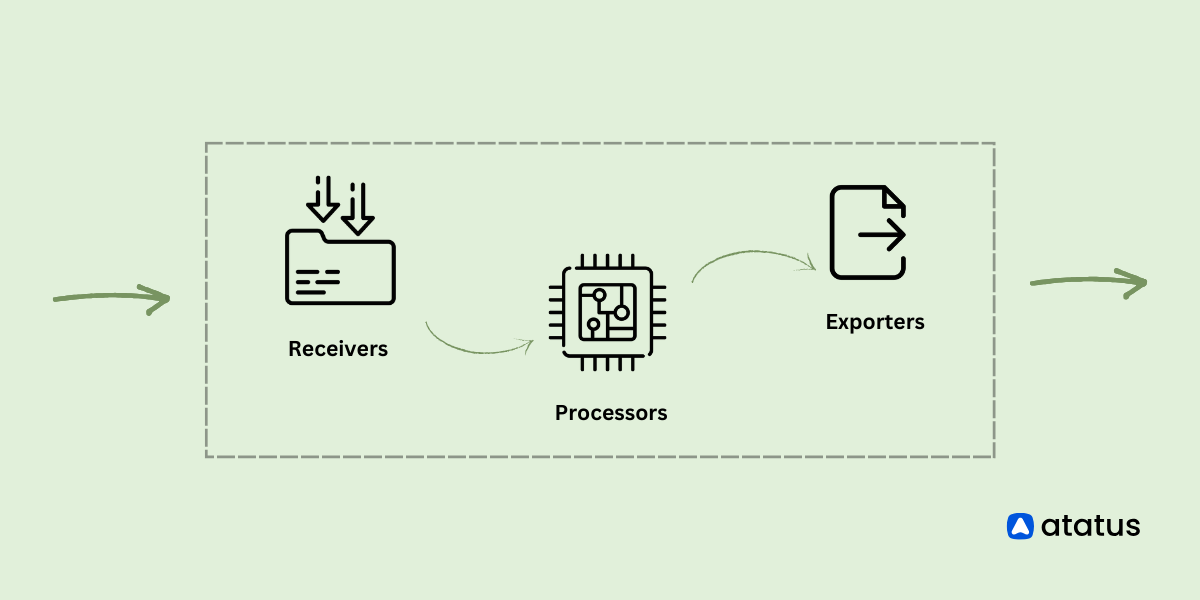
The opentelemetry Collector is modular and consists of various components that work together to facilitate the collection, processing, and export of telemetry data.
Here are some of the vital components of the OpenTelemetry Collector, each playing a crucial role in seamless collection, processing, and export of telemetry data in distributed systems.
1.) Receivers: Receivers are responsible for ingesting telemetry data from various sources and protocols. Examples: OTLP (opentelemetry Protocol), Jaeger, Zipkin, Prometheus, Fluent Bit, etc.
2.) Processors: Processors perform actions on the ingested telemetry data, such as filtering, sampling, or adding attributes. Examples: Batch processor, Attribute processor, Resource processor, etc.
3.) Exporters: Exporters send processed telemetry data to backend observability systems for further analysis and visualization. Examples: OTLP (opentelemetry Protocol), Jaeger, Zipkin, Prometheus, Elasticsearch, Splunk, etc.
4.) Extensions: Extensions are optional components that provide additional functionalities, such as adding custom instrumentation or integrating with specific services. Examples: Service extensions, authentication extensions, etc.
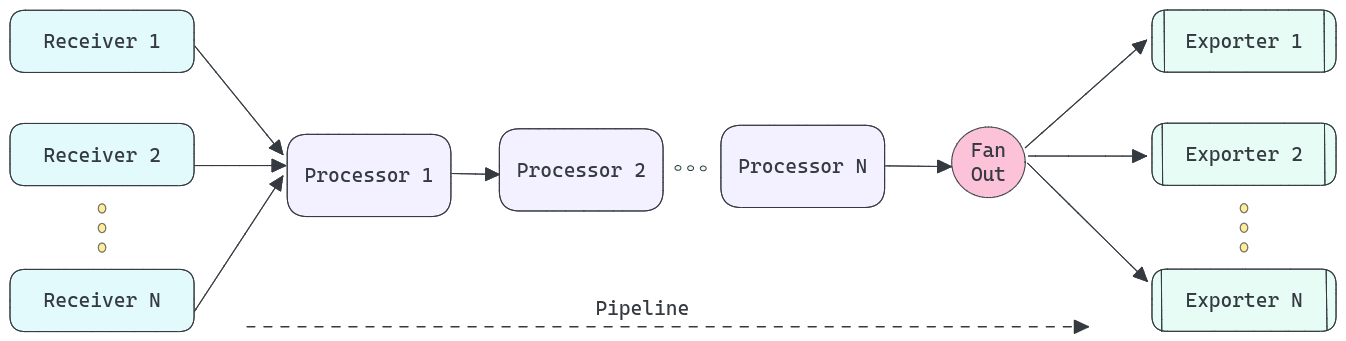
5.) Pipelines: Pipelines define the flow of telemetry data through the receiver, processor, and exporter components. Examples: Traces pipeline, Metrics pipeline, Logs pipeline, etc.
6.) Configuration: Configuration files or settings define how the opentelemetry Collector components are configured and interact with each other. Examples: YAML or JSON configuration files.
How OTEL Collector Works?
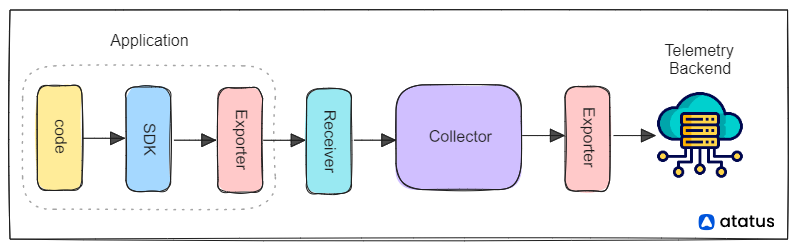
The collector acts as a unified entry point for telemetry data generated by various sources within a distributed application. These sources can include libraries, frameworks, or agents that instrument the code to generate data about the application's performance and behaviour. The collector ingests data in various formats and protocols, normalizing it into a standardized format.
Once the data is ingested, the collector performs processing tasks such as filtering, sampling, and enrichment. Filtering allows the system to focus on relevant data, while sampling helps manage the volume of data by selecting a representative subset. Enrichment involves adding additional contextual information to the data, making it more meaningful and useful for analysis.
After processing, the collector exports the data to backend systems responsible for storing and analysing telemetry information. This can include observability platforms, databases, or other tools that help visualize and interpret the data. The collector supports various export protocols, ensuring compatibility with different backend systems.
The exported data can be seamlessly integrated with observability tools such as tracing and monitoring systems. This integration allows developers and operators to gain insights into the performance, reliability, and overall health of the distributed system.
The opentelemetry Collector is highly extensible, allowing users to add custom processors, exporters, or other components to tailor its behaviour to specific needs. This flexibility makes it adaptable to a wide range of use cases and environments.
How Do You Set up an Opentelemetry Collector?
Configuring opentelemetry collectors involves specifying various settings and parameters to customize the behaviour of the collector. Before configuring the collector, you need to install it. You can find the latest release on the OpenTelemetry GitHub releases page.
Configuring the opentelemetry collector involves setting up three main components: receivers (to receive data), processors (to manipulate data), and exporters (to send data to a destination). Once configured, these components need to be enabled through pipelines within the service section.
The opentelemetry Collector uses a configuration file in YAML or JSON format. Create a configuration file (e.g., otel-collector-config.yaml), and specify the required parameters.
Receivers: In the configuration file, specify the receivers section. Receivers define how telemetry data is ingested. Common receivers include OTLP (opentelemetry Protocol) for gRPC-based communication, Jaeger, Zipkin, and more.
Here's an example:
receivers:
  otlp:
    protocols:
      grpc:{}
otlpserves as the identifier for the receiver.- Under
protocols, the supported communication protocols for the receiver are defined. - Specifically,
grpcis specified as the protocol, and the empty curly braces{}denote default configuration settings. - This configuration section can be expanded to incorporate additional receivers, like Jaeger or Zipkin, based on specific requirements.
Processors: Processors manipulate the data, allowing you to filter, transform, or enhance it. Specify the processors section in the configuration file. The example given below uses a simple batch processor.
processors:
  batch:
In this example, the batch processor is used, which batches multiple spans together. Processors can be customized further based on your requirements.
Exporters: Exporters define where the processed data should be sent. The example uses the OTLP exporter, which can be configured to send data to another collector or backend.
exporters:
  otlp:
    endpoint:
In this example:
otlpis the exporter name.endpointspecifies the address and port where the exporter should send data.
Instrumentation with Opentelemetry
Instrumentation in opentelemetry involves embedding code into your applications to generate telemetry data, including metrics, traces, and logs. This process enables comprehensive insights into your software's performance and behaviour within a distributed system.
Choose the appropriate opentelemetry instrumentation library for your programming language, integrate it into your application, and utilize its APIs to capture traces, metrics, and logs.
Ensure proper context propagation for correlation across components, and configure the library based on your needs. opentelemetry supports custom instrumentation, allowing you to capture domain-specific metrics.
Additionally, integrate with frameworks and libraries that offer built-in or plugin-based instrumentation. Thorough testing and validation ensure accurate telemetry data collection without significant performance impact, laying the foundation for effective observability.
Wrap Up
Setting up the opentelemetry Collector is a crucial step towards gaining comprehensive observability in distributed systems. Here's a quick wrap-up of key points for beginners,
- Installation: Start by installing the opentelemetry Collector from the official GitHub releases page.
- Configuration File: Create a configuration file in YAML or JSON format (e.g., otel-collector-config.yaml).
- Receivers: Specify receivers in the configuration file to define how telemetry data is ingested. Common options include OTLP (OpenTelemetry Protocol), Jaeger, Zipkin, etc.
- Processors: Use processors to manipulate data, such as filtering, transforming, or batching. Customize processors based on specific requirements.
- Exporters: Define exporters to specify where the processed data should be sent. OTLP exporter is a common choice, configurable with an endpoint specifying the destination address.
- Pipelines: Enable and configure pipelines within the service section to orchestrate the flow of telemetry data through receivers, processors, and exporters.
- Flexibility: Leverage the extensibility of the opentelemetry Collector by adding custom processors, exporters, or other components to tailor its behaviour to your specific needs.
Remember, the opentelemetry Collector acts as a unified entry point, ensuring standardized, centralized, and scalable management of telemetry data. With this setup, you'll be gaining valuable insights into the performance and health of your distributed applications.
Monitor Your Entire Application with Atatus
Atatus is a Full Stack Observability Platform that lets you review problems as if they happened in your application. Instead of guessing why errors happen or asking users for screenshots and log dumps, Atatus lets you replay the session to quickly understand what went wrong.
We offer Application Performance Monitoring, Real User Monitoring, Server Monitoring, Logs Monitoring, Synthetic Monitoring, Uptime Monitoring and API Analytics. It works perfectly with any application, regardless of framework, and has plugins.

Atatus can be beneficial to your business, which provides a comprehensive view of your application, including how it works, where performance bottlenecks exist, which users are most impacted, and which errors break your code for your frontend, backend, and infrastructure.
If you are not yet a Atatus customer, you can sign up for a 14-day free trial .
#1 Solution for Logs, Traces & Metrics
![]() APM
APM
![]() Kubernetes
Kubernetes
![]() Logs
Logs
![]() Synthetics
Synthetics
![]() RUM
RUM
![]() Serverless
Serverless
![]() Security
Security
![]() More
More