Diving into Observability Platform: OpenTelemetry vs Datadog
Imagine you're leading a team of engineers responsible for monitoring and optimizing the performance of a cloud-based application used by millions of users worldwide. As the application continues to scale, you recognize the pressing need for a robust observability solution to learn about its distributed architecture.
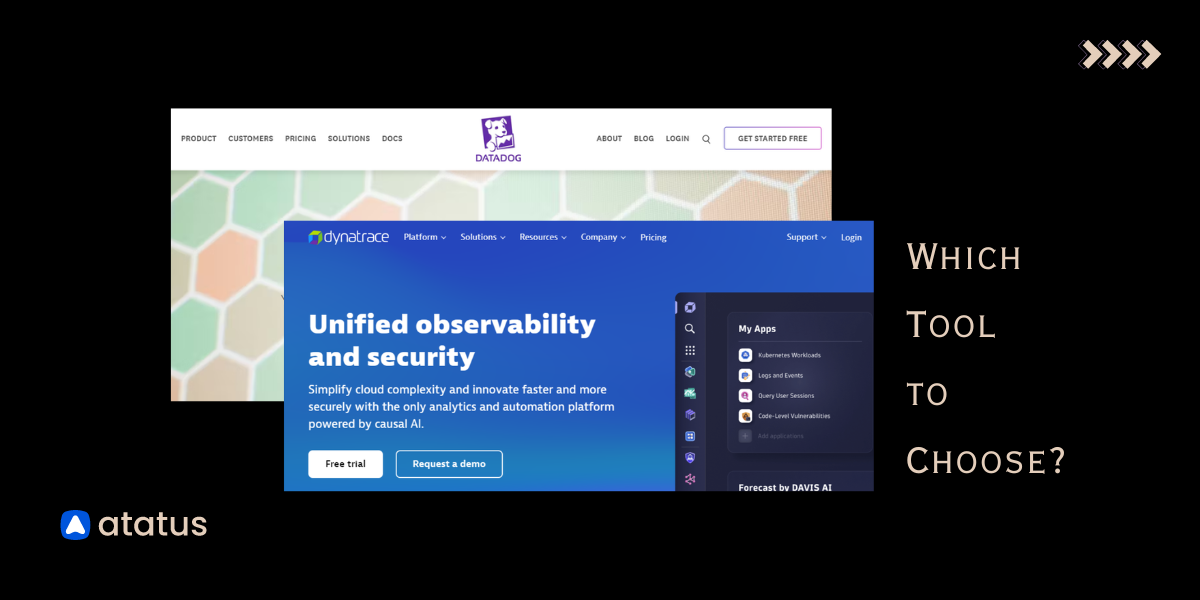
In this scenario, you're faced with an essential decision: choosing between OpenTelemetry and Datadog for distributed tracing and observability.
Two outstanding solutions addressing distributed tracing and observability challenges are OpenTelemetry and Datadog. OpenTelemetry is an open-source project designed to standardize and simplify the instrumentation, collection, and export of telemetry data for cloud-native applications. Datadog, a cloud-based monitoring and analytics platform, offers many features for monitoring applications and infrastructure and logs in real-time.
In this blog, we will gain information on the comparison between OpenTelemetry and Datadog, exploring their respective features, capabilities, use cases, and considerations for adoption. By navigating the choice between these two solutions, you can make decisions to meet your monitoring and observability needs in the dynamic landscape of distributed systems.
OpenTelemetry
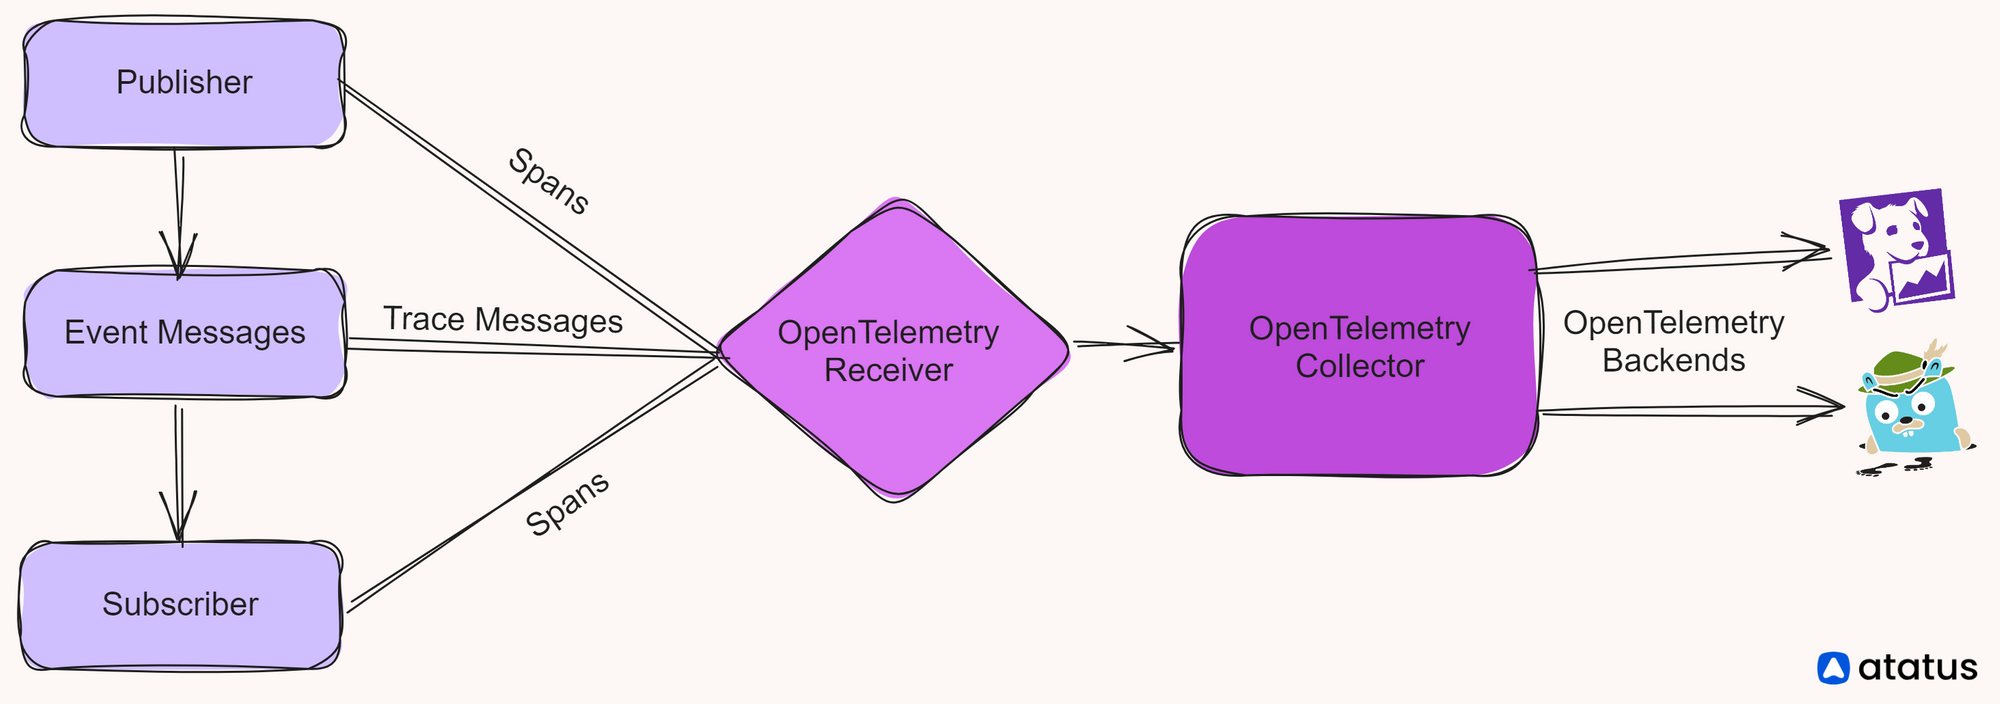
OpenTelemetry is a collection of tools, APIs, and SDKs for collecting and generating data. It is a vendor-neutral, community-driven initiative that improves observability in distributed systems. It offers developers a standardized way to instrument their applications, capturing telemetry data related to request flows, resource utilization, and performance metrics.
Features and Capabilities:
A set of features and capabilities are designed to provide complete observability within complex distributed architectures.
-
Distributed Tracing: OpenTelemetry supports distributed tracing, allowing you to trace the requests across multiple services and components. It captures contextual information, such as trace and span IDs, to support correlating and analyzing distributed traces.
-
Metrics Collection: With OpenTelemetry, you can instrument your applications to capture performance metrics, resource utilization, and other key system health indicators. This enables active monitoring and alerting based on predefined thresholds and SLAs.
-
Instrumentation: OpenTelemetry offers a unified instrumentation approach, providing libraries and SDKs for popular programming languages and frameworks. This simplifies the process of instrumenting applications, providing consistency and interoperability across diverse environments.
-
Plug-and-Play Integrations: OpenTelemetry supports integration with various observability tools and platforms, including tracing backends like Jaeger and Zipkin, metric backends like Prometheus and Grafana, and logging solutions like Fluentd and Elasticsearch.
Datadog
The Datadog platform provides complete observability solutions for cloud-native environments. Datadog has emerged as a leading provider of monitoring, security, and analytics tools, catering to the needs of organizations across various industries.
As a result of Datadog's real-time insights, teams are enabled to detect and resolve problems actively.
Features and Capabilities
Datadog offers a variety of features and capabilities designed to simplify observability and support effective monitoring:
-
Monitoring: Datadog provides a platform for monitoring the health and performance, infrastructure, and networks. Users can collect and visualize metrics, traces, and logs in a single, integrated dashboard, facilitating correlation and analysis across data sources. It also offers security monitoring capabilities, allowing users to detect security threats in real time.
-
Real-Time Metrics: Datadog enables users to collect, visualize, and analyze real-time metrics from various sources, including servers, containers, databases, and cloud services. With support for over 400 integrations, Datadog offers out-of-the-box integrations with popular technologies, allowing users to monitor their entire stack easily.
-
Distributed Tracing: Datadog offers distributed tracing capabilities, allowing users to trace requests as they traverse through distributed systems and microservices. By visualizing request flows and identifying performance delays, you can optimize the performance of their applications.
-
Log Management: Datadog's log management solution enables users to collect, centralize, and analyze logs across their infrastructure and applications. With support for structured and unstructured logs, users can gain a valuable understanding of system behavior, troubleshoot issues, and meet compliance requirements.
-
AIOps and Machine Learning: Datadog influences machine learning algorithms to detect anomalies, outliers, and patterns in telemetry data automatically. By applying AIOps techniques, Datadog helps users identify and prioritize issues, reducing mean time to resolution and improving overall system reliability.
Comparing OpenTelemetry and Datadog
When evaluating observability solutions like OpenTelemetry and Datadog, it's essential to consider various factors, including performance metrics, ease of integration, cost considerations, scalability, and flexibility. Let's compare these aspects of both platforms:
1. Performance Metrics
- OpenTelemetry: OpenTelemetry supports capturing performance metrics from distributed systems and microservices. With its distributed tracing capabilities, OpenTelemetry allows users to trace request flows and measure latency, throughput, and error rates across various components of their applications.
- Datadog: Datadog offers real-time monitoring and analytics capabilities for collecting and visualizing performance metrics from diverse sources. Users can monitor CPU usage, memory utilization, network traffic, and other key performance indicators to learn about the health and performance of their infrastructure and applications.
2. Ease of Integration
- OpenTelemetry: OpenTelemetry offers an instrumentation approach, providing libraries and SDKs for popular programming languages and frameworks. Developers can easily integrate OpenTelemetry into their applications and leverage built-in instrumentation for capturing traces, metrics, and logs.
- Datadog: Datadog provides out-of-the-box integrations with over 400 technologies, including cloud platforms, containers, databases, and more. Users can quickly deploy Datadog agents and integrations to collect telemetry data from their entire stack without extensive manual configuration.
3. Cost Considerations
- OpenTelemetry: As an open-source project, OpenTelemetry is free to use and does not receive direct licensing costs. However, organizations should consider the operational costs of managing and maintaining an OpenTelemetry deployment, including infrastructure resources, ongoing support, and customization efforts.
- Datadog: Datadog operates on a subscription-based pricing model, with costs based on the volume of data ingested, retention period, and additional features. While Datadog offers a complete observability platform, organizations should evaluate the total cost of ownership and align it with their budgetary constraints.
4. Scalability and Flexibility
- OpenTelemetry: OpenTelemetry offers scalability and flexibility, allowing organizations to customize their observability stack to their specific requirements. With its open-source nature and community-driven development model, OpenTelemetry provides flexibility in terms of customization, integration, and extensibility.
- Datadog: Datadog is designed to scale with the needs of modern, cloud-native environments, offering support for dynamic infrastructure, auto-scaling, and multi-cloud deployments. Users can utilize Datadog's platform-as-a-service offering for scalability and flexibility in managing their observability infrastructure.
An overview of the key differences between OpenTelemetry and Datadog:
| Aspect | OpenTelemetry | Datadog |
|---|---|---|
| Performance Metrics | Captures distributed tracing for latency, throughput, and error rates. | Monitors CPU, memory, network traffic, and more. |
| Ease of Integration | Combined instrumentation approach with libraries and SDKs. | Out-of-the-box integrations for over 400 technologies. |
| Cost Considerations | Open-source with no direct licensing costs but adds operational costs | Subscription-based pricing model. |
| Scalability/Flexibility | Flexible and scalable, customizable with an open-source nature. | Scales with dynamic infrastructure and multi-cloud deployments. |
Choosing the Right Tool
While selecting between OpenTelemetry and Datadog for observability needs, it's important to consider several factors to make sure the chosen solution aligns with your organization's requirements and goals.
a) Factors to Consider:
-
Feature Set: Evaluate the features and capabilities offered by each platform and determine which aligns best with your monitoring, tracing, and logging needs.
-
Ease of Integration: Consider integrating the solution into your infrastructure and applications. Look for compatibility with your tech stack and ease of deployment.
-
Cost: Assess the total cost of ownership, including licensing fees, infrastructure costs, and any additional expenses associated with customization, maintenance, and support.
-
Scalability: Determine the solution's scalability to accommodate your current workload and future growth projections. Consider factors such as data volume, infrastructure scaling, and support for dynamic environments.
-
Flexibility and Customization: Evaluate each platform's flexibility and customization options. Consider whether the solution can be adapted to meet your specific requirements and integrate with other tools and services.
-
Community and Support: Consider the strength of the community and the level of support provided by the platform's developers. Look for active community engagement, documentation, and available support resources.
b) Use Case Analysis:
-
Conduct a thorough analysis of your organization's use cases and requirements for observability. Identify the specific metrics, traces, and logs you need to monitor and any unique use cases or workflows that may require specialized features or capabilities.
-
Consider factors such as the complexity of your infrastructure, the scale of your operations, and the criticality of observability for your business objectives. Customize your evaluation criteria to align with your use case analysis and prioritize features accordingly.
c) Scalability and Future Growth:
-
When choosing an observability solution, predict your organization's future growth and scalability requirements. Consider factors such as projected data volume, expansion into new markets or services, and changes in infrastructure architecture.
-
Measure whether the chosen solution can scale to accommodate increased workload and data volume without compromising performance or reliability. Look for features such as auto-scaling, dynamic resource allocation, and support for distributed architectures to provide scalability and future-proofing.
-
By carefully considering these factors, conducting use case analysis, and assessing scalability and future growth potential, you can choose between OpenTelemetry and Datadog for your observability needs.
Conclusion
Success in any attempt requires careful planning, thoughtful consideration, and the courage to make informed decisions. When choosing between OpenTelemetry and Datadog for observability in distributed systems, remember:
The more you know about the past, the better prepared you are for the future. - Theodore Roosevelt.
While both solutions offer active features and capabilities, it's important to acknowledge potential drawbacks. OpenTelemetry, being an open-source solution, may require additional resources for maintenance and support. While Datadog provides complete out-of-the-box integrations, it comes with a subscription-based pricing model that may pose cost challenges for some organizations.
By carefully evaluating the options and understanding past performance, you can confidently choose the solution that aligns with their goals and ensure success in monitoring and optimizing your distributed architectures.
Atatus API Monitoring and Observability
Atatus provides Powerful API Observability to help you debug and prevent API issues. It monitors the consumer experience and is notified when abnormalities or issues arise. You can deeply understand who is using your APIs, how they are used, and the payloads they are sending.
Atatus's user-centric API observability tracks how your actual customers experience your APIs and applications. Customers may easily get metrics on their quota usage, SLAs, and more.
It monitors the functionality, availability, and performance data of your internal, external, and third-party APIs to see how your actual users interact with the API in your application. It also validates rest APIs and keeps track of metrics like latency, response time, and other performance indicators to ensure your application runs smoothly.
#1 Solution for Logs, Traces & Metrics
![]() APM
APM
![]() Kubernetes
Kubernetes
![]() Logs
Logs
![]() Synthetics
Synthetics
![]() RUM
RUM
![]() Serverless
Serverless
![]() Security
Security
![]() More
More