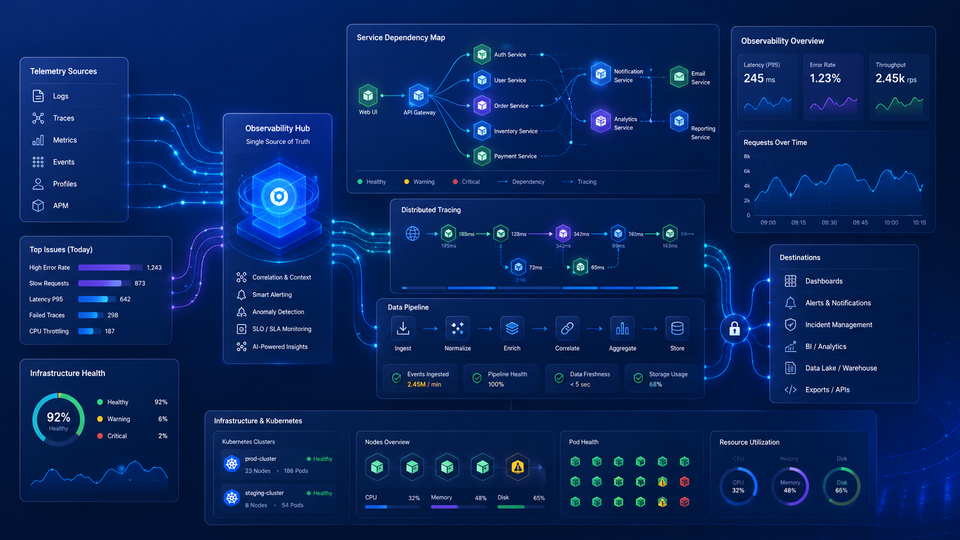
Observability means understanding why systems break, not just that they did. This guide covers logs, metrics, traces, OpenTelemetry, Kubernetes, and how to pick the right platform.
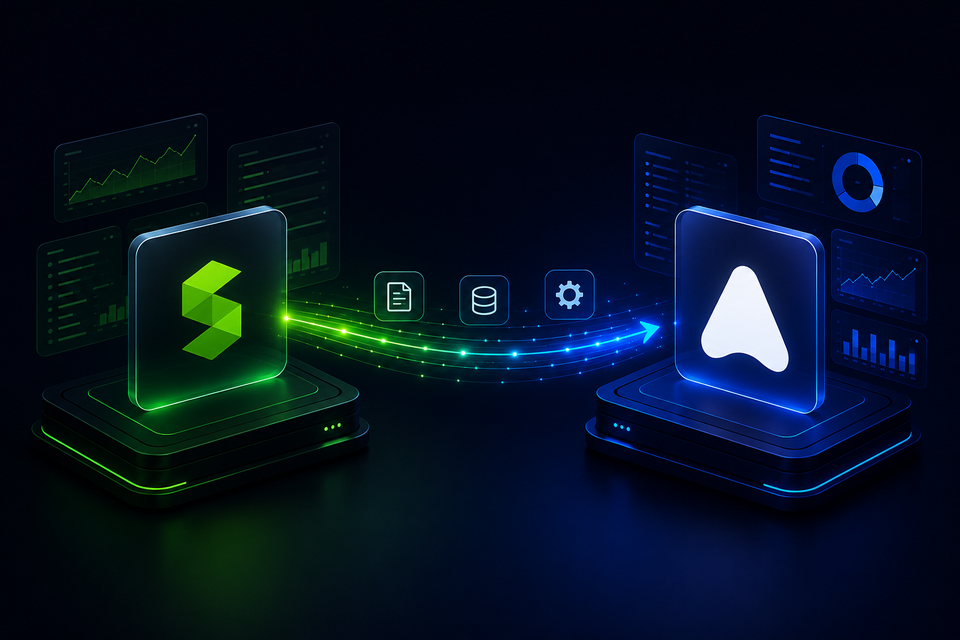
Stackify Retrace is entering End of Life. This guide walks engineering teams through inventory, agent setup, parallel validation, and cutover everything you need to migrate to Atatus with zero monitoring gaps.
Choosing the right APM software is crucial for developers and DevOps teams. Explore five key factors and see why Atatus is the top choice for modern, scalable performance monitoring.
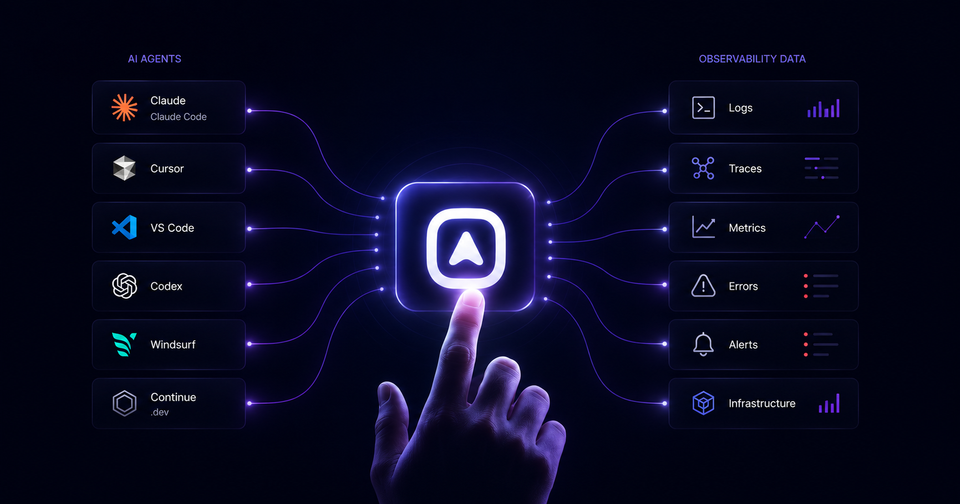
Atatus MCP Server bridges AI coding assistants like Claude and Cursor with your production observability data, letting agents query logs, traces, and metrics without leaving your editor.
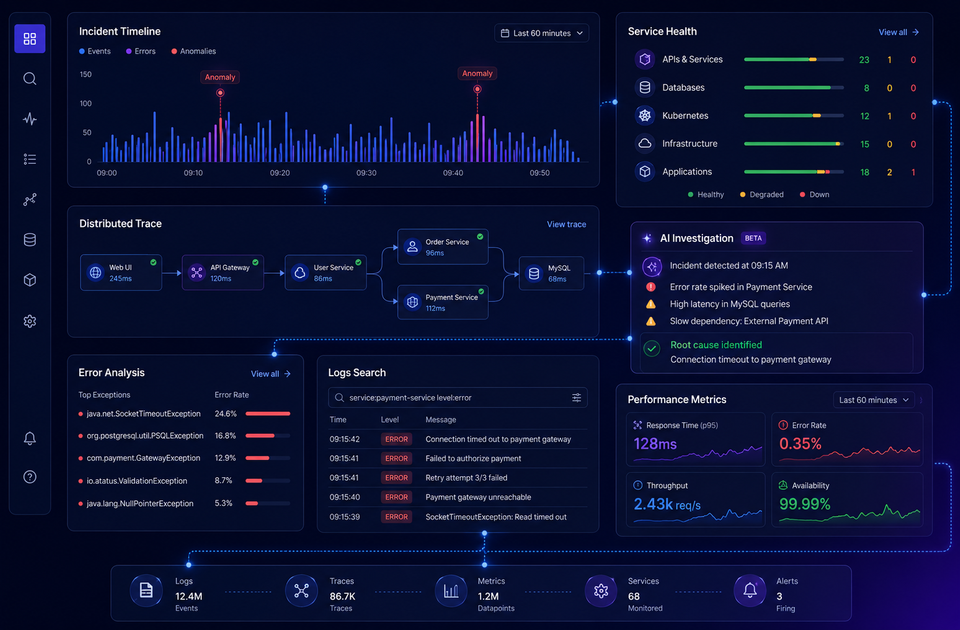
Stop losing hours to manual log searches. See how AI observability cuts MTTR by 60%, surfaces root causes in minutes, and keeps your production systems healthy.
PHP-FPM slowing down under traffic? Get the exact tuning formulas for pm.max_children, the right process manager mode for your load, and how to monitor it continuously with Atatus.
Platform engineers can't scale when they're the first call for every incident. Learn how observability helps developers debug independently, reduces MTTR, improves onboarding, and supports SLO-driven reliability.
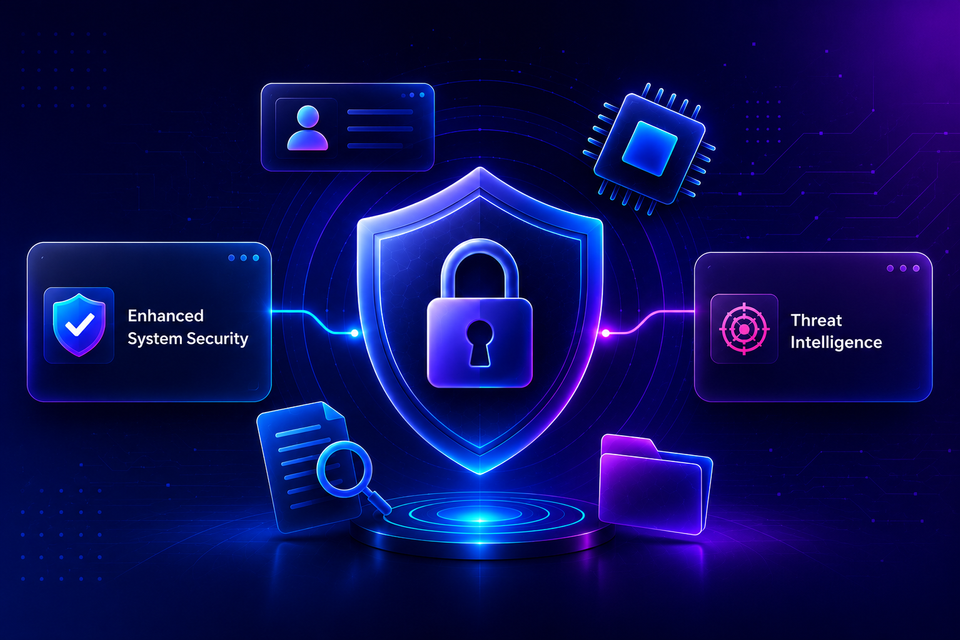
Your SIEM catches the threat. Then someone loses ten minutes switching tools to find the trace behind it. See how 7 observability platforms close that gap, compared on pricing, features, and fit.
Track every transaction, trace bottlenecks, and monitor infrastructure health with Atatus observability. Boost application performance and speed up troubleshooting. Start free now.
Monitor your entire software stack
Gain end-to-end visibility of every business transaction and see how each layer of your software stack affects your customer experience.