Top ELK Stack Alternatives in 2026
In a typical scenario, the software you create is usually hosted on a single server, which generates a lot of log messages for your application. However, things have changed a little bit now.
In today's world, there are no longer single servers. Instead, there are likely to be tens or even hundreds of virtual machines running behind a load balancer, and each one generates thousands of log messages every day.
The question is,
- Are we going to sift through all these logs manually? If not, what are the filtering criteria and how can we do it?
- With several VMs, how do we identify which of these servers processed the request that resulted in an error?
This is where ELK Stack plays its role.
| Feature | ELK Stack | Atatus |
|---|---|---|
| Setup Complexity | ❌ High — 3 separate products to configure | ✅ Minutes — agent-based, zero cluster setup |
| Infrastructure Management | ❌ Self-managed clusters, shards, replicas | ✅ Fully managed SaaS — zero ops overhead |
| Log Storage | ⚠️ Self-provisioned, costs scale sharply | ✅ Managed, predictable ingestion pricing |
| Maintenance Effort | ❌ Ongoing — upgrades, JVM heap, sharding | ✅ None — Atatus handles all infrastructure |
| Alerting | ⚠️ Watcher / X-Pack (paid add-on) | ✅ Built-in anomaly detection & custom alerts |
| Distributed Tracing | ❌ Requires separate APM server integration | ✅ Native end-to-end distributed tracing |
| APM | ⚠️ Elastic APM — separate product, extra config | ✅ Full APM with auto-instrumentation included |
| Cost Predictability | ❌ Unpredictable — infra can reach $495K/mo | ✅ Transparent ingestion-based pricing |
| Time to Value | ❌ Days to weeks of configuration | ✅ Start sending logs in minutes |
| Team Productivity | ❌ Engineering hours lost to cluster ops | ✅ Teams focus on product, not infra |
Looking for an ELK Alternative Without Operational Overhead?
Atatus gives engineering teams full observability including logs, APM, tracing, RUM without a single Elasticsearch cluster to manage. Try it free, no credit card required.
Table Of Contents:-
- The ELK Stack: Elasticsearch, Logstash, and Kibana
- What are the issues with using ELK Stack?
- Why Teams Leave ELK Stack?
- Top ELK Stack Alternatives
- Migrating from ELK Stack to Atatus
- How to choose the best Log Analytics tool?
The ELK Stack: Elasticsearch, Logstash, and Kibana
The ELK stack comprises three open-source projects: Elasticsearch, Logstash, and Kibana. They’ve been staples in log management, analytics, and visualization. Here’s a brief overview of how they usually work.
Logstash is a tool that splits log messages into individual events, organizes them by timestamp, and stores them in a centralized location. After some preprocessing, these messages are sent to elastic clusters, where they are indexed and stored as documents. Kibana is responsible for visualizing the entire stack, allowing users to query messages and create dashboards.
Imagine you're running a Java app named myJavaApp, and you need to quickly pinpoint any exceptions that have occurred in the last 15 minutes. With Kibana, it's as simple as firing up a query like this one below:
product:myJavaApp AND msg:’Exception’This will quickly fetch all the documents indexed using the keyword 'Exception.'
While ELK is open-source and free to use, storing data especially when it comes to partitioned data across distributed architecture, the costs can go up to $495K for 30 days of 1000Gb ingest per day.
We will take a look at some of the common issues faced by ELK users.
What are the issues with using ELK Stack?
ELK is one of the best tools for log management, but it has its own drawbacks as well. Let’s take a look at some of these:
- Complex Management: ELK Stack setup involves many steps like configuring logs, building pipelines, and monitoring exceptions. This will demands skilled personnel and can add to training costs additionally, apart from those incurred for buying the solution.
- High Total Cost: Although ELK software is free, setting it up requires resources - like infrastructure and training. Ongoing costs like these, including data retention and infrastructure, can make ownership more expensive than expected.
- Data Retention Challenges: With more data, users will have to balance retention and costs. Features like sharding and replicas improve performance but need more resources, forcing users to choose between data retention and higher costs.
- Stability Concerns: As data grows, stability and uptime issues can arise. Exceeding storage limits in Elasticsearch indices can lead to data loss or system crashes.
- KQL Complexity: KQL (Kibana Query Language), while effective, may be challenging for new users due to its syntax and query structure. This could affect the efficiency and ease of log data analysis for those unfamiliar with it.
Why Teams Leave ELK Stack?
#1 Pain Point - Elasticsearch Cluster Management Consumes Valuable Engineering Time
Running ELK Stack in production means your team becomes responsible for managing Elasticsearch clusters: provisioning nodes, configuring shards and replicas, tuning JVM heap sizes, handling rolling upgrades, and responding to cluster health alerts. This is highly specialized work that sits entirely outside your product roadmap.
Business Impact: Engineering teams at mid-size companies report spending 5–15 hours per week on Elasticsearch maintenance alone, time that compounds into weeks of lost product development each quarter.
How Atatus Addresses It: Atatus is a fully managed SaaS observability platform. There are no clusters to provision, no shards to tune, and no infrastructure upgrades to schedule. Install an agent and start sending logs where the platform handles everything else.
#2 Pain Point - Log Infrastructure Costs Grow Faster Than Expected at Scale
ELK Stack is open-source, but running it at scale is not free. As data volumes grow, especially in distributed architectures with dozens of microservices and infrastructure costs compound quickly. Storing 1,000 GB of logs per day can cost upward of $495,000 per month. Advanced security, alerting, and ML features require X-Pack licenses on top of that.
Business Impact: Organizations routinely find that their "free" ELK deployment costs more in cloud infrastructure and engineering labor than a managed observability solution would have often by a factor of 2–3×.
How Atatus Addresses It: Atatus uses ingestion-based pricing that scales predictably with your data volume. There are no surprise infrastructure bills, no licensing add-ons, and no per-seat charges that escalate as your team grows.
#3 Pain Point - Modern Teams Need Logs, Traces, Metrics, and RUM in One Platform
ELK Stack was designed primarily as a log aggregation and search tool. When teams need distributed tracing, APM, infrastructure metrics, and real-user monitoring, they end up stitching together Elastic APM, Kibana, and third-party tools, creating a fragmented observability stack with multiple data silos and duplicated alerting.
Business Impact: Fragmented tooling increases MTTR, because engineers must correlate data across multiple interfaces during an incident. Context-switching between log, trace, and metric tools adds minutes to every investigation.
How Atatus Addresses It: Atatus is a unified observability platform combining log management, APM, distributed tracing, infrastructure monitoring, real user monitoring (RUM), and synthetic monitoring in a single interface. One agent. One unified view of your entire stack.
Top ELK Stack Alternatives Include:-
- Atatus
- Splunk
- Loggly
- Graylog
- Dynatrace
- New Relic
- Sumo Logic
- Logz.io
- Mezmo (previously LogDNA)
- Apache Kafka+Flink
- Grafana+Prometheus+Loki
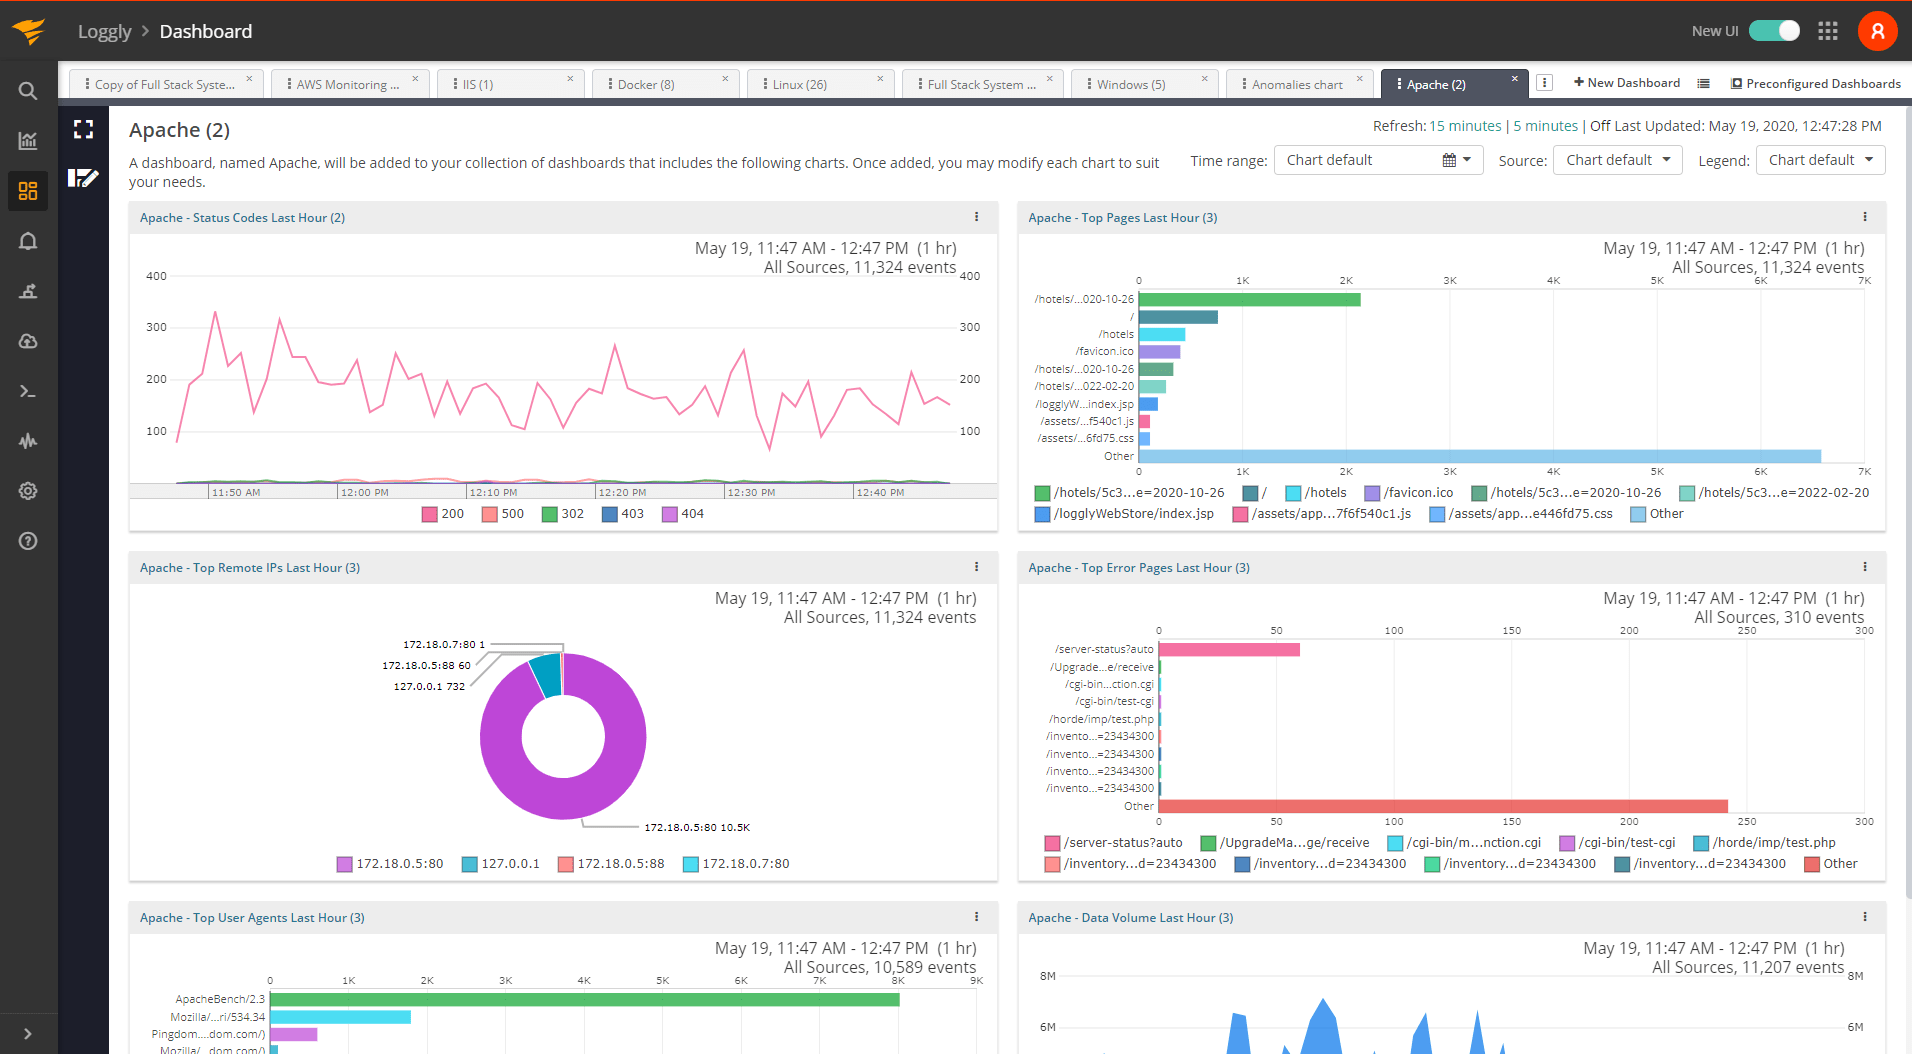
1. Atatus
Atatus is a full-stack monitoring and observability platform. As part of its product line, it hosts an incredible Logs Monitoring solution. With its easy-to-set-up and intuitive interface, they capture every minute metrics of your application platform.
The Atatus Logs Monitoring Platform is a standalone product designed for comprehensive centralized logging and real-time log analysis, featuring live trails and APM integration. It supports controlled logging and collects log data from applications deployed across more than twelve different platforms.
Atatus excels in enabling real-time log analysis, monitoring logs, and sending alerts as needed. With its centralized log data storage, users can easily search through logs and create customizable dashboards to visualize data according to their needs. It supports multiple languages and platforms, including Ruby, Java, Python, PHP, Apache HTTP Server, and many others, ensuring thorough log analysis across diverse environments. This makes Atatus an invaluable tool for effectively managing and analyzing any text-based logs.
Atatus Logs Monitoring includes:
- Log Explorer - Provides comprehensive visibility into the source, hostname, services, tags, and messages of your programs.
- Log Parser - Converts raw log data into structured formats and makes it easier to analyze, filter and interpret.
- Live Tail - Enables you to monitor log events in real-time across your infrastructure, empowering you to identify and address performance issues swiftly.
- Log Analytics - You can organize and analyze log event counts according to alert rules and policies, leveraging filter options and insights.
- Integrations - Atatus seamlessly incorporates log events into designated modules such as MySQL, MongoDB, PostgreSQL, NGINX, and more.
Advantages of using Atatus Over ELK Stack:
Atatus is a comprehensive observability platform that combines monitoring, tracing, and error reporting in one place, eliminating the need for separate tools for visualization. With Atatus, you get the following advantages:
- Easy installation and setup, minimizing configuration requirements.
- Real-time monitoring for swift issue identification and resolution.
- Auto-instrumentation simplifies application code integration.
- Deep insights into application performance, including end-to-end transaction tracing.
- Intelligent alerting with real-time anomaly detection and customizable alerts.
- Cost-effective pricing plans based on ingestion.
Are unexpected costs disrupting your budget?
Atatus offers transparent, hassle-free monitoring with no hidden charges, allowing you to streamline both your budget and performance. Unlike New Relic or Datadog, which often come with exorbitant costs, Atatus prioritizes delivering maximum value for your investment. We achieve this by offering a comprehensive monitoring experience through our unified observability platform. Our intuitive and user-friendly dashboard simplifies monitoring processes, while our dedicated 24/7 support team stands ready to assist you with any challenges you encounter. With Atatus, you receive unparalleled monitoring capabilities without breaking the bank.
Beyond cost savings, there are numerous reasons to choose Atatus over famed monitoring tools like Datadog, New Relic, and Dynatrace. Switch to Atatus for a more reliable and cost-effective monitoring solution that enhances your operational efficiency.
See How Much Time Your Team Can Save
Engineering teams using Atatus eliminate hours of weekly Elasticsearch maintenance. Book a personalized demo and see how the platform fits your current log pipeline.
2. Splunk
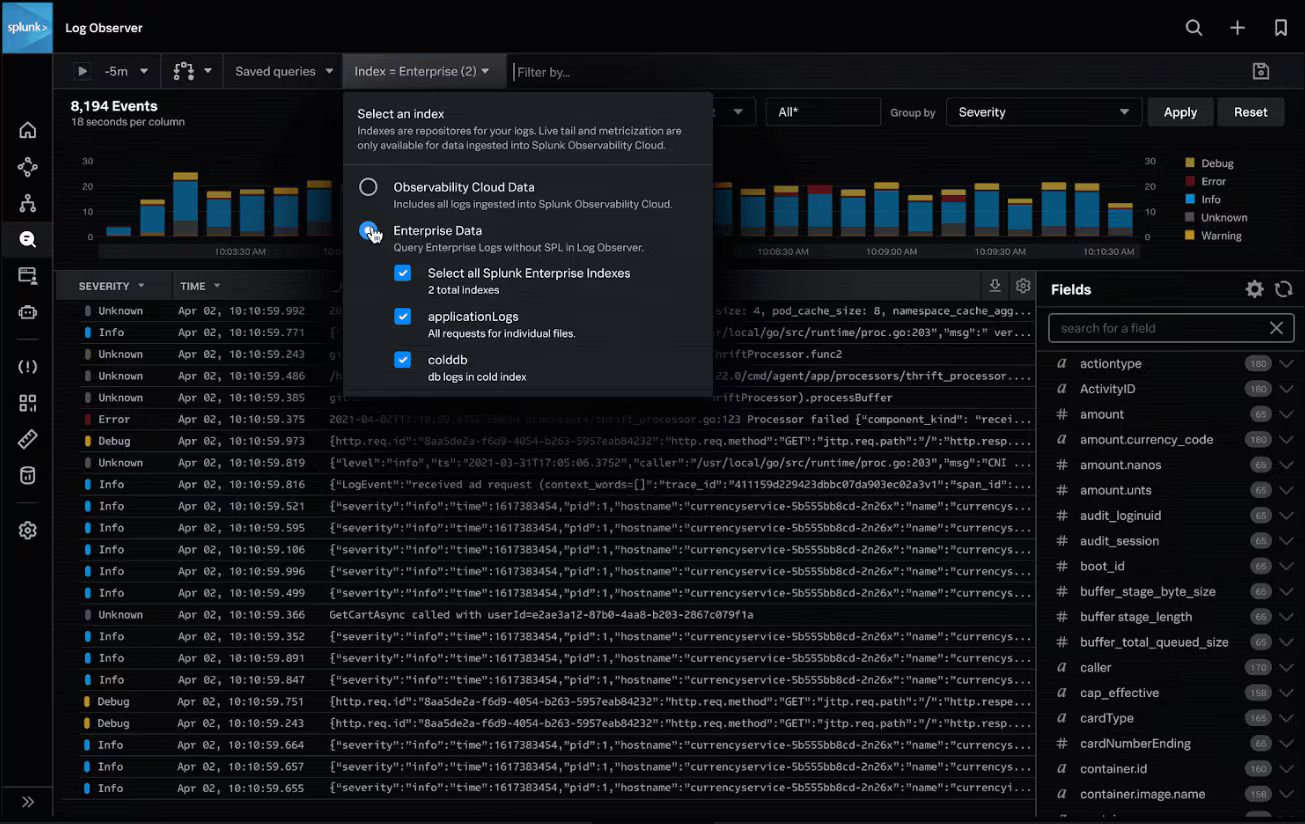
As a modern and feature-rich log management solution, Splunk offers a flexible GUI and robust query language. With Splunk Log Observer, users can effortlessly collect log data from a diverse array of sources, including Kubernetes, Fluentd, and AWS services, streamlining the integration process and reducing MTTR through its no-code search experience.
While Splunk excels in fast searches for short-term data, its performance may vary when retrieving data over longer periods or identifying trends. However, its wide range of additional features compensates for any limitations, including live logging, S3 backup, and seamless integrations with platforms like Heroku and Github.
Beyond log management, Splunk correlates log data and leverages distributed tracing to monitor events, failures, and performance issues across distributed systems.
3. Loggly
As a log management and aggregation tool from SolarWinds, Loggly stands out as one of the most commonly used solutions in the market. It is an agentless log analyzer that gathers data directly from application servers.
Loggly is an excellent tool that enables you to perform real-time log analysis, monitor your logs, and receive alerts when necessary. With its centralized log data storage, you can easily search through your logs and generate customizable dashboards to visualize your data in a way that suits your needs. With support for multiple languages and platforms, including Ruby, Java, Python, PHP, Apache HTTP Server, and many others, it ensures comprehensive log analysis across different environments easily for any text-based logs.
Compared to ELK, Loggly boasts advantages in terms of ease of use and setup, although some users may find its customization options somewhat limited. Also, with pricing starting at $79 per month for their Standard Plan, Loggly offers an accessible solution for organizations of considerable size.
4. Graylog
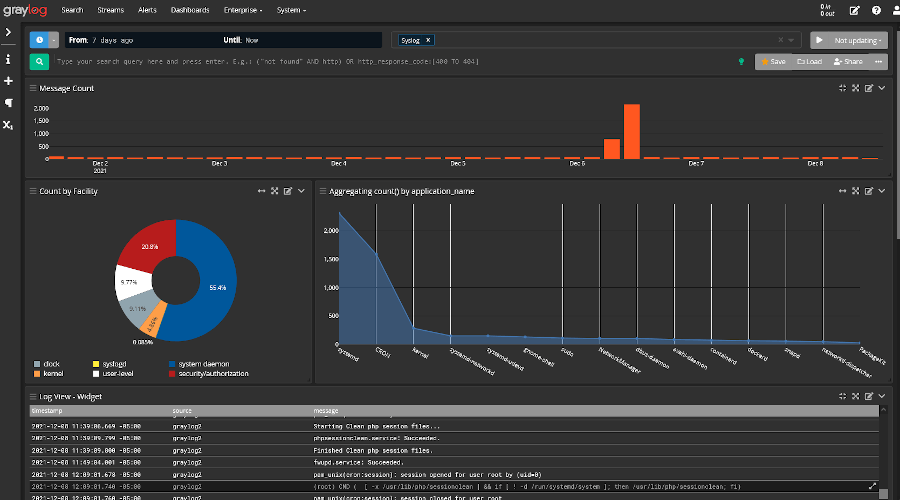
Graylog Open is open-source and, thus a free-to-use log monitoring solution. But they also have a paid Enterprise and cloud version with better functionalities. Graylog offers robust log collection capabilities through its agents, including syslog, GELF (Graylog Extended Log Format), and various plugins for collecting logs from different sources.
It utilizes Elasticsearch as its storage backend, providing scalable and distributed storage for logs. It can scale horizontally by adding more Graylog server nodes and Elasticsearch nodes to handle larger log volumes.
The Dashboard in Graylog consists of various widgets, each offering distinct information sourced from different data types. Users can view counts, charts, graphs, and other visualizations. Graylog provides multiple deployment options, allowing users to either self-host and manage it or opt for a hosted solution, offering greater flexibility and control. The user interface is notably more aesthetically pleasing. However, it's worth noting that Graylog's website design may not appeal to everyone. Graylog also offers SIEM directly, which ELK doesn't ( however, you can use their Logs management to analyze security issues)
5. Dynatrace
Dynatrace offers a full-stack monitoring solution augmented by AI. For log data analysis, Dynatrace provides a user-friendly log viewer that allows users to browse logs within any specified timeframe. Advanced filtering capabilities further enhance the user experience, enabling users to narrow down logs to the specific information they require. This AI-driven approach correlates log messages with potential problems, leveraging this correlation in root-cause analysis for efficient troubleshooting.
As an ELK alternative, Dynatrace's Log Monitoring feature enables users to collect logs from various sources, including applications, infrastructure, and cloud platforms. While Dynatrace's documentation comprehensively covers all nuances, it's worth noting that the platform may require a significant learning curve for newcomers.
6. New Relic
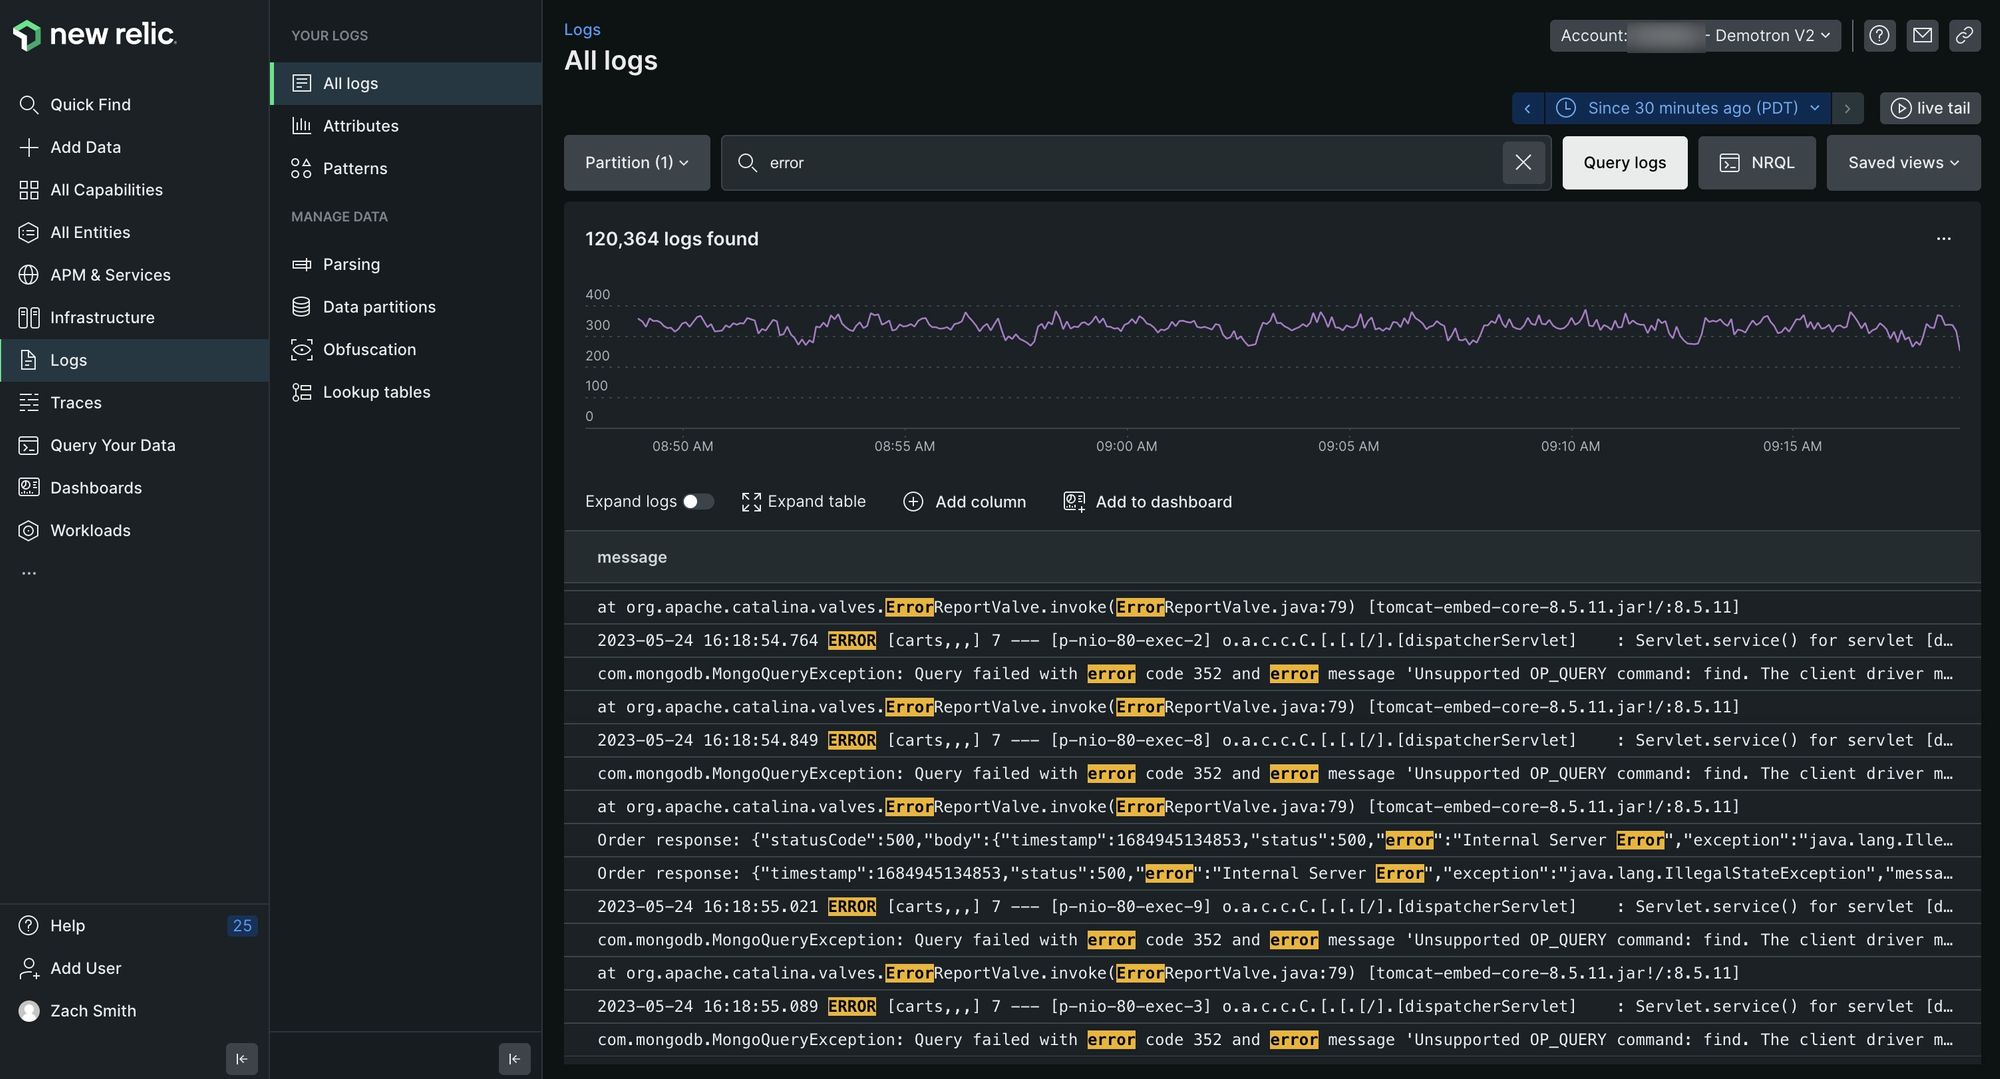
New Relic is a cloud-based observability platform that provides a suite of tools for monitoring application performance, infrastructure, and logs. With its intuitive interface and powerful features, New Relic offers a compelling alternative to the ELK Stack.
Moreover New Relic's extensive product portfolio extends beyond log management , for example, New Relic's integration with its APM (Application Performance Monitoring) agent enables direct forwarding of log data to the platform, eliminating the need for third-party tools and simplifying the data ingestion process. New Relic's cloud-based architecture offers scalability and flexibility, allowing organizations to monitor and manage log data across distributed environments with ease. While the ELK Stack can also scale horizontally, managing cluster configurations and resource allocation may require more effort.
New Relic boasts an open and flexible integration network, supporting popular integrations such as AWS, Azure, MYSQL, NGINX, and more. In cases where specific integrations are not supported, users can leverage its Flex integration builder to create custom integrations from scratch. Users can access basic log management and analysis features of New Relic for free, with additional packages priced based on usage.
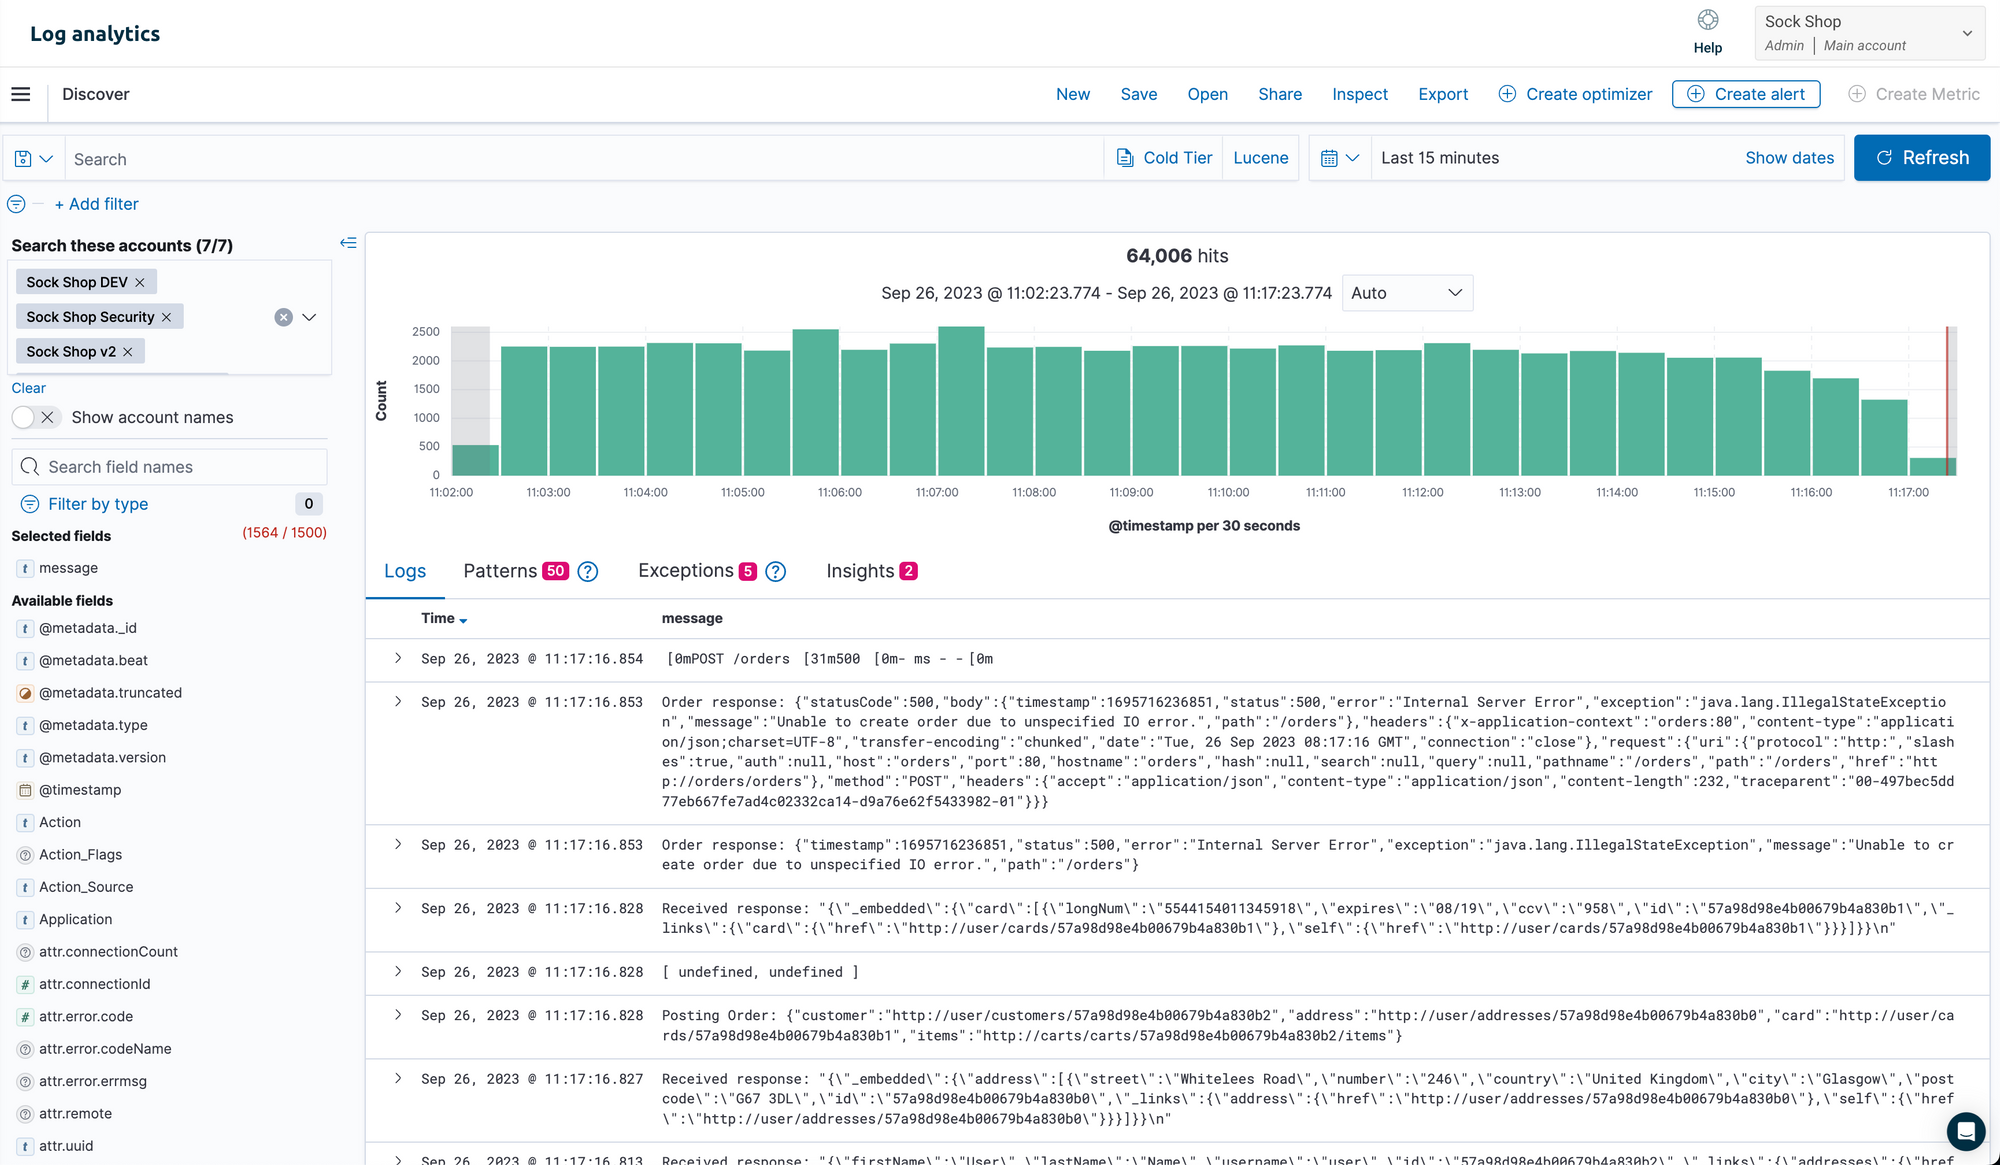
7. Sumo Logic
Sumo Logic provides a unified platform for log management, monitoring, and troubleshooting across diverse environments, including on-premises, cloud, and hybrid infrastructures. It offers centralized log collection, aggregation, and analysis, allowing users to gain insights from all their log data in one place.
One of Sumo Logic's standout features is its real-time analytics capabilities. It enables users to perform real-time log analysis and monitoring, allowing for rapid detection and response to issues and anomalies as they occur.
It offers features such as automated log parsing, pre-built dashboards, and guided troubleshooting workflows, simplifying the process of log analysis . It offers features such as anomaly detection, predictive analytics, and pattern recognition, helping users identify trends, correlations, and potential security threats more effectively. Sumo Logic offers a rich set of visualization tools and customizable dashboards, allowing users to create tailored views of their log data. With a live dashboard and an interactive dashboard, Sumo Logic is strong on its visualization features.
8. Logz.io
Logz.io is a cloud-based observability platform that offers comprehensive log management, monitoring, and security analytics solutions. With Logz.io, users can monitor their infrastructure and applications in real-time, gaining insights into system performance, errors, and other critical events.
It offers dashboards and visualizations to help users track key metrics and identify issues quickly. Logz.io is based on Opensearch (OpenSearch and OpenSearch dashboards are the open source versions of Elasticsearch and Kibana respectively). With its cloud-based architecture, extensive integration ecosystem, and focus on scalability and reliability, Logz.io helps organizations gain visibility into their infrastructure and applications, detect and respond to issues quickly, and improve overall operational efficiency and security.
9. Mezmo (previously LogDNA)
LogDNA was recently changed to Mezmo. Mezmo provides an easy-to-use and scalable solution that serves as an alternative to the ELK stack. LogDNA provides automatic parsing of major log line types upon ingestion and offers Custom Parsing Templates for further customization. It enables users to filter logs based on various criteria such as app, host, or cluster, and allows instant browsing and searching through logs using simple keywords, exclusion terms, chained expressions, and data ranges.
Its log viewer also allows to save searched logs as views and set alerts based on specific conditions. Mezmo offers Kubernetes enrichment, centralizing Kubernetes events, resource metrics, and logs into a single dashboard for comprehensive monitoring.
It supports visualization and custom dashboards, as well as agentless log collection via Syslog and HTTP(s) with full-text search and visualizations. Pricing packages vary based on retention period and number of users, with a free tier available for one user with unlimited saved views but no log retention.
10. Apache Kafka + Apache Flink
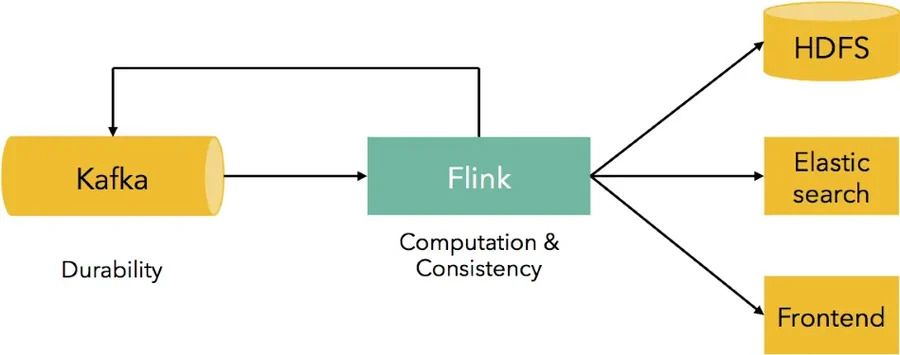
Apache Kafka and Apache Flink form a powerful duo for real-time data processing and analytics. Kafka serves as a distributed streaming platform for handling high-throughput data streams, while Flink is a stream processing framework for executing complex analytics tasks. Together, they enable organizations to ingest, process, and analyze large volumes of data in real-time. While Kafka and Flink are more specialized than the ELK Stack, they offer unparalleled scalability and performance for certain use cases, such as real-time analytics and event-driven architectures.
11. Grafana + Prometheus + Loki
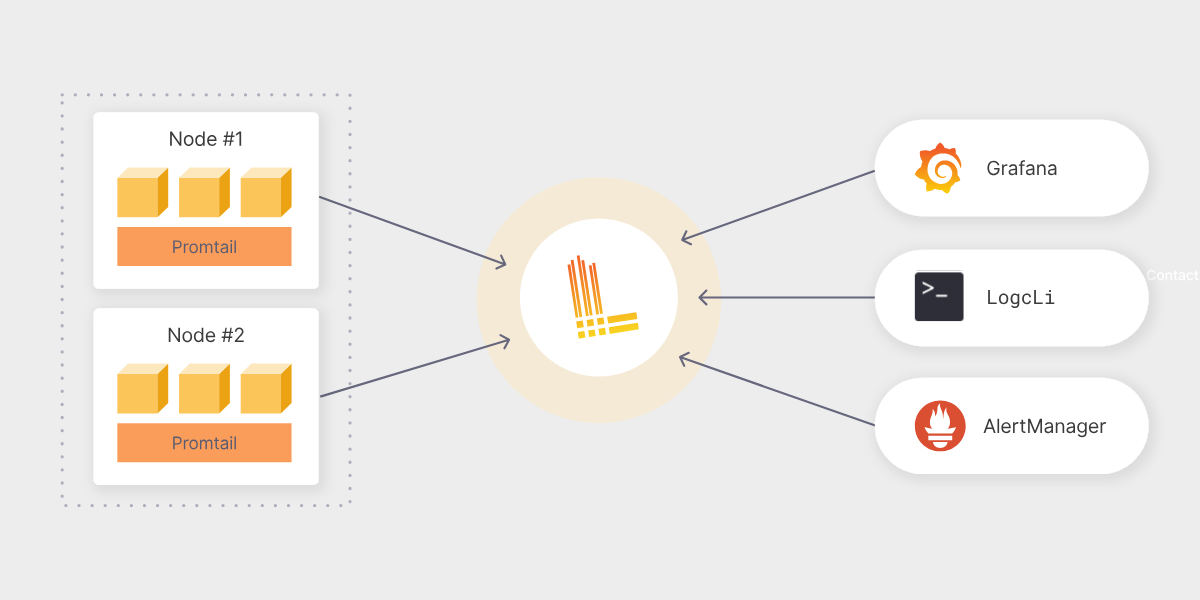
Grafana is a popular open-source analytics and monitoring platform known for its sleek dashboards and extensive plugin ecosystem. Prometheus is a monitoring and alerting toolkit designed for reliability, scalability, and ease of use. Loki, a log aggregation system from the creators of Prometheus, complements Prometheus by focusing on log aggregation while maintaining Prometheus-style labels.
This combination offers a robust solution for metrics and log aggregation, with Grafana providing visualization capabilities and Prometheus handling monitoring and alerting. Loki excels in its efficient log aggregation and querying capabilities, making it a compelling alternative to Logstash.
The only con in this setup is the cost involved, as you would have to buy individual plans for each of them and configure them properly so that they work in tandem.
Migrating from ELK Stack to Atatus
Moving away from a self-managed ELK deployment does not require a full observability redesign. The following steps outline a practical migration path that lets your team start capturing value from Atatus while the existing ELK infrastructure remains available as a fallback.
#1 Identify Existing ELK Data Sources
Audit your current Logstash pipelines and Beats configurations. List every data source such as application logs, server logs, Kubernetes pod logs, database slow query logs, and custom log streams along with their format (JSON, syslog, plain text) and current index patterns in Elasticsearch. This inventory becomes the blueprint for configuring Atatus log collection.
#2 Configure Atatus Log Collection
Install the Atatus agent on your application servers or deploy the Kubernetes DaemonSet for containerized workloads. Atatus supports log ingestion from all platforms currently supported by your ELK pipeline including NGINX, Apache, MySQL, MongoDB, PostgreSQL, and custom application log streams. Log parsing and structuring happen automatically on ingestion.
#3 Enable APM and Distributed Tracing
Install the Atatus APM agent for your application runtime (Java, Python, Ruby, PHP, Node.js, and others). Auto-instrumentation captures request traces, database calls, external HTTP calls, and error context without requiring code changes. Distributed tracing headers are propagated automatically, giving you end-to-end trace context across microservice boundaries.
#4 Create Dashboards and Alerts
Reconstruct your existing Kibana dashboards in Atatus using the Log Analytics and APM dashboard builders. Set up alert rules to match your current Watcher or X-Pack alerting configuration. Atatus supports anomaly detection alerts, threshold-based alerts, and SLO monitors configurable via the UI without requiring query-language expertise.
#5 Retire Elasticsearch Infrastructure
After running Atatus in parallel for a validation period (typically one to two weeks), confirm that all data sources are captured and all critical dashboards and alerts are operational. Then decommission your Logstash pipelines, remove Beats shippers pointed at Elasticsearch, and shut down your ES cluster nodes. The infrastructure cost savings begin immediately.
Ready to Start Your Migration?
Our team can walk you through the migration process and help you replicate your existing ELK dashboards in Atatus.
How to choose the best Log Analytics Tool?
Analyzing log data can be tough due to the sheer volume of information. A good log analytics tool needs to store this data efficiently and make it easy to search through and understand. Here's what to look for when choosing one:
- Make sure the tool can handle large amounts of data without slowing down.
- Look for a tool with a simple interface that lets you search through logs quickly and easily, even from multiple sources.
- Find a tool that can connect log data with other data like metrics and traces. This can help you find the root cause of issues faster.
- It should be capable of filtering, aggregating, and searching data based on various criteria.
- Has visualization capability and should easily integrate with other systems and tools in your environment.
Keep these factors in mind when picking a log analytics tool, and you'll be on your way to making sense of your log data in no time.
It is here that tools like Atatus really stand out. With its powerful data collection and aggregation facility, users can swiftly navigate through logs, execute queries, and identify root causes behind issues, all in real-time.
Further, going beyond traditional log analysis, you can easily make use of their APM and tracing facilities to gain in-depth view of complete system behavior as well.
Stop Managing Elasticsearch. Focus on Building Products.
Join engineering teams that replaced their self-managed ELK deployments with Atatus and got back hours of engineering time every week.
Conclusion
In conclusion, the IT market is teeming with alternatives to the ELK Stack, each catering to specific needs and preferences. Whether it's the comprehensive observability platform of Atatus, the user-friendly interface of Loggly, or the powerful analytics capabilities of Splunk, organizations have a wealth of options to choose from.
Solutions like Grafana + Prometheus + Loki offer flexibility and scalability, while platforms like Dynatrace and New Relic provide advanced monitoring and performance insights.
Additionally, cloud-native offerings such as Logz.io and Mezmo (previously LogDNA) offer ease of use and scalability. Apache Kafka + Flink stands out for real-time stream processing and analytics, making it suitable for high-throughput, low-latency use cases.
Ultimately, the choice of an alternative to the ELK Stack depends on factors such as scalability, ease of use, feature set, and budget considerations, with each solution offering unique advantages to meet the diverse needs of modern enterprises.
Frequently Asked Questions About ELK Stack Alternatives
Common questions engineering teams ask when evaluating alternatives to the ELK Stack for log management, APM, and observability.
1) What is the best ELK Stack alternative?
For most SaaS engineering teams, Atatus is the top choice - a fully managed observability platform covering log management, APM, distributed tracing, real user monitoring, and infrastructure monitoring in a single product. Teams needing open-source flexibility often choose Grafana + Loki + Prometheus. Organizations with large security analytics requirements often evaluate Splunk. The right choice depends on your requirements around infrastructure management, cost predictability, and observability breadth.
2) Why do teams migrate away from ELK Stack?
Teams migrate away from ELK Stack for three primary reasons:
- Operational overhead, managing Elasticsearch clusters requires ongoing engineering effort for provisioning, scaling, upgrades, and tuning.
- Unpredictable costs at scale, infrastructure can reach hundreds of thousands of dollars per month.
- Observability gaps - ELK was designed for log search, but modern teams also need APM, distributed tracing, and RUM, requiring additional tools. Managed platforms like Atatus address all three issues in a single product.
3) Is ELK Stack difficult to maintain?
Yes. Maintaining a production ELK Stack deployment involves configuring and tuning Elasticsearch cluster settings (JVM heap, shard sizing, replica counts), managing Logstash pipeline configuration, handling rolling upgrades across all three components, responding to cluster health warnings, and managing index lifecycle policies for data retention. This ongoing work requires Elasticsearch-specific expertise. For teams without dedicated infrastructure engineering resources, the maintenance burden of ELK is a common reason to evaluate managed alternatives.
4) What is a managed alternative to Elasticsearch?
A managed alternative to Elasticsearch is a fully hosted observability or log management service that handles storage, indexing, and search infrastructure on your behalf, eliminating the need to provision and maintain Elasticsearch clusters. Atatus is a managed alternative that goes beyond log storage, offering APM, distributed tracing, real user monitoring, and infrastructure metrics in a single platform. Other managed alternatives include Loggly, Logz.io, Sumo Logic, and New Relic.
5) How can I migrate from ELK Stack to Atatus?
Migrating from ELK Stack to Atatus is a five-step process:
- Inventory your existing Logstash pipelines and data sources.
- Install the Atatus agent - log collection begins immediately.
- Enable the APM agent for your application runtime to capture traces.
- Rebuild critical dashboards and configure alert rules in Atatus.
- After a parallel-run validation period, decommission your Elasticsearch infrastructure.
Most teams start sending logs to Atatus within minutes, and a full migration typically takes one to two weeks including validation.
What are the disadvantages of ELK Stack?
The main disadvantages of ELK Stack are:
- Complex setup requiring configuration of three separate products (Elasticsearch, Logstash, Kibana) plus data shippers.
- High infrastructure cost at scale - storing large log volumes can exceed $495,000/month.
- Ongoing maintenance burden requiring Elasticsearch-specific expertise.
- Limited out-of-box observability - APM, distributed tracing, and RUM require additional Elastic products.
- KQL complexity - Kibana Query Language has a steep learning curve.
- Stability risks - exceeding index storage limits can lead to cluster instability or data loss.
Does Atatus replace Elasticsearch?
Yes. Atatus replaces the entire ELK Stack - Elasticsearch (log storage and search), Logstash and Beats (log ingestion), and Kibana (visualization) as a fully managed SaaS service. Additionally, Atatus extends beyond what ELK Stack offers by including native APM, distributed tracing, real user monitoring, infrastructure monitoring, and synthetic monitoring in the same platform. For most engineering teams, Atatus is a complete functional replacement for a self-hosted ELK deployment with significantly lower operational overhead.
#1 Solution for Logs, Traces & Metrics
![]() APM
APM
![]() Kubernetes
Kubernetes
![]() Logs
Logs
![]() Synthetics
Synthetics
![]() RUM
RUM
![]() Serverless
Serverless
![]() Security
Security
![]() More
More


![Datadog vs Splunk: A Side-by-Side Comparison [2026]](/blog/content/images/size/w960/2024/12/Untitled-design--41-.png)