Datadog vs Grafana: Comparison Guide 2025
Monitoring tools are essential for maintaining stability and performance. They enable organizations to monitor diverse metrics, analyse trends, and identify anomalies to prevent downtime and maximize resource efficiency.
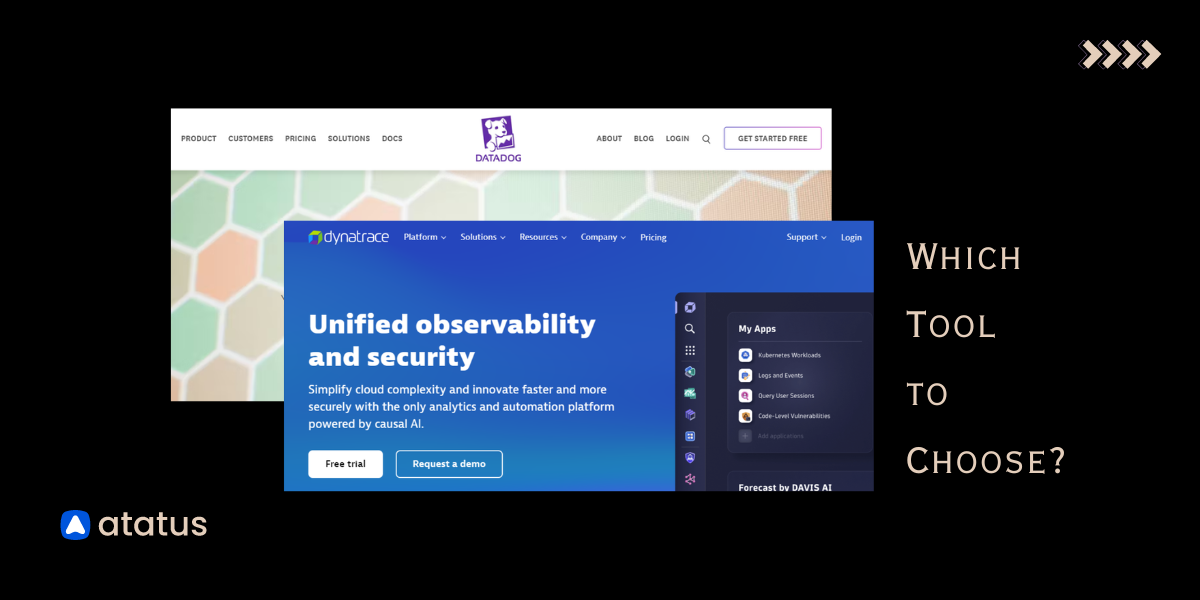
Both Datadog and Grafana are recognized for their effectiveness and versatility among the leading solutions in this domain.
Understanding the nuances between these platforms is vital for businesses to make informed decisions about which tool best suits their needs. Businesses need to understand the nuances between these platforms to choose the best one for their needs.
In this blog, lets compare Datadog and Grafana, side by side providing a comprehensive overview of their features.
Lets get started!
Table of Contents
- Datadog - An Overview
- Grafana - An Overview
- Monitoring: Datadog for Comprehensive Monitoring, Grafana for Visualization Excellence
- Alerting Solutions: Tie, based on preference of the user
- Integration: Datadog for built-in integrations and Grafana for Custom Connectivity through Plugins
- Data Visualization and Dashboards: Tie, Let Your Needs and Budget Decide
- Security features: Choose Wisely
- Pricing: Datadog for Feature-Rich Monitoring, Grafana for Budget-Friendly Monitoring
- When to use What?
- Explore Atatus - An alternative to Datadog and Grafana
Datadog - An Overview
Datadog provides a comprehensive monitoring solution for both applications and IT environments. It simplifies the task of monitoring software, servers, databases, and other components for businesses, regardless of their size.
Datadog provides tools to monitor the health and performance of your system. These tools include metrics monitoring, logs management, application performance montoring (APM), and infrastructure monitoring.
As one of the leading APM tools, Datadog extends its functionality with advanced capabilities such as alerting and notification systems, integration with third-party tools, anomaly detection using machine learning, and distributed tracing for distributed systems and microservices.
This makes Datadog an excellent choice for monitoring web application performance and ensuring optimal user experience.
Grafana - An Overview
Grafana is a data visualization and monitoring platform developed by Grafana Labs. It provides a unified interface for users to create interactive dashboards, enabling visualization of data from diverse sources like databases, cloud services, and applications.
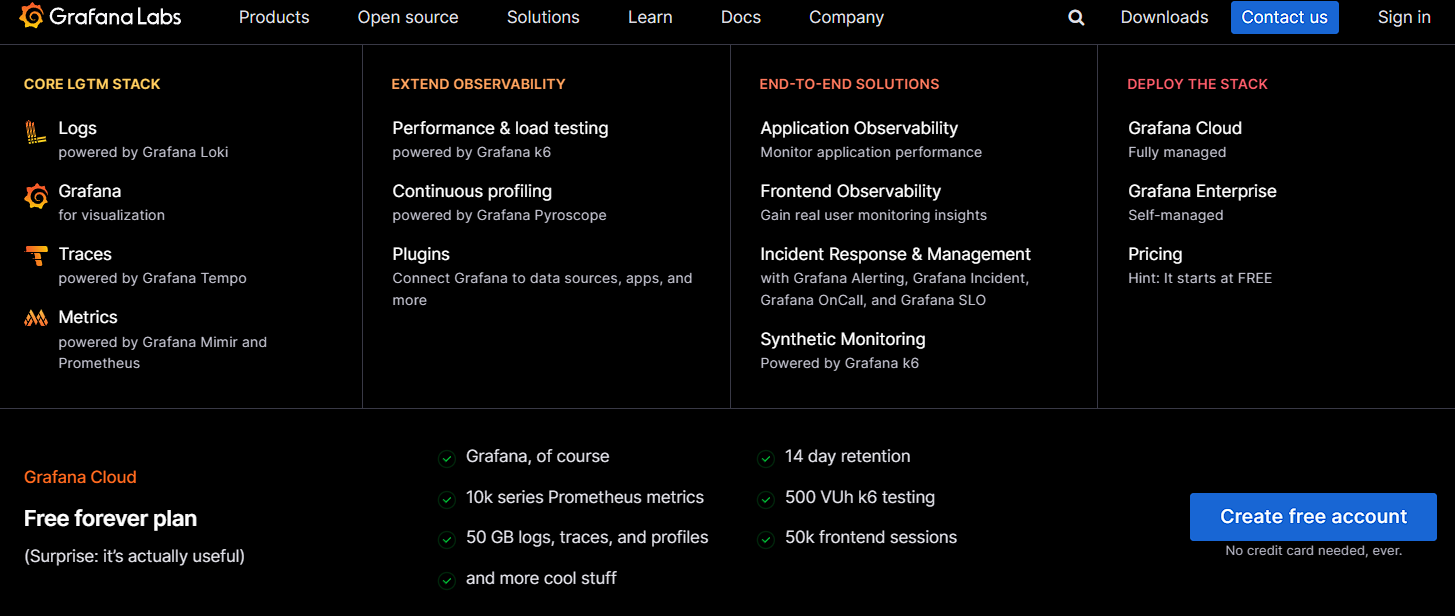
With Grafana, users can query, visualize, and explore metrics, logs, and traces, irrespective of where the data resides. Grafana's versatility makes it a go-to tool for organizations seeking efficient data interpretation and understanding.
Monitoring: Datadog for Comprehensive Monitoring, Grafana for Visualization Excellence
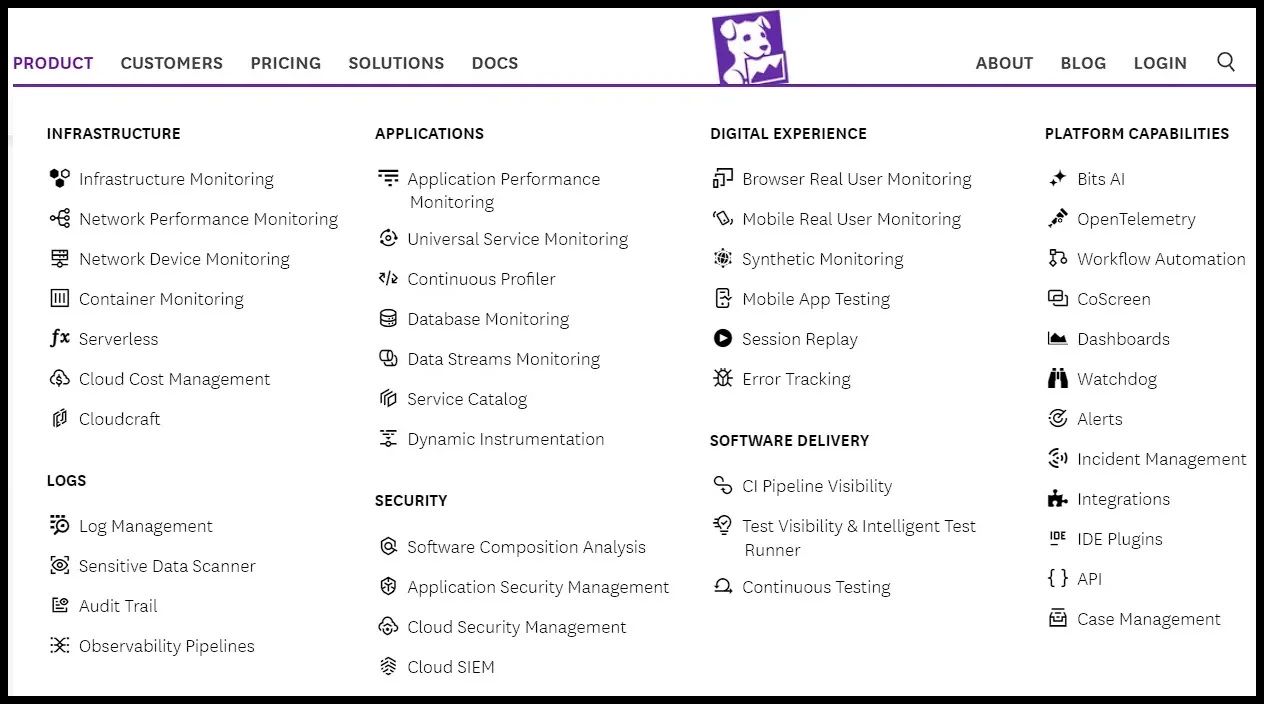
Datadog is well-known for its comprehensive monitoring abilities, offering complete solutions for keeping an eye on infrastructure, applications, and logs. Users can see how systems are performing in real-time, checking metrics, traces, and logs conveniently from one place.
The wide range of monitoring services offered by Datadog includes,
- Infrastructure monitoring
- Network performance monitoring
- Network device monitoring
- Container monitoring
- Log management
- Application performance monitoring
- Database monitoring
- Real user monitoring
- Synthetic monitoring
On the other hand, Grafana is mainly a visualization tool, relying on data sources like Prometheus, Graphite, and Elasticsearch for monitoring.
Grafana cannot perform monitoring independently, it requires integration with external tools for monitoring. Grafana seamlessly integrates with popular monitoring tools,
- Elasticsearch for log visualization and analysis.
- Prometheus for robust metrics collection and monitoring.
- Jaeger for end-to-end tracing of distributed systems.
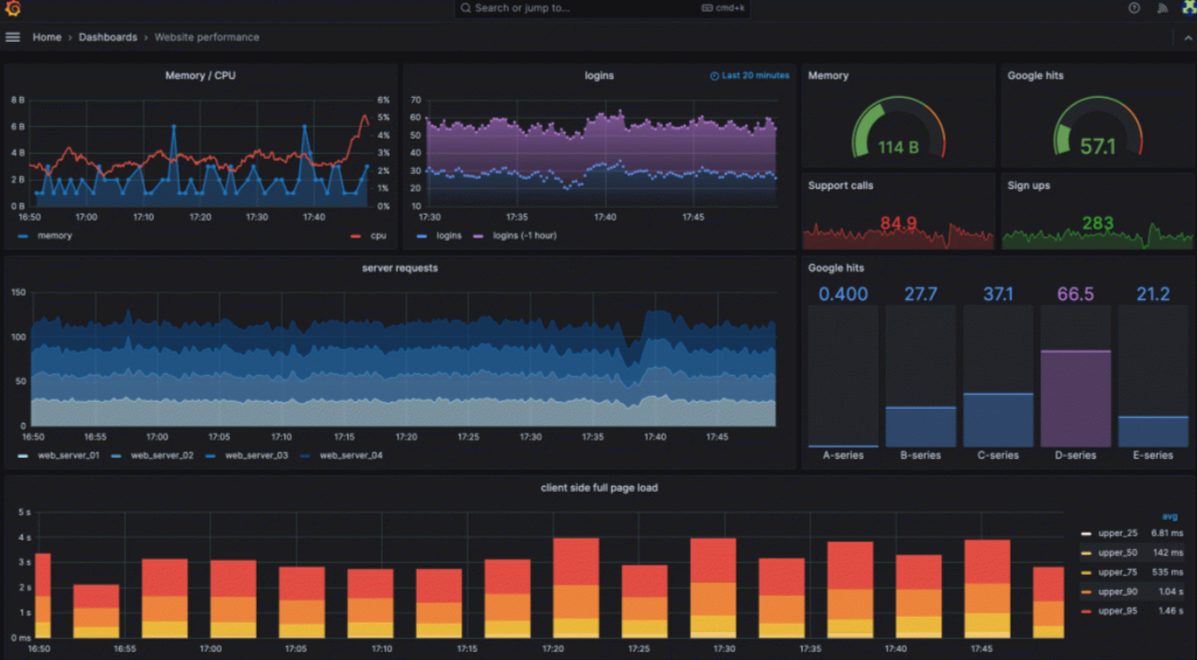
Grafana offers a diverse range of visualization options, from simple line charts to complex heatmaps and histograms, allowing users to customize their monitoring dashboards to their specific needs.
| Feature | Datadog | Grafana |
|---|---|---|
| Infrastructure Monitoring | Yes | No |
| Application Monitoring | Yes | No |
| Log Monitoring | Yes | No |
| Real-Time Monitoring | Yes | Yes |
| Data Source Integration | Limited | Yes(Prometheus, Graphite, Elasticsearch) |
| Visualization options | Limited | Extensive |
| Customization | Limited | Extensive |
If you are looking for extensive monitoring features, Datadog could be the right choice. However, if you prioritize data visualization and customization, or only require basic monitoring, Grafana could be a great option.
Alerting Solutions: Tie, based on preference of the user
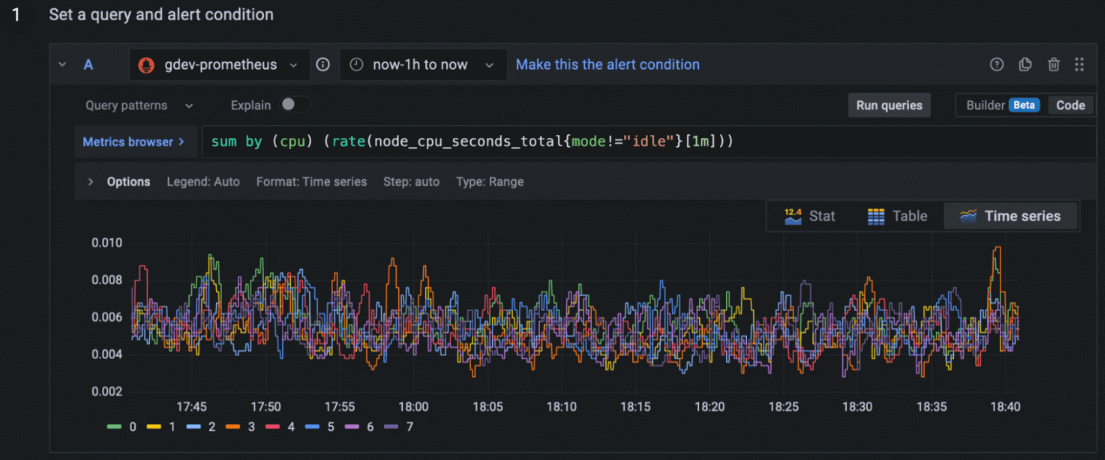
Both Datadog and Grafana offers alerting and notification feature to help you stay informed about potential issues in your environment.
With Datadog, users can create customized alerts based on specific conditions such as metric thresholds or anomaly detection. Moreover, Datadog seamlessly integrates with popular communication platforms like Slack and PagerDuty, ensuring timely notifications in real-time.
On the contrary, Grafana's alerting capabilities are dependent on plugins and data sources. Users can customize their alerting strategies based on their specific needs. This flexibility can be helpful for those with unique alerting requirements.
| Feature | Datadog | Grafana |
|---|---|---|
| Alert Creation | Customized alerts based on specific conditions | Dependent on plugins and data sources |
| Flexibility | Moderate | High |
| Ease of Use | Easy to set up and configure | Requires additional setup with plugins |
| Learning Curve | Low | High |
Ultimately, the choice between the two depends on the specific requirements and preferences of the user.
Integration: Datadog for built-in integrations and Grafana for Custom Connectivity through Plugins
Integration in a monitoring solution refers to the ability to connect and interact with other systems, or applications to collect data, understand it, and act on it.
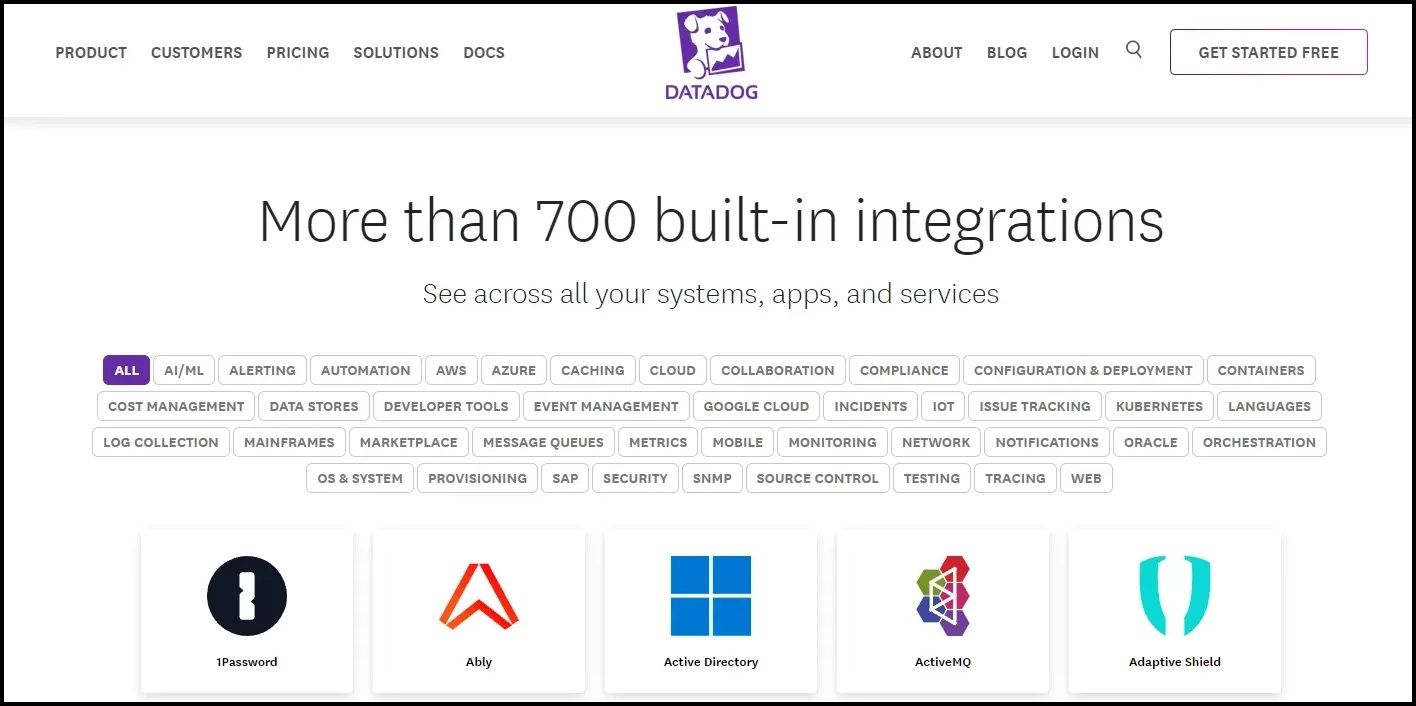
Datadog offers an extensive range of integrations, covering cloud platforms, databases, containers, and more, with over 700 built-in integrations.
In contrast, Grafana is highly customizable, supporting integration via plugins with various data sources, including popular time-series databases, SQL databases, and cloud services.
| Feature | Datadog | Grafana |
|---|---|---|
| Number of Integrations | Over 700 built-in integrations | Supports integration via plugins |
| Customization | Limited | Extensive |
| Ease of Use | Easy to use | May require more setup |
| Out-of-the-box Options | Plenty of ready-to-go integrations | Depends on plugins for integration |
Datadog is great for users who prefer simplicity with lot of ready-to-go integrations, while Grafana suits those who prefer customization, even though it requires more setup.
Data Visualization and Dashboards: Tie, Let Your Needs and Budget Decide
Data visualization transforms data into graphical representations for easier understanding. Whereas dashboards provides consolidated, real-time views of key metrics and performance indicators. Datadog and Grafana are popular tools for visualizing data on dashboards.
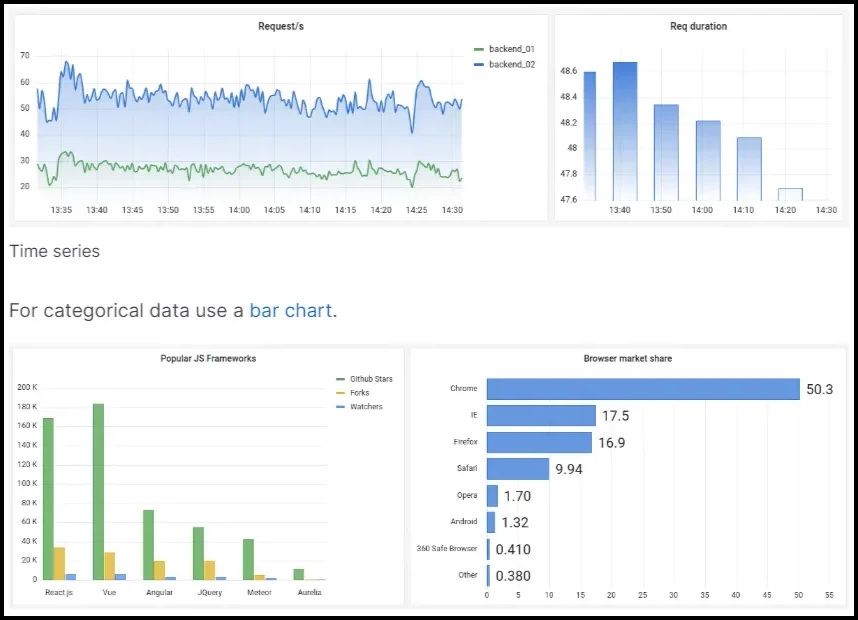
Grafana provides extensive customization options, enabling users to design visually engaging dashboards showcasing data through elegant graphs, charts, and other visual representations. Users can customize their dashboards to specific needs, making them perfect for detailed data analysis.
Grafana also allows users to visualize data across different time periods, enabling trend analysis and historical comparison for valuable insights.
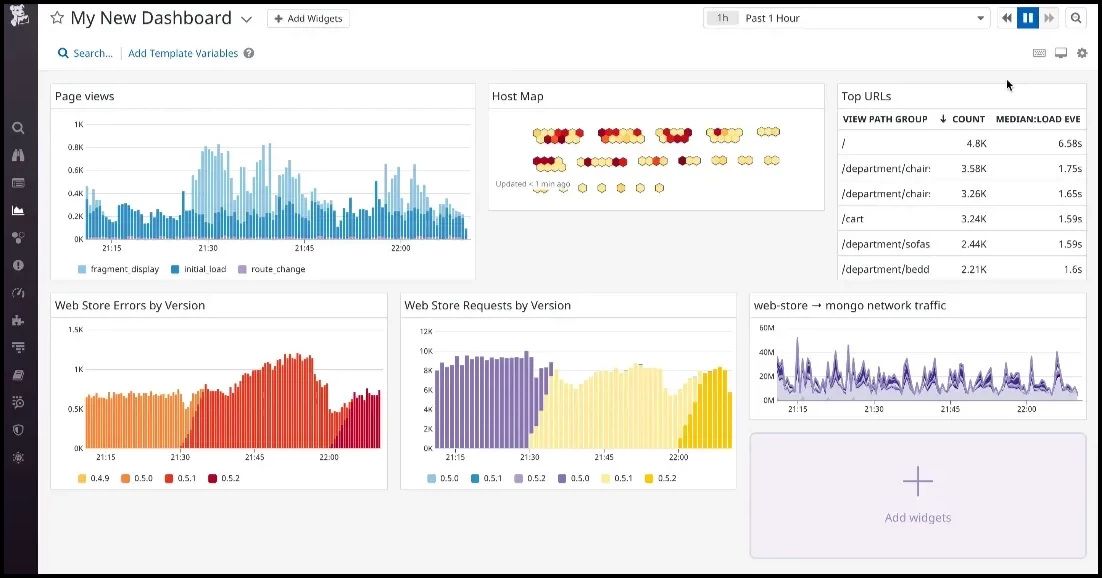
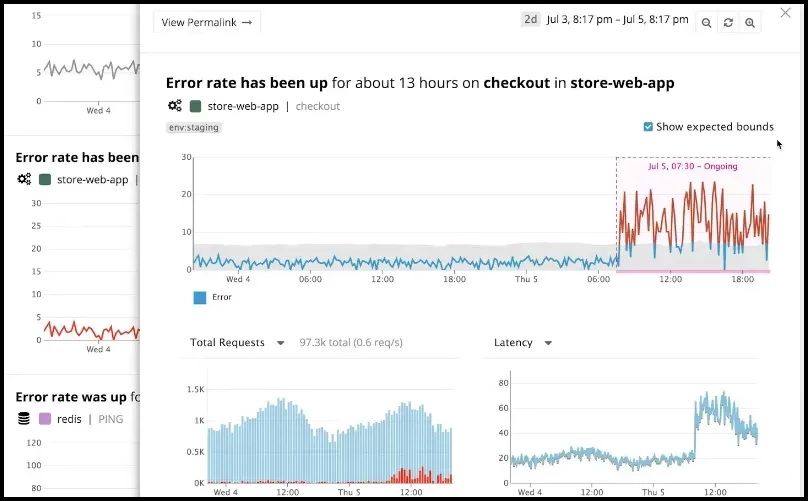
On the other hand, Datadog focuses on simplicity and ease of use. Datadog provides pre-built dashboards that users can quickly customize using a drag-and-drop interface, without needing coding skills or complex queries. This makes Datadog ideal for users who want to create dashboards fast without using coding.
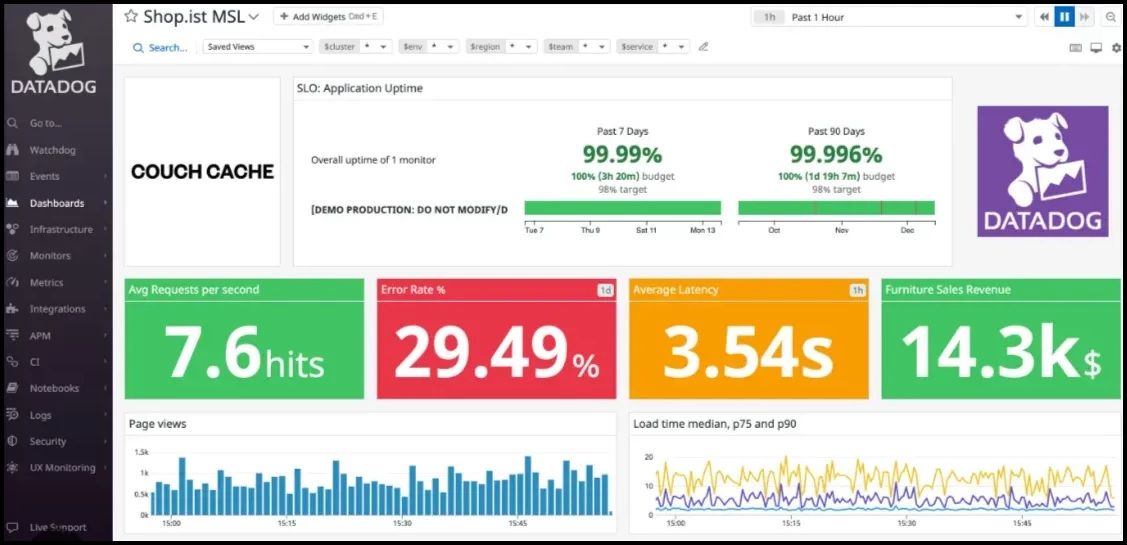
Also Datadog provides two types of dashboards, TimeBoard and ScreenBoard. TimeBoards are great for troubleshooting and correlation, while ScreenBoards are excellent general status boards, perfect for viewing the overall health and status of a service or entire infrastructure. You can also customize ScreenBoard with widgets like graphs, query values, and images.
If you prioritize advanced data visualization and highly customizable dashboards, Grafana is the superior choice. However, if you need quick and user-friendly dashboard deployment without coding, Datadog is a go-to option.
Security Features: Choose Wisely
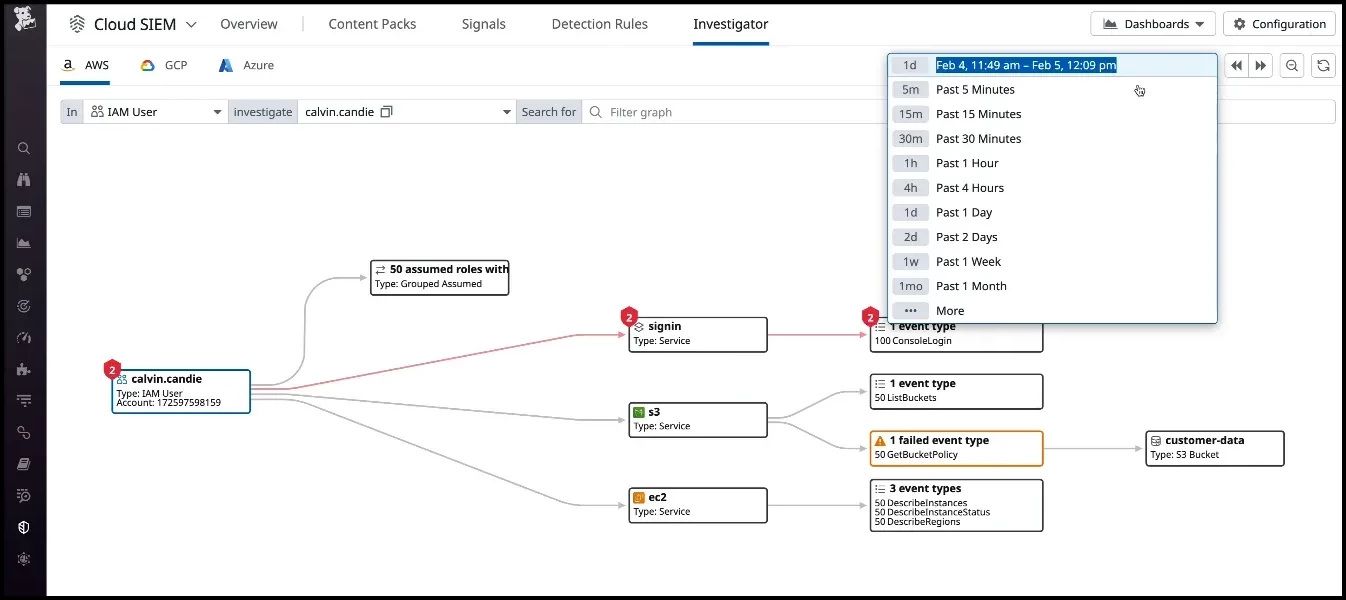
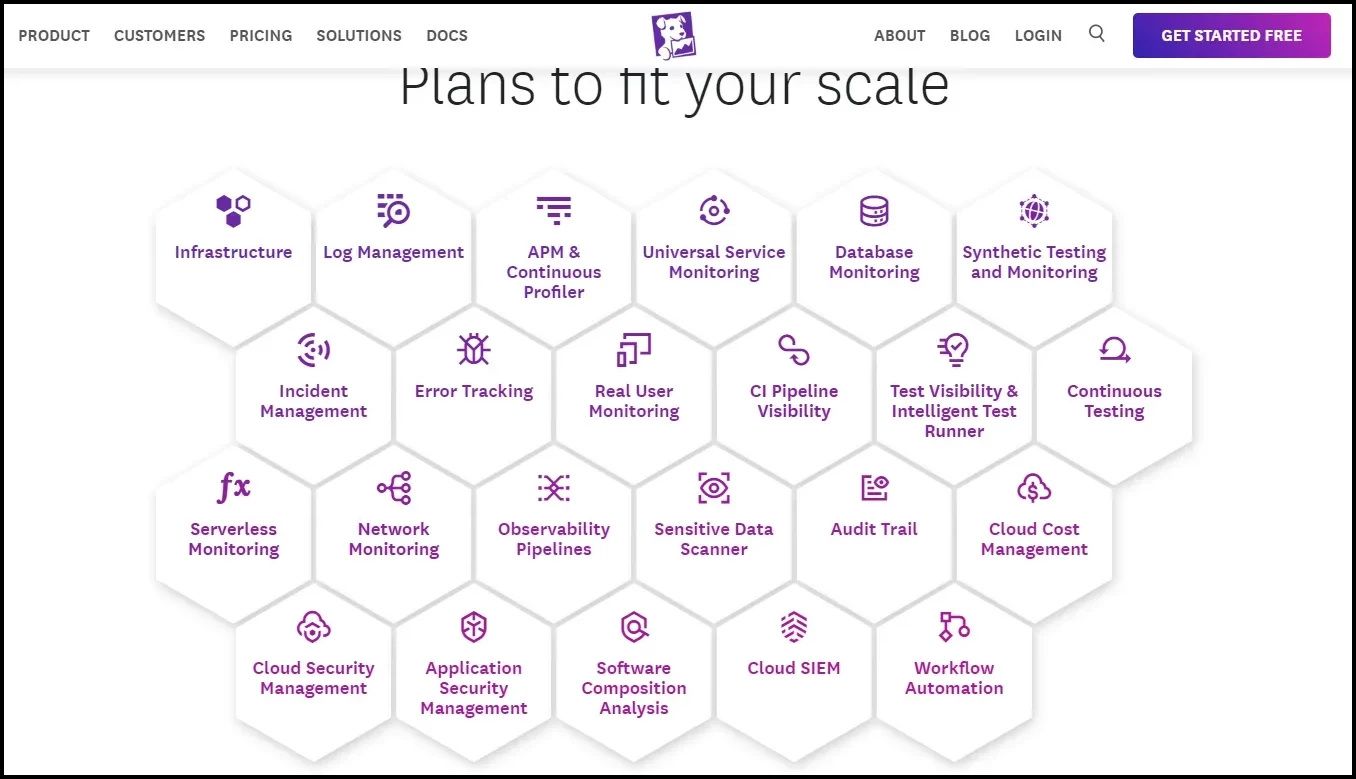
When comparing Datadog and Grafana in terms of security features, datadog has a wide range of features that make it stand out. These features include software composition analysis, continuous vulnerability detection, and Cloud SIEM for real-time threat detection.
This platform prioritizes application security management and simplifies cloud security for both DevOps and Security teams.
In contrast, Grafana focuses primarily on monitoring and visualization capabilities, lacking native security features. However, its flexibility allows integration with third-party security tools, enhancing overall security efforts.
Pricing: Datadog for Feature-Rich Monitoring, Grafana for Budget-Friendly Monitoring
Datadog operates on a subscription model. They have different pricing levels depending on what features and services you need. Datadog is considered to be quite expensive because it offers a lot of different features for businesses.
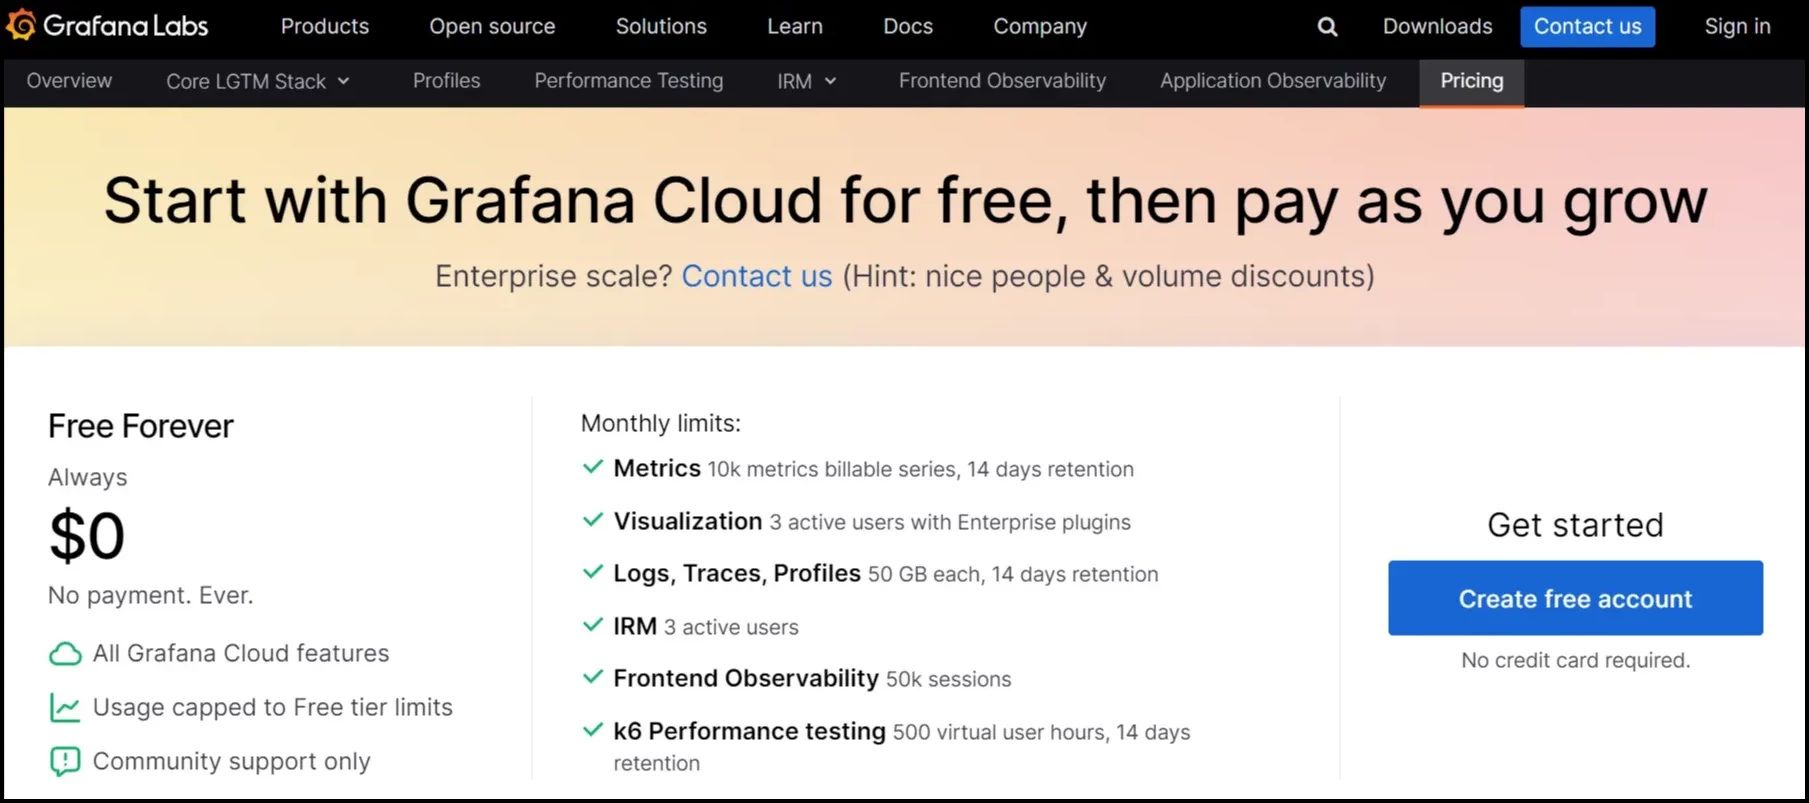
On the other hand, Grafana's basic version is free since it's open-source. However, if you want extra features or support, you might need to pay. They offer a cloud service called Grafana Cloud which also has different pricing options based on what kind of data you are using and how much support you need.
If you need a lot of features and can afford it, Datadog might be worth it. But if you are on a budget side or only need basic monitoring, Grafana's free version could be a good option.
When to use What?
Choose Datadog if :
- If you seek a comprehensive observability solution that meets all your needs, regardless of cost considerations.
- You value user-friendly monitoring solutions that are easy to set up and manage.
- Integration with other tools and services is essential for your monitoring needs.
- Monitoring the performance of your applications is a priority, and you need comprehensive APM capabilities.
- You prefer having pre-built dashboards and alert configurations for quick deployment.
- You need seamless data collection across your entire environment, both cloud-based and on-premises.
Choose Grafana if :
- If you aim to visualize data from various data sources, particularly time-series data.
- You need a powerful visualization tool that can transform complex data into insightful graphs and charts. Flexible data visualization formats offer versatility in presenting data, ensuring that you can choose the most suitable format.
- You value a plugin ecosystem that extends the capabilities of your visualization platform with additional features and integrations.
- You need a highly customizable dashboard for visualization.
- You look for dashboard sharing and collaboration features.
Explore Atatus - An alternative to Datadog and Grafana
Atatus is a comprehensive full-stack monitoring platform, that provides an excellent alternative to Datadog and Grafana.
Atatus offers a range of products including Application Performance Monitoring, Infrastructure Monitoring, Database Monitoring, Logs Monitoring, Real User Monitoring, API Analytics, and Uptime Monitoring (Synthetics) among others.
Atatus provides instant visibility into your application's performance, user experience, and infrastructure well-being. Our dashboards are adaptable, letting you monitor performance metrics that suit your requirements.
Atatus's intuitive interface offers powerful visualization tools, making it simple to drill down into specific data points and uncover insights. We offer intelligent alerting capabilities, automatically notifying you of critical issues in real time. It automatically detects anomalies, correlates issues, and reduces alert noise, simplifying troubleshooting and minimizing downtime.
Atatus provides budget-friendly pricing plans that prioritize cost effectiveness without sacrificing features and functionalities.
If you are not yet an Atatus customer, you can sign up for a 14-day free trial .
#1 Solution for Logs, Traces & Metrics
![]() APM
APM
![]() Kubernetes
Kubernetes
![]() Logs
Logs
![]() Synthetics
Synthetics
![]() RUM
RUM
![]() Serverless
Serverless
![]() Security
Security
![]() More
More