Profiling Using Java Agents

The core functionality of the Java Instrumentation API lies in its ability to modify the bytecode of classes being executed by the virtual machine.
This capability allows for a range of monitoring tasks to be carried out, such as event recording and data gathering, which can provide valuable insights into an application's performance and behavior.
With the help of Java Agents, which are packages containing classes that implement the Instrumentation APIs, it is possible to apply code to specific classes and perform targeted monitoring activities.
Java agents are powerful tools that enable developers to profile their applications dynamically. They accomplish this by instrumenting the application's bytecode at runtime, allowing developers to monitor application behavior, collect metrics, and gain insights into how the application is performing.
In this blog post, we will explore profiling using Java agents in-depth.
Table of Contents
- Introduction to Profiling
- What are Java Agents?
- How to create a Java Agent?
- Constructing Java Agent
- Profiling with Java Agent
- Java Profiling Tools
- Profiling Techniques with Java Agents
Introduction to Profiling
Profiling is a process that helps in analyzing the performance of a program or system under different conditions to identify any bottlenecks or issues that may be impacting its performance. Profiling can be done using various techniques, such as monitoring system resources, analyzing logs, or using profiling software.
One popular method of profiling is using Java agents, which are software modules that can be loaded dynamically into a Java Virtual Machine (JVM) to analyze the behavior of a Java application. By using Java agents, developers can gather detailed data on application performance, including CPU usage, memory usage, and execution time of individual methods.
To perform profiling using Java agents, the agent is added to the command line arguments of the JVM when starting the application. Once the application is running with the attached agent, the agent can collect performance data that can be used to identify and optimize any performance issues in the application.
What are Java Agents?
Java agents are software modules that can be dynamically loaded into a Java Virtual Machine (JVM) to monitor and analyze the behavior of a Java application. Typically, Java agents are utilized for profiling Java applications to identify and optimize performance issues.
One instance of a Java agent is the Java Management Extensions (JMX) agent. This agent offers a method to monitor and manage Java applications and their JVMs via standard interfaces. The JMX agent can also collect data on system resource usage, configure different aspects of the JVM, and monitor application performance.
Another example of a Java agent is the Java Debug Interface (JDI) agent, used for debugging Java applications. The JDI agent enables developers to examine an application's code and data structures during runtime and diagnose problems, eventually aiding in the resolution of application problems.
Java agents are loaded into the JVM using the -java agent command line argument when starting the JVM. After loading, agents can begin collecting data on application performance and providing insights into behavior, aiding developers and system administrators to gain deeper insights into Java application performance and optimize them for better performance.
Java agents are versatile programs that can be used for a variety of purposes. Some common use cases for Java agents include:
- Profiling and monitoring Java applications: Java agents can be used to collect performance data and analyze the behavior of Java applications, without requiring any modifications to the application's source code.
- Debugging: Java agents can be used to inject code into a running Java application for the purpose of debugging, without the need to modify the application's source code.
- Enforcing security policies: Java agents can be used to intercept and modify calls to sensitive APIs, in order to enforce security policies and prevent unauthorized access to system resources.
- Enhancing functionality: Java agents can be used to modify the bytecode of a Java application at runtime, in order to add new features or functionality to the application. This allows developers to extend the functionality of an application without modifying its source code.
How to create a Java Agent?
Creating a Java agent involves several steps. Here's a complete explanation:
Step 1: Define the Agent Class
The first step is to define the Java agent class that will contain the premain() or agentmain() method. The premain() method is called when the Java Virtual Machine (JVM) starts up, while the agentmain() method is called when the Java agent is loaded at runtime.
Here is an example of a Java agent class with the premain() method:
public class MyAgent {
    public static void premain(String agentArgs, Instrumentation inst) {
        // Agent code here
    }
}
Step 2: Configure the Manifest File
The next step is to create a manifest file (MANIFEST.MF) that specifies the Java agent class and any dependencies required by the agent. The manifest file must be placed inside the JAR file that contains the Java agent class.
Here is an example of a manifest file:
Manifest-Version: 1.0
Premain-Class: MyAgent
This manifest file specifies that the main class of the Java agent is MyAgent.
Step 3: Build the Agent JAR File
Once the Java agent class and manifest file have been created, they must be packaged into a JAR file. This JAR file should also contain any dependencies required by the agent.
Here is an example of how to build the JAR file using the Maven build system:
mvn packageStep 4: Load the Agent
The final step is to load the Java agent into the JVM. This can be done in two ways:
- Using the
-javaagentcommand-line option when starting the JVM. - Programmatically, using the Java Attach API.
Here is an example of how to load the Java agent using the -javaagent command-line option:
java -javaagent:myagent.jar -jar myprogram.jarThis command loads the Java agent contained in myagent.jar when the JVM starts up, and then runs the myprogram.jar file.
And here is an example of how to load the Java agent programmatically using the Java Attach API:
import com.sun.tools.attach.VirtualMachine;
import java.io.File;

public class AgentLoader {
    public static void main(String[] args) throws Exception {
        String pid = "1234"; // ID of the process to attach the agent to
        String agentJar = "myagent.jar"; // path to the Java agent JAR file
        VirtualMachine vm = VirtualMachine.attach(pid);
        vm.loadAgent(new File(agentJar).getAbsolutePath());
        vm.detach();
    }
}
This code attaches the Java agent contained in myagent.jar to the process with ID 1234.
Using Java Agents for Real-time Profiling
Once you have written and registered your Java Agent, you can start profiling CPU and memory usage in real-time. To do this, you'll need to implement logic for measuring CPU usage and memory usage and report the results back to your monitoring system.
To measure CPU usage, you can use the java.lang.management.ThreadMXBean interface, which provides methods for querying the CPU usage of individual threads in the JVM. You can periodically query this interface and calculate the CPU usage of your application based on the thread CPU times.
To measure memory usage, you can use the java.lang.management.MemoryMXBean interface, which provides methods for querying the heap and non-heap memory usage of the JVM. You can periodically query this interface and report the current memory usage of your application.
Constructing Java Agent
Let's construct a straightforward "Hello World" implementation using the following principles.
Make a straightforward Maven project. Include the Apache Maven Jar Plugin in the pom.xml file.
<build>
    <plugins>
        <plugin>
            <groupId>org.apache.maven.plugins</groupId>
            <artifactId>maven-jar-plugin</artifactId>
            <version>2.4</version>
            <configuration>
                <archive>
                    <manifestFile>src/main/resources/META-INF/MANIFEST.MF</manifestFile>
                </archive>
            </configuration>
        </plugin>
    </plugins>
</build>
<manifestFile> contains the path to our custom MANIFEST.MF file. This is the only modification needed to the pom.xml.
Make an agent class HelloWorldAgent
package com.oliver.javaagent.helloworldagent;
import java.lang.instrument.Instrumentation;
public class HelloWorldAgent {
    public static void premain(String agentArgs, Instrumentation inst) {
        System.out.println("Hello World! Java Agent");
    }
}
Create MANIFEST.MF with the following information in src/main/resources/META-INF/.
Manifest-Version: 1.0
Premain-Class: com.oliver.javaagent.helloworldagent.HelloWorldAgent
Let's utilise the maven-generated default App class to test our Agent class. The term "App" has been added to the system output statement.
package com.oliver.javaagent.helloworldagent;
/**
* Hello world!
*
*/
public class App
    {
    public static void main( String[] args )
        {
            System.out.println( "Hello World! App" );
        }
    }
Now run a maven install to create the agent JAR
Use the -javaagent command line parameter to execute the App class.
java -javaagent:<path-to-jar-file>/helloworldagent-0.0.1-SNAPSHOT.jar com.oliver.javaagent.helloworldagent.AppOutput:
Hello World! Java Agent
Hello World! App
Profiling with Java Agent
By using a Java Agent, you can instrument your code to gather detailed information about the behavior of your application, including its execution time, method calls, and memory usage.
To profile a Java application with a Java Agent, you will first need to create a Java Agent using the steps outlined in the previous section. Once you have created your Java Agent, you can use it to profile your application by following these steps:
1. Start your Java application with the Java Agent attached
To do this, you will need to add the following command-line option to your Java invocation:
-javaagent:/path/to/your/agent.jarReplace /path/to/your/agent.jar with the path to the JAR file containing your Java Agent.
2. Run your application normally
Once your Java Agent is attached to your application, you can run your application as you normally would. Your Java Agent will automatically begin profiling your application as it runs.
3. Analyze the results
Once your application has finished running, you can analyze the profiling data generated by your Java Agent. There are several tools available for analyzing profiling data, including JVisualVM, JProfiler, and YourKit.
Using these tools, you can analyze the performance characteristics of your application in detail, including its execution time, memory usage, and method calls. This information can be used to identify performance bottlenecks and optimize your application for better performance.
Here's a simple example of profiling a "Hello World" application using a Java Agent:
import java.lang.instrument.Instrumentation;

public class HelloWorldAgent {
    public static void premain(String args, Instrumentation inst) {
        System.out.println("Hello World!");
    }
}
In this example, the Java Agent consists of a single class with a premain method. The premain method is called when the Java Agent is loaded by the JVM. In this case, it simply prints "Hello World!" to the console.
To use this Java Agent, you would first need to compile the class and package it into a JAR file. Then, you would specify the JAR file using the -javaagent command-line argument when running your Java application. Here's an example command to run a "Hello World" application with the Java Agent:
java -javaagent:HelloWorldAgent.jar HelloWorldThis command assumes that you have compiled the HelloWorldAgent class and packaged it into a JAR file named HelloWorldAgent.jar, and that you have a HelloWorld class with a main method that prints "Hello World!" to the console.
When you run the above command, the JVM will load the Java Agent specified by the -javaagent argument before executing the HelloWorld class. In this case, the Java Agent simply prints "Hello World!" to the console before the HelloWorld class is executed.
While this example is very simple, you could use the premain method to do more sophisticated things, like instrumenting classes to collect data on their behavior, or modifying class bytecode to inject custom behavior into the application. Java Agents can be a powerful tool for profiling, debugging, and monitoring Java applications.
Profiling CPU Usage with Java Agents
Here's an example implementation of profiling CPU usage with Java Agents:
public class MyAgent {
    private static ThreadMXBean threadMXBean = ManagementFactory.getThreadMXBean();
    private static long lastThreadCpuTime = 0;
    private static long lastTimestamp = 0;

    public static void premain(String args, Instrumentation inst) {
        // register a shutdown hook to report CPU usage on JVM exit
        Runtime.getRuntime().addShutdownHook(new Thread(() -> {
            long totalCpuTime = 0;
            for (long threadId : threadMXBean.getAllThreadIds()) {
                totalCpuTime += threadMXBean.getThreadCpuTime(threadId);
            }
            double cpuUsage = (totalCpuTime - lastThreadCpuTime) / (double) (System.currentTimeMillis() - lastTimestamp);
            System.out.println("CPU Usage: " + cpuUsage);
        }));

        // start a background thread to periodically update the CPU usage
        ScheduledExecutorService executor = Executors.newSingleThreadScheduledExecutor();
        executor.scheduleAtFixedRate(() -> {
            long totalCpuTime = 0;
            for (long threadId : threadMXBean.getAllThreadIds()) {
                totalCpuTime += threadMXBean.getThreadCpuTime(threadId);
            }
            lastTimestamp = System.currentTimeMillis();
            double cpuUsage = (totalCpuTime - lastThreadCpuTime) / (double) (lastTimestamp - lastThreadCpuTime);
            lastThreadCpuTime = totalCpuTime;
            System.out.println("CPU Usage: " + cpuUsage);
        }, 0, 1, TimeUnit.SECONDS);
    }
}
This Java Agent implements the premain method, which is called when the agent is loaded by the JVM. It registers a shutdown hook to report the CPU usage of the application on JVM exit, and it starts a background thread to periodically update the CPU usage and print the results to the console.
The ThreadMXBean interface is used to measure the CPU usage of threads in the JVM. The getAllThreadIds method is called to get the IDs of all threads in the JVM, and the getThreadCpuTime method is called to get the CPU time of each thread. These values are aggregated to calculate the total CPU time used by the application since the last update.
The lastThreadCpuTime and lastTimestamp variables are used to store the values from the last update, so that the CPU usage can be calculated based on the difference between the current and previous values.
In this example, the CPU usage is printed to the console every second, but you could modify the code to report the results to a monitoring system or write them to a file for further analysis.
Java Profiling Tools
- VisualVM: A free tool that comes with the JDK and offers a variety of profiling capabilities, including CPU, memory, and thread profiling. It has a user-friendly interface and can be extended with plugins.
- YourKit: A commercial profiling tool that offers deep profiling, memory leak detection, thread dump analysis, and more. It has low overhead and provides support for the profiling of enterprise-level applications.
- JProfiler: A commercial profiling tool that offers CPU, memory, and thread profiling, as well as a heap walker for analyzing object allocation. It has low overhead and provides support for the profiling of enterprise-level applications.
- Java Flight Recorder: A tool with the JDK that offers continuous profiling with low overhead. It can be used to analyze applications in production environments and support profiling enterprise-level applications.
- JMC (Java Mission Control): A tool that comes with the JDK and offers profiling and diagnostic tools, including CPU, memory, and thread profiling. It has low overhead and provides support for the profiling of enterprise-level applications.
Profiling Techniques with Java Agents
Java agents provide several profiling techniques that can be used to measure the performance and behavior of Java applications. These techniques include:
- Method profiling: This involves adding timing code to each method in the application using Java agents to determine which methods are taking the most time to execute. This information helps developers identify performance bottlenecks and optimize the application's performance.
- Memory profiling: This involves tracking the creation and destruction of objects and the amount of memory used by each object to identify memory leaks and optimize the application's memory usage.
- Thread profiling: This involves measuring the behavior of threads in the application to identify synchronization issues and optimize the application's threading behavior.
- Code coverage profiling: This involves tracking the execution of each line of code in the application to identify code that is not being executed and optimize the application's code coverage.
These techniques are valuable for gaining insights into the behavior and performance of Java applications. By using Java agents to implement them, developers can collect profiling data without altering the application's source code, simplifying the process of profiling and optimizing complex applications.
Conclusion
A JAR file is used to deploy an agent after it has been generated. The agent class that will be loaded to launch the agent is specified by the property in the manifest file. It should be noted that there are other ways to launch an agent, including via the command line, during runtime, and as JAR executables. In this blog, we have used the common line method.
Java agents can be used for a variety of purposes, including aspect-oriented programming (AOP), mutation testing, profiling, and other techniques. AOP often extends a current program without changing the code by adding behavior like logging or security. It manipulates the bytecode using Java agents and works in tandem with the program as a whole.
The profiler's task is to keep track of JVM-level variables such as object creation, trash collection, thread execution, and so on. Java agents are heavily utilized by profiling tools for analyzing the JVM execution parameters of a program.
The Java Instrumentation API contains Java agents. The Instrumentation APIs offer a way to change the method bytecodes. Both static and dynamic methods are available for doing this. This implies that we can modify a program by adding code to it without modifying the program's source code. The outcome may significantly affect how the application behaves in general.
Monitor your Java application for errors & exceptions with Atatus
Atatus offers a comprehensive set of features with Java performance monitoring that allow you to identify and diagnose errors quickly and efficiently. With Atatus, you can track every exception, error, and performance issue that your application encounters, and you can receive real-time notifications when something goes wrong.
With Atatus, you can monitor key performance indicators (KPIs) such as response times, throughput, and error rates. This enables you to detect performance degradation before it becomes a problem for your users and ensure that your application is always running at peak performance.
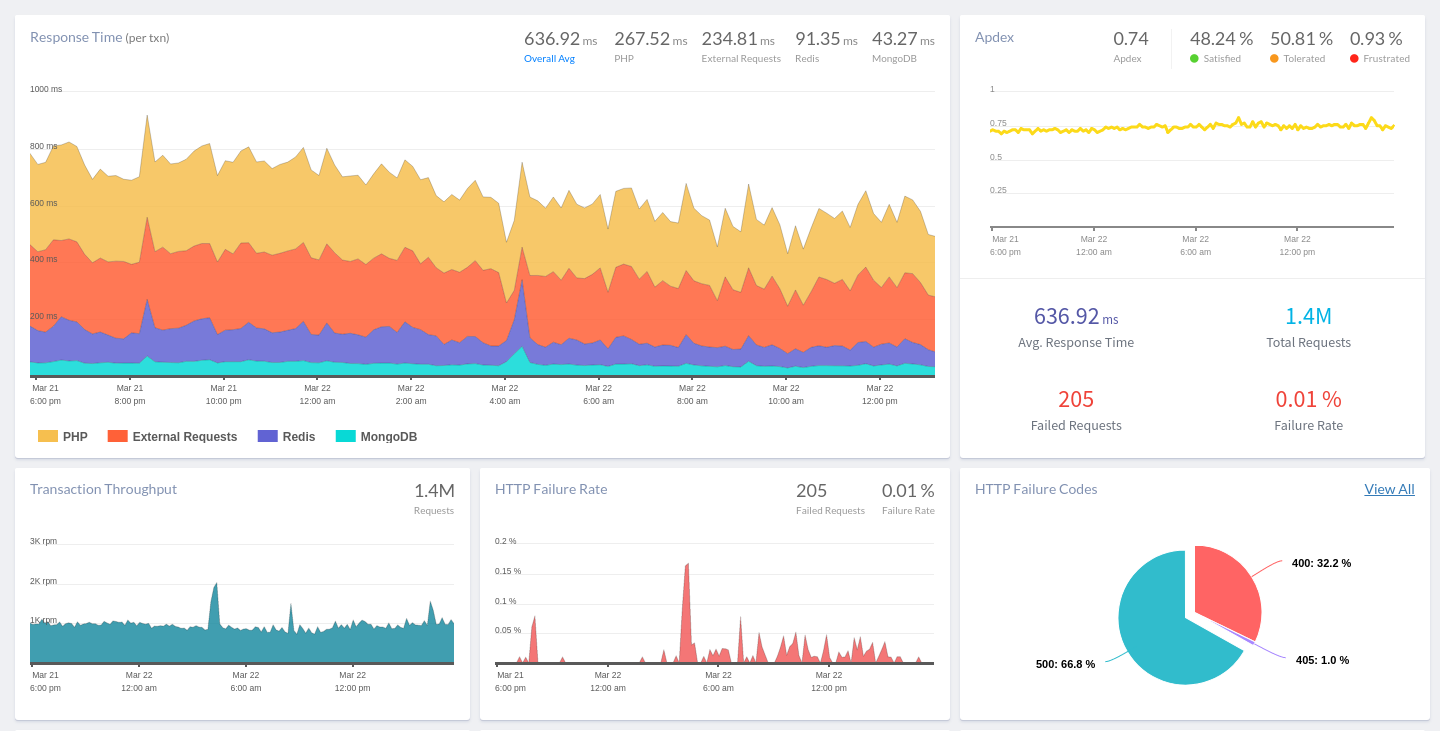
Atatus also provides an intuitive and user-friendly interface that enables you to track and analyze your application's performance over time. You can identify trends and patterns in your application's behavior and use this information to optimize your code for better performance.
If you are not yet a Atatus customer, you can sign up for a 14-day free trial .
#1 Solution for Logs, Traces & Metrics
![]() APM
APM
![]() Kubernetes
Kubernetes
![]() Logs
Logs
![]() Synthetics
Synthetics
![]() RUM
RUM
![]() Serverless
Serverless
![]() Security
Security
![]() More
More