Grafana vs Graphite: A Comparison for Data Visualization and Analysis
Data generation today is at an unprecedented level, and we are generating an inexhaustible amount of data. As a matter of fact, more data has been created over the past two years than ever before in the history of mankind.
This throws a big complexity in front of us. How do we even manage such a huge amount of data? Where do we store them? Can they be segregated to fit into our needs, who would do that for us, and so on! The questions are endless, and so is the rate of generation of new data.
To our rescue, DevOps admins have come up with analytical tools that help us manage this quantum of data. They have given us intelligent monitoring solutions that not only secure but also give us pointers on how to move forward with their analysis.
This necessitates us to consider two such uber-cool applications developed by Chris Davis and Torkel Odegaard - Graphite and Grafana, respectively.
Let's look at the following:-
Graphite
Graphite is an open-source data analytics and visualization platform that allows users to store, retrieve, and visualize time-series data. It was originally developed by Chris Davis at Orbitz in 2006 and has since become a popular tool for monitoring and analyzing systems performance data.
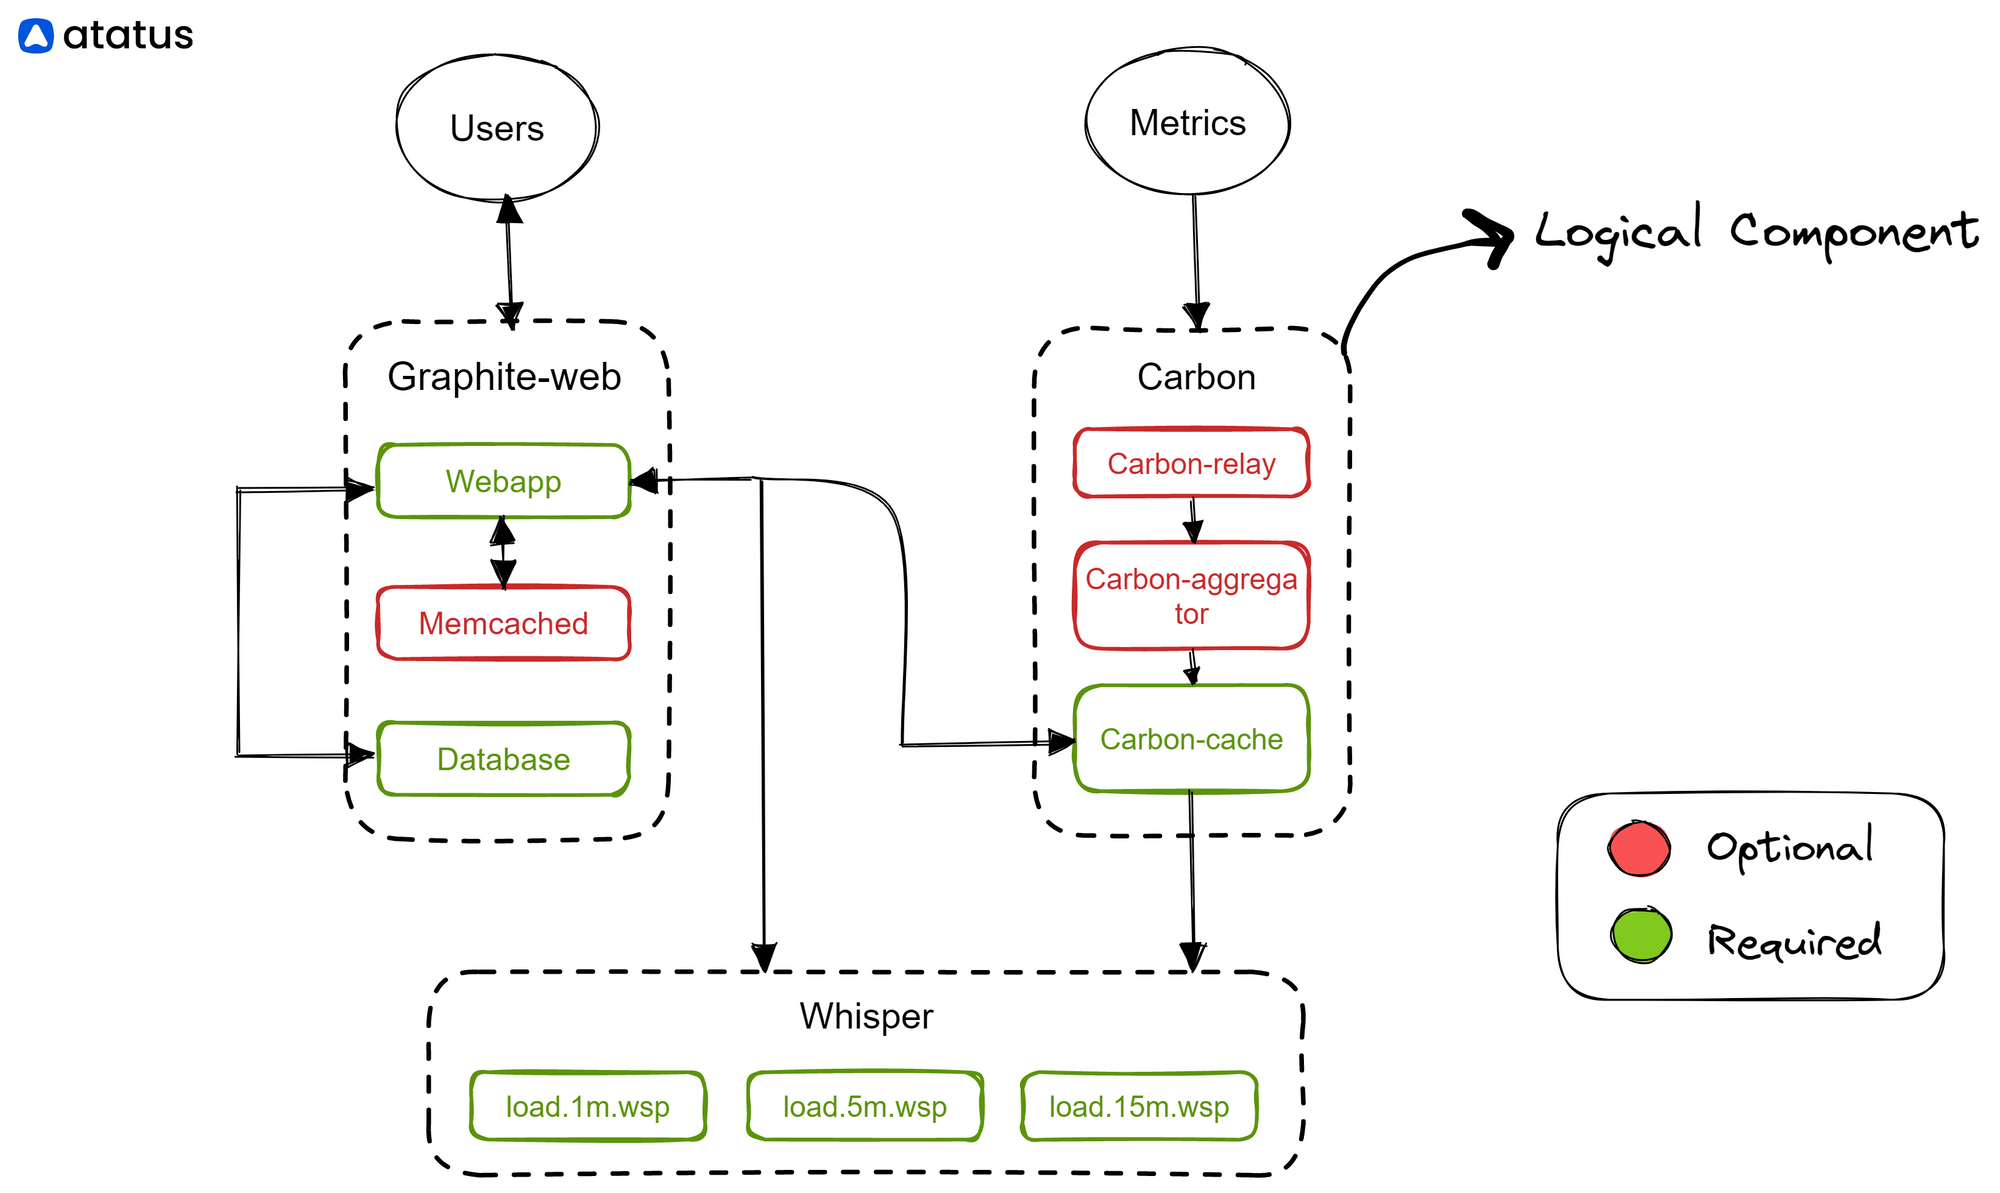
At its core, Graphite consists of three main components: a data source, a storage backend, and a web application for querying and visualizing data. The data source can be any application or system that generates time-series data, such as network devices, servers, or custom applications. Graphite provides several libraries and APIs for ingesting this data, including the Carbon daemon, which can accept data via a variety of protocols such as UDP, TCP, and AMQP.
Once data has been ingested, Graphite stores it in a time-series database that is optimized for fast querying and storage of time-series data. By default, Graphite uses the Whisper database format, which is a simple binary file format that supports efficient data compression and aggregation.
Finally, Graphite provides a web application that allows users to query and visualize the data stored in the time-series database. The web application includes several built-in tools for graphing and analyzing data, including a powerful query language called Graphite Query Language (GQL). GQL allows users to filter and aggregate data based on a variety of criteria, including time range, metric name, and tag values.
In addition to the core components, Graphite also supports a wide range of plugins and extensions that can be used to extend its functionality. For example, the Grafana plugin allows users to use Graphite as a data source for the popular Grafana dashboarding tool, while the Statsd plugin provides a simple way to send metrics to Graphite from custom applications.
Grafana
Grafana is a powerful open-source data visualization platform created by Torkel Ödegaard in 2014.
With its front-end written in Typescript and a Golang back-end, this data monitoring platform allows users to create and share interactive and dynamic dashboards with custom charts and panels using data from various sources, including InfluxDB, Prometheus, Elasticsearch, and many others.
Template variables are also available as dropdown options to create dynamic and reusable dashboards.
As its default database, Grafana uses a time-series database rather than an Online Analytical Processing engine (OLAP). As a result, it is ideal for IT metrics like server uptime and API latency but less suitable for business metrics that require cutting data into segments like customer segments, product categories, and zip codes.
Grafana has become increasingly popular in recent years. It allows users to create interactive, customizable dashboards that display real-time data from a variety of sources. Let's take a look at some of the coolest applications of Grafana.
Grafana is a versatile and powerful data visualization and monitoring platform that has a wide range of applications across many different industries. By providing real-time insights into data from a variety of sources, Grafana helps organizations improve efficiency, reduce costs, and optimize performance.
Let's see how Grafana works in different settings:
#1 DevOps Monitoring and Visualization
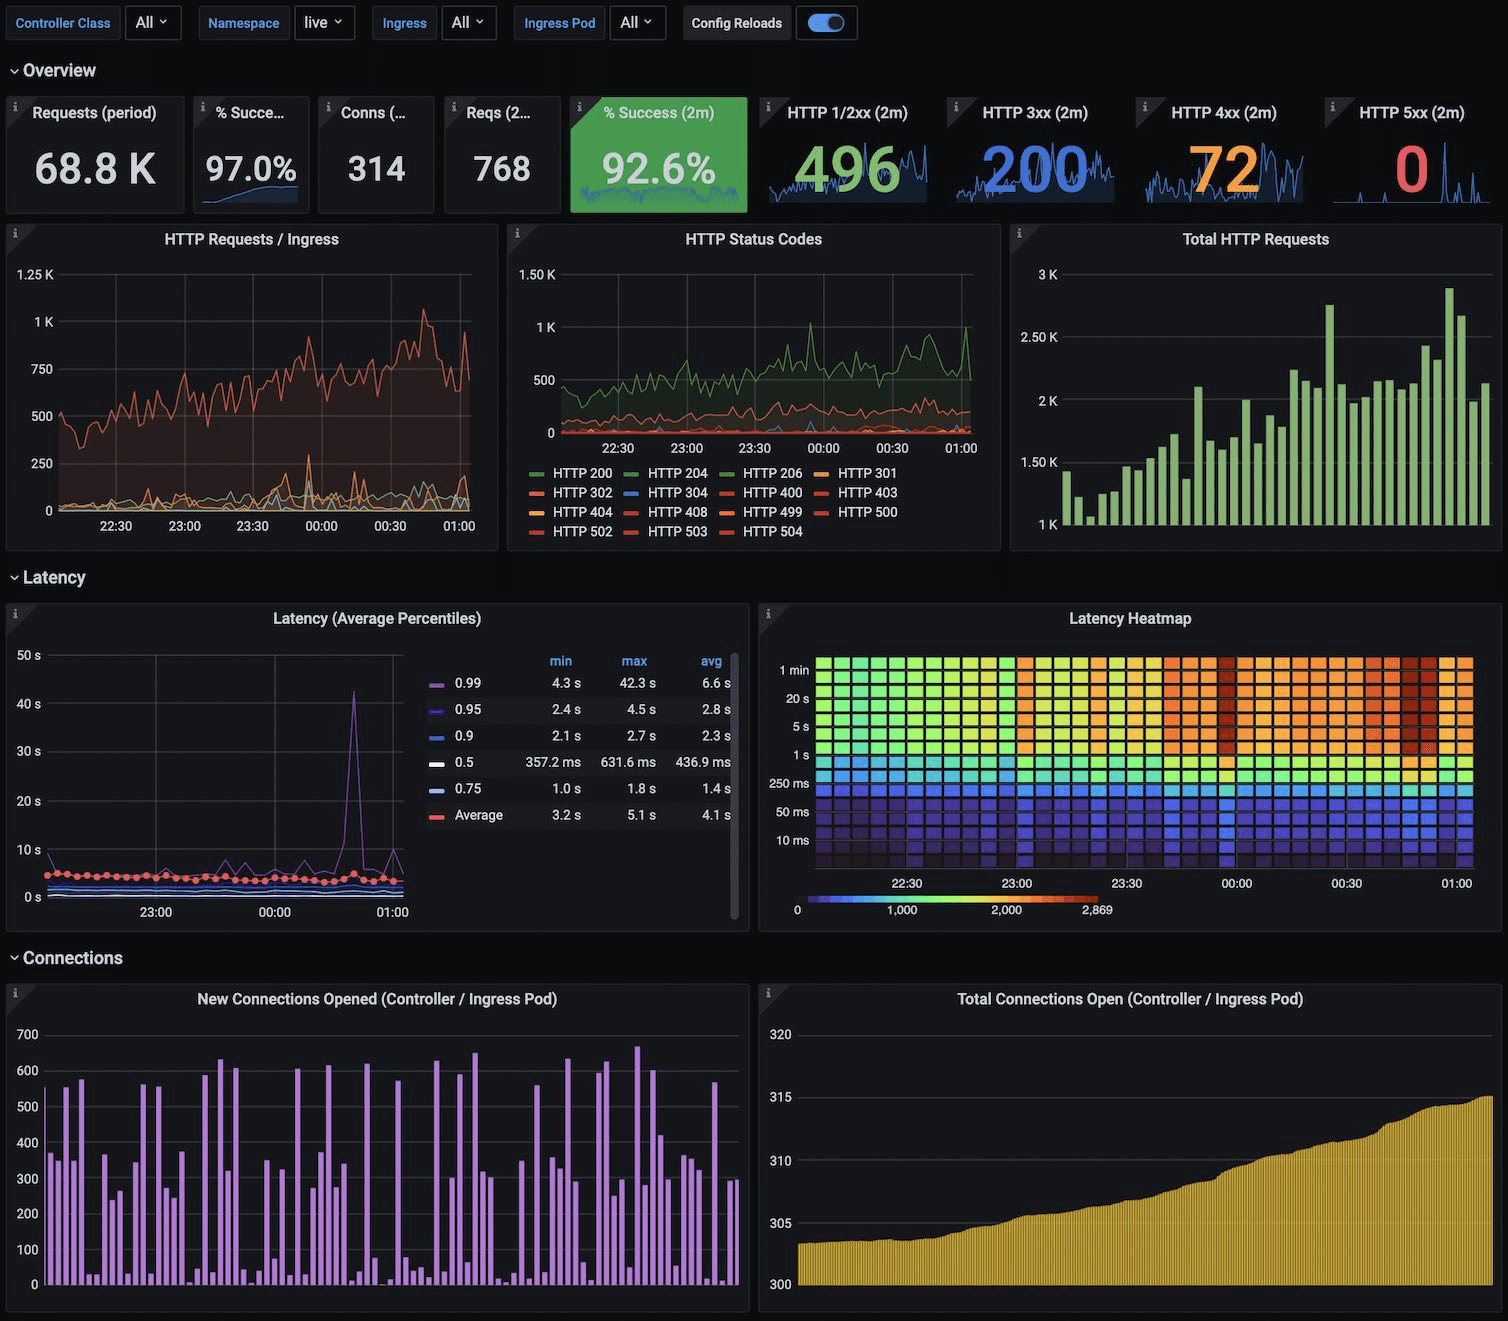
Grafana is often used in DevOps environments to monitor and visualize data from a variety of sources, including logs, metrics, and traces. By creating customized dashboards, developers and operations teams can quickly identify issues and take corrective action, improving the speed and reliability of their applications. For example, a dashboard might display data on application response time, error rates, and database performance, allowing developers to quickly identify issues and optimize performance.
#2 IoT and Smart Home Monitoring
Grafana can be used to monitor and visualize data from a variety of IoT devices and smart home systems. For example, it can be used to monitor the temperature and humidity in a smart home, or to track energy usage in a commercial building. By creating customized dashboards, users can easily track and analyze data in real-time, making it easier to identify trends and potential issues.
#3 IT Infrastructure Monitoring
Grafana is also widely used in IT infrastructure monitoring, where it can be used to monitor everything from network traffic to server performance. By aggregating data from multiple sources, users can quickly identify issues and take corrective action. For example, a dashboard might display data on CPU and memory usage, network latency, and disk space, allowing administrators to identify potential bottlenecks or capacity issues.
#4 Industrial Automation and Control
Grafana is also used in industrial automation and control systems, where it can be used to monitor and control a wide range of processes, from manufacturing to energy production. By creating customized dashboards, users can easily monitor key performance indicators, track trends, and identify potential issues. For example, a dashboard might display data on temperature, pressure, and flow rates, allowing operators to quickly identify issues and adjust settings as needed.
Graphite vs. Grafana
Let's now move on to the head-to-head comparison between these two application tools.
#1 Configuration:
Graphite
Graphite is primarily configured using text-based configuration files. This can make it more challenging to manage large numbers of metrics and dashboards, as changes must be made directly to the configuration files.
Graphite is typically configured using text-based configuration files. Here's a brief overview of the different ways to configure Graphite:
The main configuration file for Graphite is usually located at /etc/graphite/local_settings.py on Unix-based systems.
The configuration file is written in Python and contains settings such as the database backend, the location of the Graphite web application, and authentication settings. Additional configuration files can be used to configure data retention policies, carbon caches, and other settings. Configuration files can be edited using a text editor, such as nano or vi.
Graphite also supports configuration through environment variables. Environment variables can be used to set settings such as the database backend, the Graphite web application location, and the logging level. Environment variables can be set using a command-line interface or a process manager, such as systemd or upstart.
Graphite does not have a built-in API for configuration, but third-party tools such as Graphite-API can be used to provide API access to Graphite data. Graphite-API provides a RESTful API for querying and retrieving data from Graphite, as well as for configuration and management tasks. The API can be used to create and update data retention policies, configure carbon caches, and other tasks.
Grafana
Grafana, on the other hand, is primarily configured through its web interface. This can make it easier to manage large numbers of metrics and dashboards, as changes can be made through a user-friendly interface.
The Grafana web interface is the most common way to configure Grafana. It provides a user-friendly way to configure data sources, dashboards, alerts, and other settings.
To access the Grafana web interface, open a web browser and navigate to the Grafana URL (usually http://localhost:3000). Once logged in, you can use the menu on the left-hand side of the screen to access the different configuration options.
Grafana can also be configured using configuration files, which are typically stored in the /etc/grafana/ directory. The main configuration file is called grafana.ini and contains global settings for Grafana, such as the server port and database connection details.
Additional configuration files can be used to configure data sources, dashboards, and other settings.
Grafana also provides a RESTful API that can be used to programmatically configure Grafana.
The API can be used to create data sources, dashboards, users, and other objects, as well as update and delete them. API requests can be made using HTTP or HTTPS, and can be authenticated using an API key or username and password.
#2 Integration:
The integration options for Graphite primarily consist of plugins and extensions that enable integration with other data sources, such as StatsD and collectd. These plugins can be configured through the Graphite web interface and facilitate the collection and processing of data from various sources.
In contrast, Grafana provides a wide range of integration options by default, including support for multiple data sources such as Graphite, InfluxDB, Elasticsearch, and Prometheus, as well as support for popular notification channels and authentication providers.
Grafana's integration capabilities can also be extended through its library of plugins and extensions.
#3 Querying:
Both Graphite and Grafana enable the querying of data for visualization and analysis, although they differ in how queries are constructed and executed.
Graphite utilizes its proprietary Graphite Query Language (GQL), which is based on regular expressions and allows users to create complex queries using wildcards and pattern matching. Additionally, GQL provides various data transformation and aggregation functions, such as scaling, averaging, and summing.
On the other hand, Grafana supports multiple query languages, including GQL, and offers built-in support for other languages, such as SQL, Prometheus Query Language (PQL), and Elasticsearch Query Language (EQL). Furthermore, the query editor in Grafana is highly user-friendly, enabling users to construct queries by selecting data sources, defining filters and aggregations, and previewing results in real-time.
Graphite's GQL offers a potent and adaptable language for constructing complex queries. In contrast, Grafana offers a more diverse and user-friendly approach to querying, providing support for multiple languages and an intuitive query editor.
#4 Data sources and data ingestion methods:
Both Graphite and Grafana have different approaches to data ingestion and data sources. Graphite primarily uses its proprietary Carbon protocol, which is based on a plaintext protocol, to ingest data. This protocol allows clients to send timestamped data in a simple format, which is then stored in Graphite's database. Although Graphite also supports other data sources such as collectd, StatsD, and custom protocols.
In contrast, Grafana supports a wider range of data sources such as Graphite, InfluxDB, Elasticsearch, Prometheus, MySQL, and others. Each data source has its own specific ingestion method such as a REST API, a database query, or an agent-based approach. Grafana allows users to configure and manage their data sources through its web interface and also provides the option to define custom data sources.
Although Graphite has a more limited set of data sources and relies heavily on the Carbon protocol for data ingestion, Grafana offers a more diverse range of options for data sources and ingestion methods, making it a more flexible and adaptable tool for data visualization and analysis.
#5 Dashboard creation and customization:
Graphite has a user-friendly web interface for creating and editing dashboards composed of graphs. The graphs are built by selecting data sources and applying functions and parameters to them. The graphing functions are flexible and allow for customizations such as setting time ranges, adjusting scales, and changing colors.
In contrast, Grafana takes dashboard creation and customization to a whole new level with its intuitive and user-friendly web interface. Users can create dashboards by dragging and dropping visual components like panels, rows, and columns, and then configuring them using a rich set of options.
Grafana's visualizations are highly customizable, and users can choose from a wide range of chart types, including line, bar, pie, and many others. It also provides an extensive library of plugins and extensions to enhance its visualization capabilities.
Graphite offers a simple and straightforward approach to dashboard creation and customization, while Grafana provides a more powerful and flexible toolset for building and configuring custom dashboards.
#6 Notifications and alerts:
Graphite does not have a built-in alerting solution like Grafana. However, it can integrate with other open-source tools like Graphite-beacon and Graphite-alerts to provide threshold-breach alerts.
Grafana on the other hand has a built-in alerting system that communicates with collaborators and on-call management tools. Webhook allows systems to register to Grafana alerts which generates a push notification when a predefined event occurs.
#7 Community support and third-party integrations:
Both Graphite and Grafana have active communities that provide support and contribute to their development. However, the community of Grafana is larger and more active, as evidenced by its extensive documentation, forums, and user groups.
Grafana also offers a broader range of third-party integrations, with a large number of plugins and extensions available from its community and other sources. These integrations include support for various data sources, visualization tools, alerting mechanisms, and more.
Graphite's community, on the other hand, is more focused on its core functionality, and may have fewer third-party integrations available. However, Graphite is well-known for its reliability and stability in time-series data storage and analysis, which has made it a popular choice for many organizations.
An Alternative to Graphite and Grafana - Atatus
Atatus is an all-in-one performance monitoring and error tracking platform that provides real-time visibility into the performance of web and mobile applications. Unlike Graphite and Grafana, Atatus does not require any setup or configuration and provides a simple and intuitive interface for monitoring and analyzing application performance.
With Atatus, users can take advantage of real-time performance metrics, transaction traces, and error tracking features to troubleshoot performance issues. Atatus also provides a dashboard that gives a centralized view of application performance and allows users to quickly identify and resolve problems.
In addition to its monitoring capabilities, Atatus offers various collaboration and integration features, including support for popular chat tools like Slack and HipChat, and integration with development tools such as GitHub and Jira.
Atatus is an excellent alternative to Graphite and Grafana for monitoring and analyzing application performance. Its real-time monitoring capabilities and all-in-one platform make it a popular choice for businesses of all sizes.
Here are some of the features offered by Atatus:
- Real-time application performance monitoring
- End-to-end transaction tracing
- Error and exception tracking
- Automatic issue detection and alerting
- Code-level performance insights
- Integration with popular development and collaboration tools
- User session monitoring
- Advanced reporting and analytics
- SSL encryption for data security
- Role-based access control for team collaboration.
Summing Up!
Graphite is a powerful and flexible tool for monitoring and analyzing time-series data. Its open-source nature and extensive plugin ecosystem make it a popular choice for organizations of all sizes, from small startups to large enterprises.
But Grafana’s visualization capabilities are far beyond that of Graphite. And also, since it is a metric tracking system as well, the problem of integrating a separate metric tracker for analysis gets sorted out.
While both Grafana and Graphite have their own strengths and weaknesses regarding configuration, integration, querying, visualization, and alerts, they can be combined to provide a powerful end-to-end monitoring and visualization solution.
Integrating Graphite and Grafana provides a powerful solution for all your monitoring needs. By combining the data collection and storage capabilities of Graphite with the flexible visualization and dashboarding capabilities of Grafana, you can gain insights into your data and make informed decisions about your systems and applications.
Monitor Your Entire Application with Atatus
Atatus is an Observability Platform that lets you review problems as if they happened in your application. Instead of guessing why errors happen or asking users for screenshots and log dumps, Atatus lets you replay the session to quickly understand what went wrong.
We offer Application Performance Monitoring, Real User Monitoring, Server Monitoring, Logs Monitoring, Synthetic Monitoring, Uptime Monitoring and API Analytics. It works perfectly with any application, regardless of framework, and has plugins.

Atatus can be beneficial to your business, which provides a comprehensive view of your application, including how it works, where performance bottlenecks exist, which users are most impacted, and which errors break your code for your frontend, backend, and infrastructure.
If you are not yet a Atatus customer, you can sign up for a 14-day free trial .
#1 Solution for Logs, Traces & Metrics
![]() APM
APM
![]() Kubernetes
Kubernetes
![]() Logs
Logs
![]() Synthetics
Synthetics
![]() RUM
RUM
![]() Serverless
Serverless
![]() Security
Security
![]() More
More