Prometheus vs. Elasticsearch
In the field of data management, Prometheus and Elasticsearch are popular names. They have proved to be quite effective when coming to monitoring applications and websites and providing reliable feedback.
While Prometheus offers metrics monitoring at a good level, Elastic Stack is a comprehensive platform offering complete collection, storage, and analysis of data from start to finish. This and a few other minor differences sets these two monitoring solutions apart.
Also, with the advent of several new tools in the market, going beyond the conventional tools like these too, hold good water! For example, there are premium observability solutions like Atatus which offer comparably better performance at highly affordable rates. Trying them out is advisable.
For now, I’ll be focussing majorly on Prometheus and Elasticsearch, and their features and drawbacks, along with some real-world use cases. Then we will check out an alternative tool to both of these by the end of this blog.
Table Of Contents:
- Prometheus: Overview and Features
- Elasticsearch: Overview and Features
- Comparing Prometheus vs. Elasticsearch
- Best Use Cases of Prometheus and Elasticsearch
- Atatus - A Better Alternative to Prometheus and Elasticsearch
Prometheus: Overview and Features
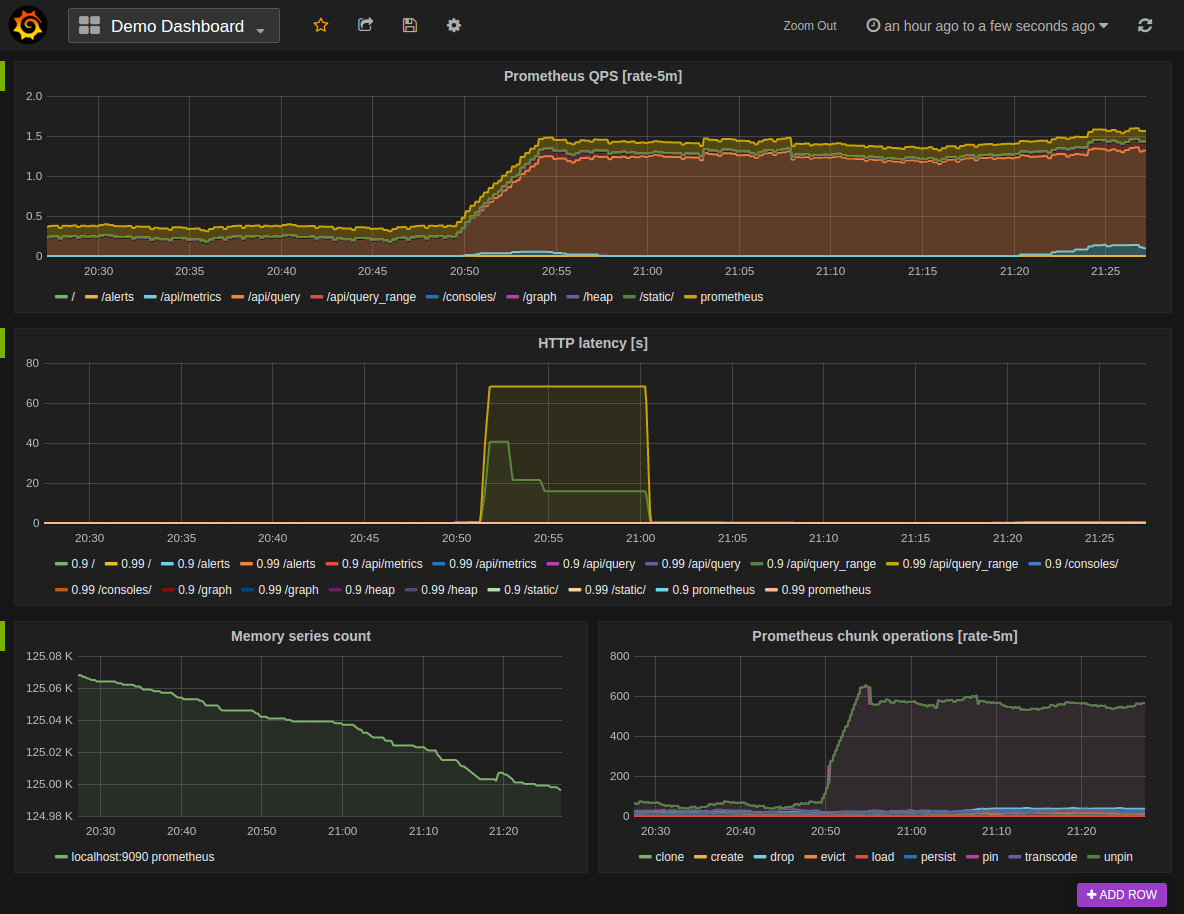
Prometheus Monitoring System
Prometheus is an open-source monitoring and alerting toolkit originally built at SoundCloud and now a part of the Cloud Native Computing Foundation (CNCF).
It is designed to monitor systems and services, collect metrics from diverse sources, store them, and enable querying and analysis to gain insights into the performance and health of applications and infrastructure.
Feature Highlights of Prometheus
- Pull-based data collection model
- Metrics stored as time-series data
- Usage of PromQL for querying
- Supports Dynamic Service Discovery
- Built-in alerts and integration features
- Horizontal scalability through Federation
Prometheus collects metrics data by scraping HTTP endpoints exposed by monitored targets. This pull-based model simplifies deployment and allows Prometheus to efficiently collect data from various sources.
Metrics collected by Prometheus are stored as time-series data, consisting of metric names and key-value pairs called labels. This enables efficient storage and querying of historical data for monitoring and analysis purposes.
Prometheus Query Language (PromQL) is a powerful functional query language tailored for time-series data. It allows users to perform complex operations such as aggregations, transformations, and filtering to extract insights from monitored systems.
Prometheus supports dynamic service discovery mechanisms, enabling it to automatically detect and monitor new instances of services as they are deployed or scaled. This makes it well-suited for containerized environments like Kubernetes.
Prometheus includes a built-in alerting system that allows users to define alerting rules based on PromQL expressions. When certain conditions are met, Prometheus can send alerts to various notification channels via integrations with alert managers like Alertmanager.
Prometheus supports horizontal scalability through federation. Multiple Prometheus servers can be federated to collect and aggregate metrics data from different clusters or regions, enabling scalability and high availability.
Also, we must note that Prometheus integrates seamlessly with Grafana, a popular visualization tool, for creating customizable dashboards and graphs. Grafana allows users to visualize metrics collected by Prometheus and create informative dashboards for monitoring and analysis.
Drawbacks with Prometheus
- Long-Term Storage: Prometheus is optimized for real-time monitoring and alerting but may not be suitable for long-term storage of metrics data. While Prometheus supports local storage, it lacks built-in support for distributed or long-term storage solutions.
- Complexity of Setup: Setting up Prometheus and configuring service discovery, alerting rules, and data retention policies can be complex, especially for users new to monitoring and DevOps practices.
- Resource Consumption: Depending on the number of targets and the frequency of data scraping, Prometheus can consume significant CPU and memory resources. Administrators need to carefully manage resource allocation to ensure optimal performance.
- Limited Log Management: While Prometheus can capture logs, it lacks advanced log management and analysis capabilities compared to dedicated log management solutions like ELK (Elastic Stack). Users may need to integrate Prometheus with other tools for comprehensive log management.
- Scaling Challenges: While Prometheus can scale horizontally through federation, managing large-scale deployments with thousands of targets may require additional effort and infrastructure resources.
Elasticsearch: Overview and Features
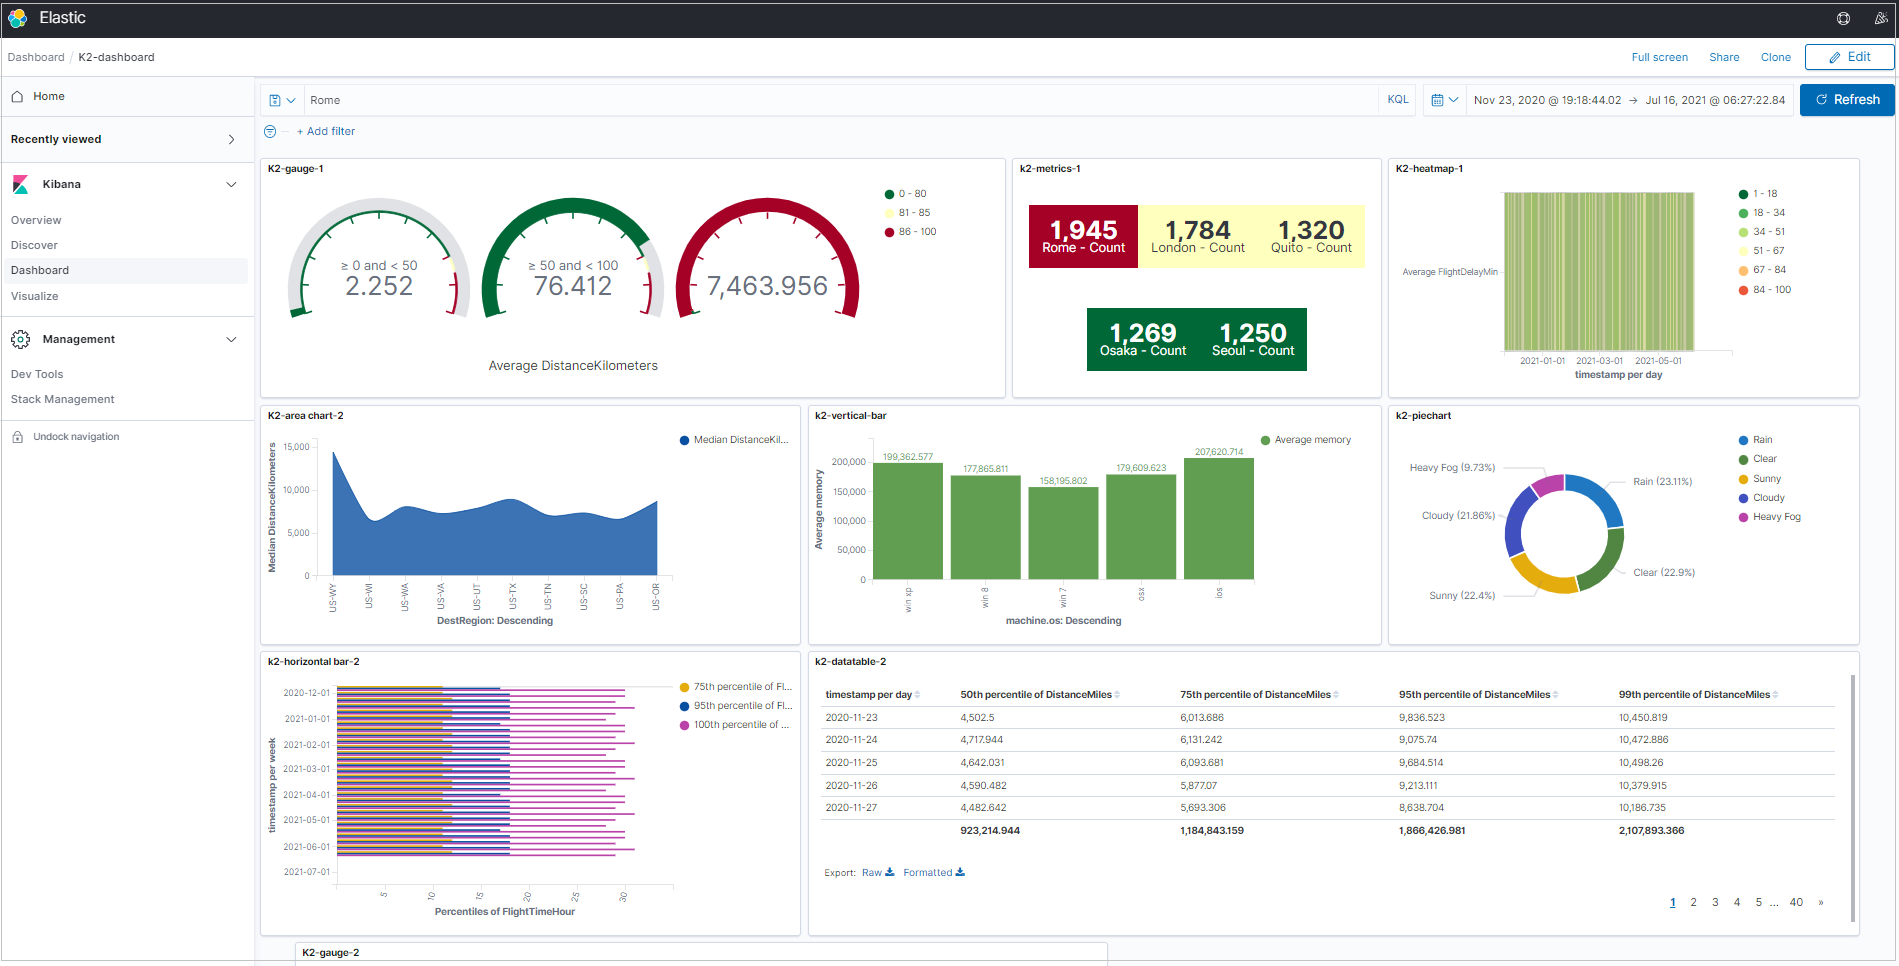
Elastic Stack: Elasticsearch, Logstash & Kibana
Elasticsearch is a distributed, RESTful search and analytics engine built on top of Apache Lucene. It is designed to handle large-scale data processing tasks such as real-time search, log analysis, and full-text search.
Elasticsearch is part of the Elastic Stack (formerly known as ELK Stack), which includes Logstash for log data collection and processing, and Kibana for data visualization and exploration.
Logstash transforms data collected from various sources before sending it to elasticsearch for indexing and analysis. Users can enrich, parse and transform data into any form using the various plug-ins available.
The collected data can then be fed into kibana to produce customizable dashboards. Kibana supports features such as data filtering, aggregation, and drill-down capabilities which make interpreting these data more easier.
Elastic Stack also has a Beats application, which are lightweight data shippers that collect data from servers etc and send it to logstash or easticsearch. Beats come in different flavors tailored for specific use cases, including Filebeat for log files, Metricbeat for system and application metrics, Packetbeat for network traffic analysis, and Auditbeat for audit data collection.
Feature Highlights of Elastic Stack
- Distributed Architecture - scaling horizontally is easier
- Indexes data in near real-time
- Stores data in the form of JSON, making schema more flexible
- Supports aggregations
- Exposes RESTful API for easier interaction with other system components
Elasticsearch is built with a distributed architecture, allowing it to scale horizontally across multiple nodes in a cluster. This enables high availability, fault tolerance, and efficient data processing across large datasets.
Elasticsearch provides powerful full-text search capabilities, making it ideal for applications that require fast and accurate search functionality. It supports various query types, including match queries, phrase queries, wildcard queries, and fuzzy queries.
Similarly, Elasticsearch indexes data in near real-time, enabling users to search and analyze newly ingested data within seconds of its arrival. This makes Elasticsearch well-suited for use cases requiring real-time analytics and monitoring.
Elasticsearch stores data in the form of JSON documents, allowing for flexible schema design and dynamic mapping. This way users can index and search structured, semi-structured, and unstructured data without the need to define a rigid schema upfront.
Elasticsearch is designed to scale horizontally by adding more nodes to the cluster. It automatically distributes data and query processing across nodes, enabling seamless scalability to handle large volumes of data and high query loads.
Elasticsearch supports aggregations, enabling users to perform complex analytics and statistical calculations on indexed data. Aggregations can be used to compute metrics, generate histograms, and analyze trends within datasets.
Elasticsearch exposes a RESTful API for interacting with the system, allowing users to perform CRUD (Create, Read, Update, Delete) operations, execute search queries, and manage cluster settings programmatically.
Drawbacks with Elastic Stack
- Complexity of Configuration: Setting up and configuring Elasticsearch clusters can be complex, especially for users new to distributed systems and search technologies. Users need to understand concepts such as node roles, shard allocation, and cluster settings to optimize performance and reliability.
- Data Sharding Overhead: Elasticsearch distributes data across multiple shards to achieve horizontal scalability. While sharding improves performance and parallelism, it adds complexity to data management, especially when rebalancing shards or managing uneven data distribution.
- Data Durability: By default, Elasticsearch relies on data replication for fault tolerance, which can impact storage overhead and performance. While Elasticsearch provides options for data durability and resilience, users need to carefully configure replication settings based on their requirements.
- Learning Curve: Learning to use Elasticsearch effectively requires understanding its data model, query language, indexing strategies, and cluster management concepts. Users may need to invest time and effort in training and experimentation to become proficient with Elasticsearch.
- Security and Access Control: Elasticsearch provides basic security features such as role-based access control (RBAC) and TLS encryption, but more advanced security capabilities require the use of commercial plugins or additional components. Implementing and managing security policies in Elasticsearch clusters can be challenging.
Comparing Prometheus vs. Elasticsearch
| Feature | Prometheus | Elasticsearch |
|---|---|---|
| Primary Use Case | Monitoring and alerting system. | Search, analytics, and logging solution. |
| Data Model | Time series data model. | Document-oriented data model. |
| Query Language | PromQL (Prometheus Query Language). | Elasticsearch Query DSL (Domain Specific Language). |
| Scalability | Horizontal scaling with federation support. | Horizontal scaling with sharding. |
| Storage | Local storage with retention policies. | Distributed storage with replication and sharding. |
| Monitoring | Built-in metrics collection and visualization. | Monitoring features available but less emphasis. |
| Alerting | Built-in alerting system with alert manager. | Alerting available through plugins and integrations. |
| Visualization | Basic built-in visualization capabilities. | Integration with Kibana for advanced visualization. |
| Ecosystem | Growing ecosystem with exporters and integrations. | Mature ecosystem with plugins and integrations. |
| Learning Curve | Moderate learning curve, especially for PromQL. | Moderate to steep learning curve, especially for advanced features. |
| Use Cases | Monitoring of infrastructure and applications. | Search and analysis of log data, metrics, and other structured data. |
| Companies Using | SoundCloud, DigitalOcean, GitLab. | Netflix, LinkedIn, eBay. |
i.) Purpose
Prometheus is primarily a monitoring and alerting toolkit designed for reliability and scalability. It specializes in collecting metrics from monitored targets, storing them efficiently, and providing a flexible query language (PromQL) to analyze and visualize the collected data.
While Elasticsearch is a distributed, RESTful search and analytics engine designed for horizontal scalability, reliability, and real-time search capabilities. It's commonly used for full-text search, log analysis, and data visualization.
ii.) Data Model
Prometheus uses a pull-based model where Prometheus server scrapes metrics from instrumented applications and services at regular intervals. Metrics are stored as time-series data, with each time series identified by a unique combination of metric name and key-value pairs (labels).
But Elasticsearch utilizes a document-oriented data model based on JSON documents. It stores structured or semi-structured data in the form of documents within indices. Each document represents a single data entry, and indices are collections of documents.
iii.) Query Language
Prometheus offers PromQL (Prometheus Query Language), a powerful functional query language tailored for time-series data. PromQL allows users to perform various operations such as aggregations, filtering, and mathematical operations on metrics data.
While Elasticsearch supports a rich query language based on JSON known as the Query DSL (Domain-Specific Language). It enables users to construct complex queries for searching, aggregating, filtering, and sorting data.
iv.) Scaling
Prometheus is generally better suited for monitoring smaller to medium-sized infrastructures due to its pull-based model. While it supports federation and sharding for scalability, managing large-scale deployments might require additional effort.
Elasticsearch is designed more for horizontal scalability out of the box. It can easily scale to handle large volumes of data and high query loads by adding more nodes to the cluster.
v.) Data Visualization
In Prometheus basic visualization capabilities are provided through tools like Grafana, which integrates seamlessly with Prometheus. Grafana allows users to create customizable dashboards and graphs using data queried from Prometheus.
Elasticsearch offers built-in visualization tools through its Kibana plugin. Kibana provides advanced capabilities for creating interactive dashboards, visualizing log data, and exploring Elasticsearch indices.
vi.) Use Cases
Prometheus is ideal for monitoring containerized environments (e.g., Kubernetes) and microservices architectures. It excels at collecting and alerting on metrics related to system performance, resource utilization, and application health.
Elasticsearch is widely used for log analysis, full-text search, and real-time analytics. Common use cases include log monitoring, security analytics, business intelligence, and application performance monitoring.
vii.) Integration
Prometheus integrates well with various monitoring tools and frameworks, including Grafana, Alertmanager, and exporters for popular services and platforms while Elasticsearch integrates seamlessly with other components of the Elastic Stack (formerly known as ELK stack), which includes Logstash for log collection and Beats for lightweight data shippers.
While Prometheus and Elasticsearch share some common ground in the realm of monitoring and analytics, they serve distinct purposes and excel in different use cases. Prometheus is well-suited for monitoring and alerting in dynamic environments like container orchestration platforms, while Elasticsearch is geared towards search, analytics, and log management at scale.
Best Use Cases for Prometheus and Elasticsearch
Prometheus Use Cases
- Prometheus integrates seamlessly with Kubernetes for dynamic service discovery and monitoring of containers, pods, and nodes. Many organizations, including companies like SoundCloud and DigitalOcean, have successfully implemented Prometheus for monitoring their Kubernetes environments.
- Companies like eBay use Prometheus for monitoring their e-commerce infrastructure and ensuring high availability during peak shopping seasons.
- Healthcare organizations leverage Prometheus for monitoring electronic health record (EHR) systems, patient portals, and healthcare applications.
- Companies like Netflix use Prometheus for monitoring their streaming infrastructure and optimizing content delivery across global regions.
Elasticsearch Use Cases
- Netflix, Uber and LinkedIn use Elasticsearch Log Managemnet features for taking care of all their logs data.
- Elasticsearch powers faster search function in all applications and websites. E-commerce websites leverage this to provide faster search results.
- Elasticsearch is mostly used for Business Intelligence and analytics platforms to perform ad-hoc queries, aggregations and data visualizations. For example, Kibana, a part of ELK stack itself uses log data from elasticsearch to produce customizable dashboards.
Atatus - A Better Alternative to Prometheus and Elasticsearch
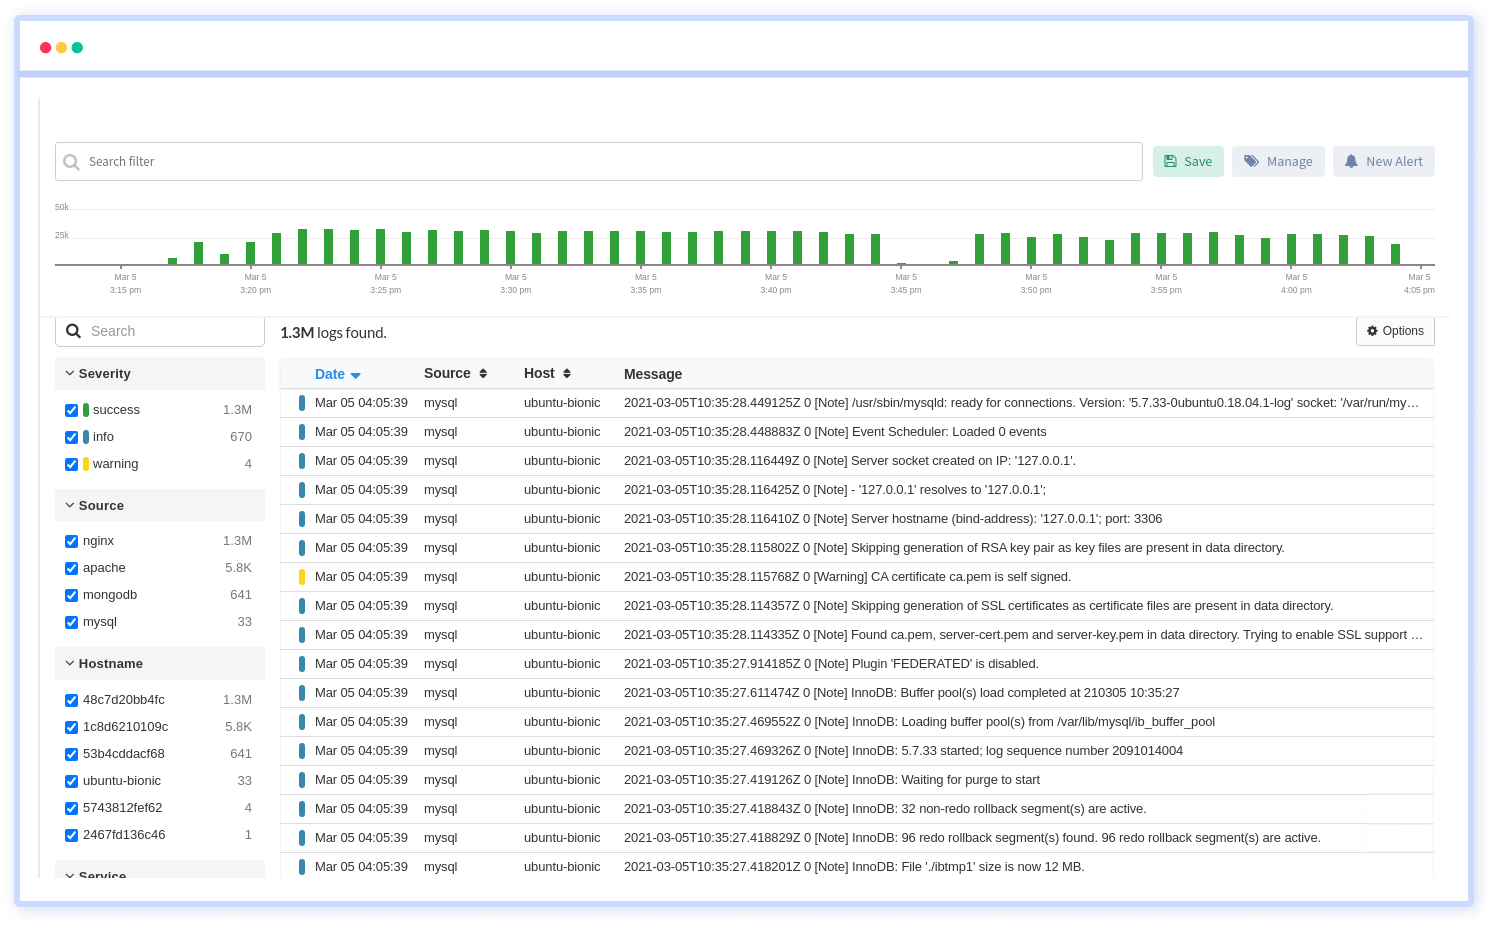
Atatus is a full-stack monitoring and observability platform. As part of its product line, it hosts an incredible Logs Monitoring solution. With its easy-to-set-up and intuitive interface, they capture every minute metrics of your application platform.
The Atatus Logs Monitoring Platform is an independent product featuring centralized logging, live-trails, with APM Integration and controlled logging features. You can install Atatus Logs Monitoring by simply following this link.
It comprehensively collects log data from applications deployed in more than twelve different platforms.
Advantages of Atatus Over Prometheus and Elasticsearch:
- All-in-one platform: Atatus is a comprehensive observability platform that combines monitoring, tracing, and error reporting in one place, eliminating the need for separate tools for visualization.
- Easy installation and setup: Atatus offers easy installation and setup with minimal configuration, making it a more user-friendly alternative to Prometheus and Nagios.
- Real-time monitoring: Atatus provides real-time monitoring of your application performance, with the ability to identify and resolve issues quickly, improving your overall business efficiency.
- Auto-instrumentation: Atatus auto-instruments your application code without requiring any manual configuration, reducing the burden on developers.
- In-depth application insights: Atatus provides deep insights into your application performance, with the ability to trace every transaction end-to-end, from the user interface to the backend systems.
- Intelligent alerting: Atatus offers intelligent alerting with real-time anomaly detection and customizable alerts, allowing you to stay on top of issues before they impact your business.
- Cost-effective: Atatus offers flexible pricing plans based on the number of hosts and applications, making it a cost-effective alternative to Prometheus and Nagios.
Atatus Features
- Application Performance Monitoring: Atatus APM provides deep visibility into the performance of your application's components, including databases, third-party services, and other infrastructure components. It helps identify and resolve issues quickly before they impact your users.
- Real User Monitoring: Atatus provides real-time insights into the performance of web applications by capturing user interactions and measuring response times, page load times, and other critical metrics from the user's perspective.
- Infrastructure Monitoring: Atatus Infrastructure Monitoring provides real-time visibility into the health and performance of your servers, containers, and other infrastructure components. It helps you identify and resolve issues before they impact your users.
- Synthetic Monitoring: Atatus Synthetic Monitoring tests your applications from various locations and devices to simulate real-world user experiences. It helps ensure that your applications perform as expected and provides insights into how users experience your application from different parts of the world.
- Logs Monitoring: Atatus logs monitoring collects and analyzes logs from various sources, including applications, servers, and other infrastructure components. It helps identify real-time errors, performance issues, and other critical events.
- API Analytics: Atatus API Analytics provides insights into your API endpoints' usage, performance, and reliability. It helps you identify issues with your API and optimize its performance for your users.
Conclusion
In this blog, we compared two monitoring platforms against each of their strong features. We found that both Prometheus and Elasticsearch were credible, highly popular monitoring and observability solutions.
But, while Prometheus falls short on long term storage capabilities and scaling problems, Elasticsearch lacks data durability. Elasticsearch offers Sharding which improves data parallelism and performance, but they tend to complicate data management. Plus, learning Elasticsearch thoroughly will require a great deal of effort and time.
That is where Atatus comes in. They provide complete observability into your application at affordable prices, that too with a good track record of happy clients. So trying out alternate options to Prometheus and Elasticsearch will never be a bad idea.
#1 Solution for Logs, Traces & Metrics
![]() APM
APM
![]() Kubernetes
Kubernetes
![]() Logs
Logs
![]() Synthetics
Synthetics
![]() RUM
RUM
![]() Serverless
Serverless
![]() Security
Security
![]() More
More

![Splunk vs Prometheus: A Side-by-Side Comparison [2025 Guide]](/blog/content/images/size/w960/2024/08/Datadog-vs-sentry--13-.png)