Beginner's Guide to Elasticsearch API: Indexing and Searching Data
Elasticsearch is a JSON-based database leaning heavily towards the unstructured types within the databases available out there. ( Postgres and MySQL are purely structured, while NoSQL is entirely unstructured).
It interacts through restful APIs and provides a central unit system combining several datasets arising out of logs, metrics, and application trace data.
A quick comparison with relational database management systems (RDBMS) will tell us their similarities. What we refer to as a database in RDBMS becomes indexes when it comes to Elasticsearch. Tables become patterns, rows become documents, and columns become fields.
Elasticsearch is part of a larger ELK stack made of Logstash and Beats along with Kibana. Logstash is where you input data ( as SDKs or as something else), it then transforms this data and stashes it into Elasticsearch.
Beats is a complementary component to Logstash; it works the same way as Logstash just that it has added plugins in place (eventually ends up feeding data into the Logstash as usual). Kibana is a UI dashboard that picturizes all this data and makes widgets or visualizations which we can then comprehend with ease.
How a data travels through the ELK Stack?
Beats > Logstash > Elasticsearch > Kibana
Table Of Contents
What is REST API?
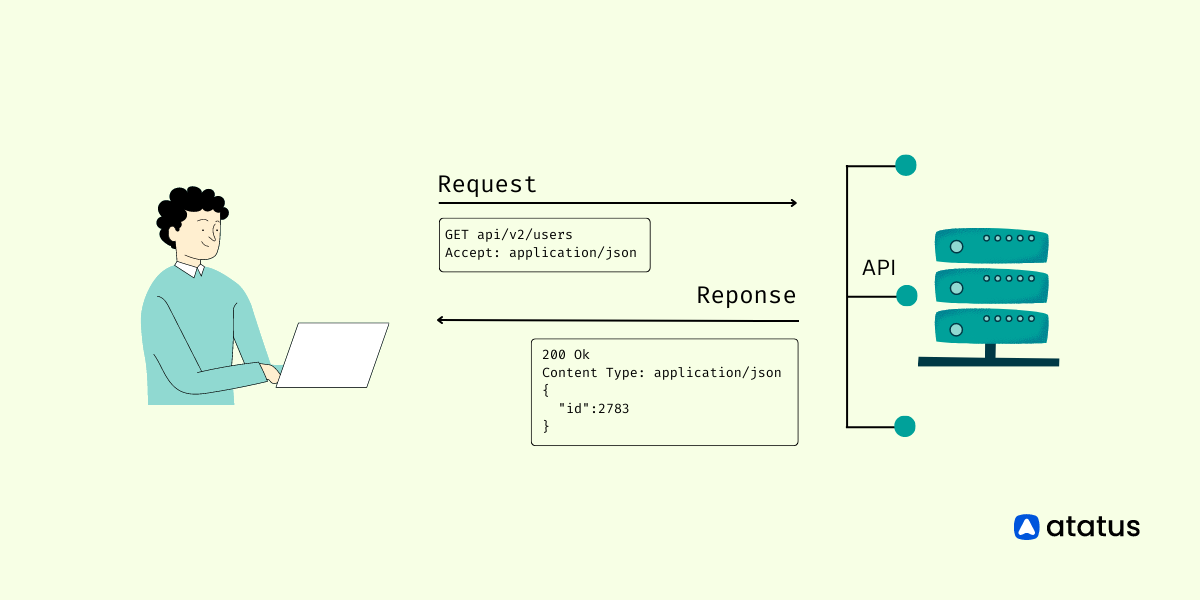
REST API stands for Representational State Transfer Application Programming Interface. It is an architectural style for building web services that are lightweight, scalable, and easy to consume.
In a RESTful API, resources are identified by URLs, and different HTTP methods are used to perform operations on these resources. For example, a GET request can be used to retrieve data, a POST request to create new data, a PUT request to update existing data, and a DELETE request to remove data.
REST APIs are stateless, meaning that the server does not keep track of the state of the client or the application. Instead, the client is responsible for maintaining the state of the application.
REST APIs are widely used for building web applications and mobile applications. They offer a flexible and standardized way for different applications to communicate and exchange data with each other.
What is ElasticSearch?
Elasticsearch is an open source distributed search and analytics engine that is built on top of the Apache Lucene search library. It is designed to be scalable, flexible, and performant, and can be used for a wide range of use cases including full-text search, log analysis, and business analytics.
Elasticsearch is built using a distributed architecture, which means that data is stored across multiple nodes in a cluster, providing high availability and fault tolerance. It uses a document-oriented data model, where data is stored as JSON documents that can be indexed and queried using a rich set of search and aggregation capabilities.
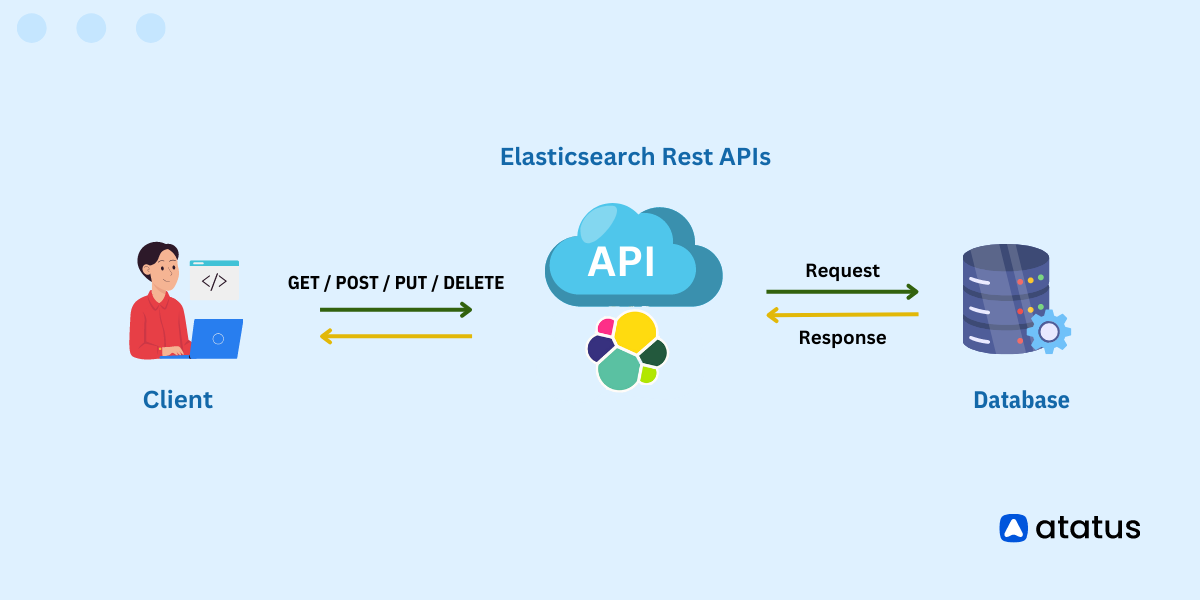
Elasticsearch also provides a RESTful API that allows users to interact with the engine using standard HTTP requests. This API can be used to index and search data, as well as to perform a wide range of administrative tasks such as managing indices and nodes, configuring security settings, and monitoring cluster health.
Elasticsearch Rest API
Elasticsearch provides a comprehensive RESTful API that allows you to interact with your data and cluster programmatically.
The Elasticsearch API is documented in detail in the official Elasticsearch documentation. Here are the steps to access the API documentation:
- Go to the Elasticsearch documentation.
- In the left-hand navigation menu, click on the "API Reference" link.
- You will see a list of all the Elasticsearch APIs. You can either browse through the APIs or search for a specific API using the search box.
- Click on an API to see its documentation. The documentation includes information about the API's purpose, parameters, request and response formats, examples, and more.
In addition to the API documentation, Elasticsearch also provides a powerful tool called "Kibana" that allows you to interact with Elasticsearch through a graphical user interface (GUI). Kibana includes a "Dev Tools" section that provides a console for testing and interacting with Elasticsearch APIs. You can use Kibana to test Elasticsearch queries and see the results in real-time.
Elasticsearch's comprehensive API documentation and tooling make it easy to work with Elasticsearch programmatically and build custom applications on top of it.
1. Document API
First, let's assume that you have an Elasticsearch instance running on http://localhost:9200 (change accordingly) and you want to index a document in an index called my_index.
Create the JSON document you want to index:
{
"title": "My Document Title",
"content": "This is the content of my document."
}
Use the Elasticsearch API to index the document. Here's an example using the curl command-line tool:
curl -XPOST 'http://localhost:9200/my_index/_doc' -H 'Content-Type: application/json' -d '
{
"title": "My Document Title",
"content": "This is the content of my document."
}
'
This command sends a POST request to Elasticsearch to index a new document in the my_index index. The _doc type is used to specify the document type (in Elasticsearch 7.0 and later, the document type is optional and can be omitted).
The -H option sets the Content-Type header to application/json, indicating that the data being sent is in JSON format. The -d option specifies the JSON data to be sent.
If the operation is successful, Elasticsearch will return a JSON response that includes the _index, _type, and _id of the newly indexed document:
{
    "_index" : "my_index",
    "_type" : "_doc",
    "_id" : "my_document_id",
    "_version" : 1,
    "result" : "created",
    "_shards" : {
    "total" : 2,
    "successful" : 1,
    "failed" : 0
},
	"created" : true
}
This example demonstrates the basics of indexing a document in Elasticsearch using the API. There are many other API calls available for searching, updating, deleting, and managing documents and indexes in Elasticsearch, and the Elasticsearch documentation provides detailed information on each of these APIs.
2. Search API
The Elasticsearch search API is a powerful tool for searching and retrieving data from an Elasticsearch index. Here's an example of how to use the Elasticsearch search API:
Assuming you have an index called my_index that contains documents with fields title and content.
Send a GET request to Elasticsearch search API with a search query:
curl -XGET 'http://localhost:9200/my_index/_search?q=title:search'This search query will return all documents in the my_index index that have the word "search" in the title field.
You can also use more advanced search queries using the Query DSL. Here's an example using the Query DSL to search for documents that have the word "search" in either the title or content field:
curl -XGET 'http://localhost:9200/my_index/_search' -H 'Content-Type: application/json' -d '
{
  "query": {
    "bool": {
      "should": [
        {
          "match": {
            "title": "search"
          }
        },
        {
          "match": {
            "content": "search"
          }
        }
      ]
    }
  }
}'
This query sends a POST request to the Elasticsearch search API with a JSON request body that specifies the search criteria using the Query DSL. The query is wrapped in a bool query, with two should clauses that specify that a document must match either the title or content field with the word "search".
The Elasticsearch search API also supports many other features, such as aggregations, sorting, highlighting, and more. The Elasticsearch documentation provides detailed information on each of these features and how to use them in the search API.
3. Indices API
The Index API allows you to add, delete or update a JSON document to an Elasticsearch index. Let’s see how indices API works-
List all indices:
curl -XGET 'http://localhost:9200/_cat/indices?v'This command sends a GET request to the Elasticsearch indices API to list all indices in the cluster. The _cat API is used to return the list in a tabular format.
Create a new index:
curl -XPUT 'http://localhost:9200/my_new_index'This command sends a PUT request to the Elasticsearch indices API to create a new index called my_new_index. By default, Elasticsearch will create the index with a single shard and no replicas. You can specify the number of shards and replicas in the request body.
Check the status of an index:
curl -XGET 'http://localhost:9200/my_index/_status'To see if the index that you created just now has been successfully added pass the GET command. This command sends a GET request to the Elasticsearch indices API to retrieve the status of the my_index index. The status includes information such as the number of documents in the index, the size of the index on disk, and more.
Delete an index:
curl -XDELETE 'http://localhost:9200/my_index'This command sends a DELETE request to the Elasticsearch indices API to delete the my_index index. This operation is irreversible and will permanently delete all data associated with the index.
The Elasticsearch indices API also supports many other features, such as index settings, mapping management, index templates, and more.
4. Cat API
The Elasticsearch cat API provides a set of tools for retrieving information about the cluster, indices, shards, and nodes in a human-readable format. Here's an example of how to use the Elasticsearch cat API:
List all indices:
curl -XGET 'http://localhost:9200/_cat/indices?v'This command sends a GET request to the Elasticsearch cat API to list all indices in the cluster. The _cat API is used to return the list in a tabular format.
List all nodes in the cluster:
curl -XGET 'http://localhost:9200/_cat/nodes?v'This command sends a GET request to the Elasticsearch cat API to list all nodes in the cluster. The response includes information such as the node ID, IP address, heap usage, and more.
List all shards in the cluster:
curl -XGET 'http://localhost:9200/_cat/shards?v'This command sends a GET request to the Elasticsearch cat API to list all shards in the cluster. The response includes information such as the index name, shard number, state, and node ID.
List all tasks running in the cluster:
curl -XGET 'http://localhost:9200/_cat/tasks?v'This command sends a GET request to the Elasticsearch cat API to list all tasks currently running in the cluster. The response includes information such as the task ID, type, action, and node ID.
The Elasticsearch cat API also supports many other features, such as listing aliases, retrieving the cluster health status, and more.
5. Cluster API
The Elasticsearch cluster API provides a set of tools for managing the overall cluster and its settings.
Retrieve the cluster health status:
curl -XGET 'http://localhost:9200/_cluster/health?pretty'This command sends a GET request to the Elasticsearch cluster API to retrieve the health status of the cluster. The response includes information such as the number of nodes in the cluster, the number of indices, the status of each index, and more.
Retrieve the cluster state:
curl -XGET 'http://localhost:9200/_cluster/state?pretty'This command sends a GET request to the Elasticsearch cluster API to retrieve the current state of the cluster. The response includes information such as the cluster name, node information, index information, and more.
Update the cluster settings:
curl -XPUT 'http://localhost:9200/_cluster/settings' -H 'Content-Type: application/json' -d'
{
  "persistent": {
    "cluster": {
      "routing": {
        "allocation": {
          "enable": "none"
        }
      }
    }
  }
}'
This command sends a PUT request to the Elasticsearch cluster API to update the cluster settings. In this example, we're setting the cluster.routing.allocation.enable setting to none, which disables automatic shard allocation across the cluster.
Retrieve the nodes in the cluster:
curl -XGET 'http://localhost:9200/_nodes?pretty'This command sends a GET request to the Elasticsearch cluster API to retrieve information about all nodes in the cluster. The response includes information such as the node ID, hostname, IP address, and more.
Elastic Search API Example
Here's an example of an Elasticsearch API request that combines indexing, searching, and aggregating data:
POST /my_index/_doc
{
  "title": "My Document",
  "content": "This is the content of my document.",
  "tags": ["Elasticsearch", "tutorial"]
}

GET /my_index/_search
{
  "query": {
    "match": {
      "content": "Elasticsearch tutorial"
    }
  },
  "aggs": {
    "top_tags": {
      "terms": {
        "field": "tags.keyword",
        "size": 10
      }
    }
  }
}
In this example, we first index a document with a title, content, and tags using the _doc endpoint. Then, we search for documents containing the phrase "Elasticsearch tutorial" using the _search endpoint and the match query. Finally, we aggregate the top 10 tags associated with these documents using the terms aggregation on the tags field.
Note that this is just an example, and you may need to adjust the query, filters, and aggregations based on your specific use case.
Conclusion
APIs have become an essential part of modern software development. Their main significance being its ability to integrate with other applications or services.
It saves time as you don't have to re-build every program from scratch. Further, the standard protocols render it easier for developers to modify and improve upon certain features. Its ability to scale to handle large workloads and the idea of innovating solutions on top of an existing technology transpires as a cherry on top of the cake!
This link has a crisp video trying out all the above-mentioned API calls in a Kibana console.
Atatus API Monitoring and Observability
Atatus provides Powerful API Observability to help you debug and prevent API issues. It monitors the consumer experience and is notified when abnormalities or issues arise. You can deeply understand who is using your APIs, how they are used, and the payloads they are sending.
Atatus's user-centric API observability tracks how your actual customers experience your APIs and applications. Customers may easily get metrics on their quota usage, SLAs, and more.
It monitors the functionality, availability, and performance data of your internal, external, and third-party APIs to see how your actual users interact with the API in your application. It also validates rest APIs and keeps track of metrics like latency, response time, and other performance indicators to ensure your application runs smoothly.
#1 Solution for Logs, Traces & Metrics
![]() APM
APM
![]() Kubernetes
Kubernetes
![]() Logs
Logs
![]() Synthetics
Synthetics
![]() RUM
RUM
![]() Serverless
Serverless
![]() Security
Security
![]() More
More