Server Health Checks: A Beginner's Guide

Why do we go for server health checkups? Well, think of it like this: just as we schedule regular checkups for ourselves to make sure we're healthy and functioning optimally, our servers need the same level of care.
After all, they're the backbone of our digital infrastructure, tirelessly handling requests, serving data, and keeping our applications running smoothly. But just like our bodies, servers can face issues too – from performance bottlenecks to potential crashes – and that's where server health checkups come into play.
Imagine this: you're driving a car, and suddenly, the engine light blinks. What's your immediate reaction? You pull over, check under the hood, and address the issue before it escalates, right? Well, servers operate similarly.
They have their own set of 'engine lights,' indicators that signal potential problems or areas of concern. And just like with a car, it's important to address these issues to prevent any major disruptions in service. Additionally, using a load balancer can evenly distribute traffic, preventing any single server from being overwhelmed.
So, why do we need server health checkups? They're essential for maintaining our digital infrastructure's reliability, performance, and security. By regularly monitoring the health of our servers, we can actively identify and address any issues, improve optimal performance, and, ultimately, provide an experience for our users.
We will gather the importance of server health monitoring, explore the key metrics and indicators to monitor, and discuss best practices for implementing and interpreting the results.
So get ready because, by the end of this journey, you'll be equipped with the knowledge and tools to keep your servers running smoothly and efficiently.
- What is Server Health?
- What are Server Health Checks?
- Types of Health Checks
- Implementing Health Checks
- Choosing Tools and Technologies
- Effective Practices for Health Checks
What is Server Health?
Server health refers to a server's overall condition, performance, and operational status within a computer network or infrastructure.
It contains various aspects such as resource utilization, system stability, responsiveness, and security. A server is considered healthy when it operates efficiently, reliably, and securely, meeting the requirements and demands of its intended use. Monitoring performance metrics is essential to ensure these factors are consistently met.
Factors contributing to server health include:
-
Resource Utilization: The server should effectively utilize CPU, memory, disk space, and network bandwidth without excessive strain.
-
Stability and Availability: A healthy server should maintain stable performance and be available to handle requests and serve data consistently without unexpected downtime or disruptions.
-
Responsiveness: The server should respond immediately to user requests and system commands, providing a smooth user experience.
-
Security: Server health also involves securing the security and integrity of data and resources, protecting against unauthorized access,and other security threats.
What are Server Health Checks?
Health checks, often referred to as system checks or service checks, are automated procedures or tests designed to assess the operational status and health of a server, application, or service.
These checks are typically performed regularly to detect and address potential issues actively. Synthetic monitoring can also help simulate user interactions, providing a proactive approach to identifying performance issues before they impact real users.
Purpose and Benefits of Health Checks
The primary purpose of health checks is to enable the optimal performance, availability, and reliability of servers, applications, and services.
By continuously monitoring key metrics and indicators, health checks enable administrators to identify potential issues, troubleshoot problems, and take corrective actions before they escalate into critical failures or disruptions.
Some key benefits of Health Checks include:
- Early Detection of Issues:
Purpose: Server health checks are designed to detect potential issues or anomalies in system performance before they escalate into critical failures. Monitoring for server errors can also help identify issues early.
Example: A health check might monitor CPU usage and alert administrators if CPU utilization exceeds a certain threshold, indicating a potential performance bottleneck. - Active Problem Resolution:
Purpose: Health checks enable administrators to address problems and prevent service interruptions actively.
Example: It monitors disk space usage and automatically triggers a cleanup process or notifies administrators when disk space reaches a specified limit to prevent storage-related issues. - Better Performance:
Purpose: Regular health checks help improve the performance and efficiency of servers by identifying areas for improvement.
Example: A health check analyzes network latency and identifies network blockages, allowing administrators to maximize network configurations for better performance. - Increased Reliability:
Purpose: Health checks contribute to servers' overall reliability and stability by continuous monitoring and maintenance.
Example: Health check monitors system logs for errors and automatically restart services or notify administrators of potential issues to prevent service downtime. - Improved User Experience:
Purpose: Health checks analyze the availability and reliability of services, leading to a consistent user experience.
Example: A health check might monitor response times for web applications and alert administrators if response times exceed acceptable limits, increasing a smooth user experience for website visitors.
Types of Health Checks
1. Passive Health Checks
-
Passive health checks monitor server health by analyzing incoming traffic or events without actively initiating requests.
-
Purpose: They provide insights into real-world usage and performance without generating additional traffic or load on the server.
-
Example: Consider a web server that hosts an e-commerce website. In this scenario, a passive health check could involve monitoring the server logs for error messages related to website functionality or performance. The monitoring system continuously analyzes the logs for anomalies, such as HTTP 500 errors indicating server-side issues or unusually high response times for certain web pages.
2. Active Health Checks
-
Active health checks involve sending requests or probes to servers or services to assess their availability and performance.
-
Purpose: They provide real-time feedback on servers' and services' operational status and responsiveness. Monitoring the HTTP response helps identify potential issues.
-
Example: Continuing with the example of an e-commerce website, an active health check could involve sending periodic HTTP requests to specific endpoints of the web server, such as the homepage or product pages. The monitoring system initiates these requests at regular intervals (e.g., every minute) to verify that the server responds within an acceptable timeframe (e.g., under 200 milliseconds) and returns the expected HTTP status codes (e.g., 200 OK). If the server fails to respond or returns an error status code, the monitoring system triggers an alert to notify administrators of a potential issue.
Implementing Health Checks
Setting Up Basic Health Checks
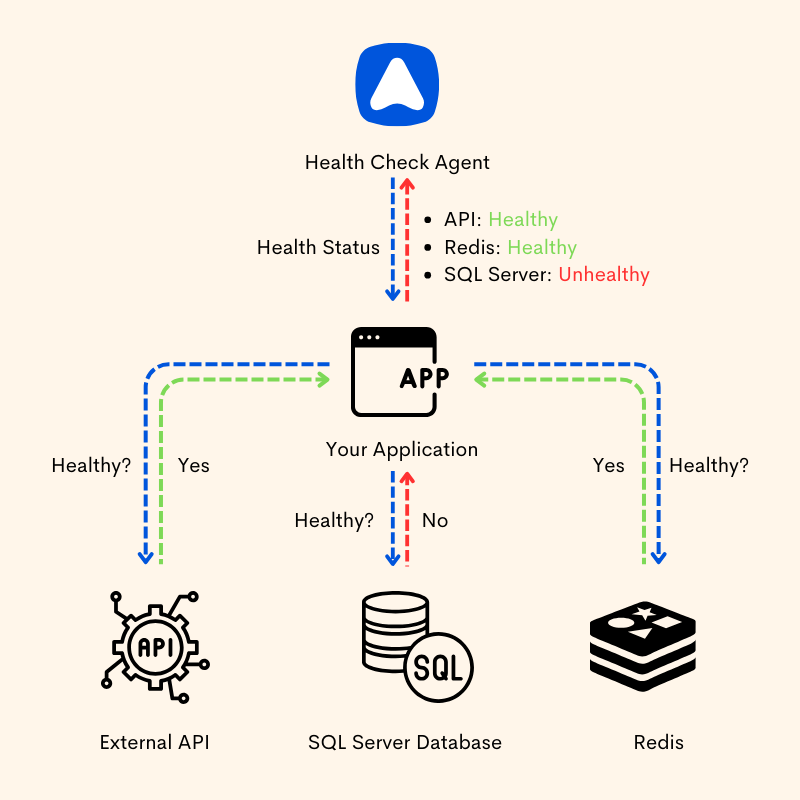
Let's consider a scenario where we're building a web application hosted on a server. We'll implement two types of health checks: an active health check using a simple HTTP endpoint and a passive health check monitoring server logs.
1. Active Health Check (HTTP Endpoint)
1. Create a route in your web application framework (e.g., Express.js for Node.js) to serve as the health check endpoint.
// Example using Express.js
const express = require('express');
const app = express();
const port = 3000;

app.get('/health', (req, res) => {
  res.status(200).json({ status: 'UP' });
});

app.listen(port, () => {
  console.log(`Server is running on port ${port}`);
});
2. Configure a monitoring tool (e.g., Prometheus) to periodically send HTTP requests to the `/health` endpoint and collect metrics.
2. Passive Health Check (Server Logs)
1. Implement logging in your application to capture important events and errors.
// Example using Winston logger in Node.js
const winston = require('winston');

const logger = winston.createLogger({
  level: 'info',
  format: winston.format.json(),
  transports: [
    new winston.transports.Console(),
    new winston.transports.File({ filename: 'error.log', level: 'error' })
  ]
});

logger.info('Server started successfully.');
2. Set up log monitoring using a log aggregation service (e.g., ELK Stack) to analyze server logs for errors and anomalies.
Choosing Tools and Technologies
When choosing tools and technologies for implementing health checks, consider factors such as ease of use, compatibility with your existing infrastructure, scalability, and support for monitoring various aspects of server health (e.g., CPU, memory, network).
Some popular tools and technologies for implementing health checks include:
- Atatus: Atatus is an application performance monitoring (APM) and error-tracking platform that offers active and passive health checks for web applications and services. Real-time insights into application performance are provided, including response times, throughput, and error rates. Atatus offers customizable alerting and visualization features for monitoring server health and diagnosing performance issues.
- Prometheus: A monitoring and alerting toolkit supporting active health checks using exporters and passive health checks with metric collection.
- Grafana: A visualization and monitoring platform that works with Prometheus for visualizing health check metrics.
- ELK Stack (Elasticsearch, Logstash, Kibana): A log aggregation and analysis platform that supports passive health checks by analyzing server logs for errors and anomalies.
- Datadog: A cloud monitoring platform offering active and passive health checks with customizable alerting and visualization features.
Effective Practices for Health Checks
Best Practices to consider when setting up your health check routines:
1. Guard Against False Positives:
- What to Do: Take measures to guard against false positives in health checks using techniques like retries, timeouts, and fallbacks.
- Why It Matters: Avoiding false positives helps maintain the integrity of your monitoring system and prevents unnecessary alarms or alerts for transient issues.
2. Improve Check Frequency:
- What to Do: Only check health as frequently as necessary, considering the granularity of measurements required for effective monitoring.
- Why It Matters: Check frequency helps conserve resources and minimize unnecessary monitoring overhead, as well as cost-effective monitoring practices.
3. Run Background Health Checks:
- What to Do: Conduct health checks in the background and update an isHealthy flag used in request handler logic.
- Why It Matters: By running health checks in the background, you can prompt responses to health check requests without impacting the responsiveness of your applications.
4. Prioritize Critical Dependencies:
- What to Do: Distinguish between critical and non-critical dependencies when conducting health checks. Prioritize checks for mandatory dependencies over optional ones to prevent disproportionate reactions to failures.
- Why It Matters: By focusing on critical dependencies, you can avoid unnecessary disruptions to your service and prioritize remediation efforts where they are needed most.
5. Disable Caching on Health Check Endpoints:
- What to Do: Disable caching on health check endpoints to make sure that status reports are always accurate and up-to-date.
- Why It Matters: Disabling caching prevents outdated status reports and make sure that health check endpoints provide real-time status updates, facilitating accurate monitoring of service health.
6. Prevent Cascading Failures:
- What to Do: Implement strategies to prevent cascading failures, where the failure of one leads to the collapse of the entire system.
- Why It Matters: Preventing cascading failures helps maintain system stability and prevents widespread service outages, ultimately providing a smoother user experience.
7. Disable Caching on Health Check Endpoints:
- What to Do: Disable caching on health check endpoints to guarantee that status reports are always accurate and up-to-date.
- Why It Matters: Disabling caching prevents outdated status reports and checks that health check endpoints provide real-time status updates, facilitating accurate service health monitoring.
8. Differentiate Shallow and Deep Health Checks:
- What to Do: Differentiate between shallow and deep health checks, conducting shallow checks frequently and deep checks less often.
- Why It Matters: Separating shallow and deep health checks allows for more effective system performance and reliability monitoring, confirming that resources are used efficiently.
Conclusion
Remember the importance of differentiating between shallow and deep health checks, improving check frequency, and guarding against false positives to make your monitoring efforts efficient and effective.
As you struggle to maintain the health and flexibility of your infrastructure, keep in mind the words of systems engineer John Allspaw: "Make it easy to do the right thing and hard to do the wrong thing."
In the words of code:
if match_application_requirements(health_checks):
    deploy_health_checks(health_checks)
else:
    refine_health_checks(health_checks)
Choose health checks wisely, align them with your application's needs, and allow your team to monitor and maintain your systems confidently.
Atatus Real User Monitoring
Atatus is a scalable end-user experience monitoring system that allows you to see which areas of your website are underperforming and affecting your users. Understand the causes of your front-end performance issues and how to improve the user experience.
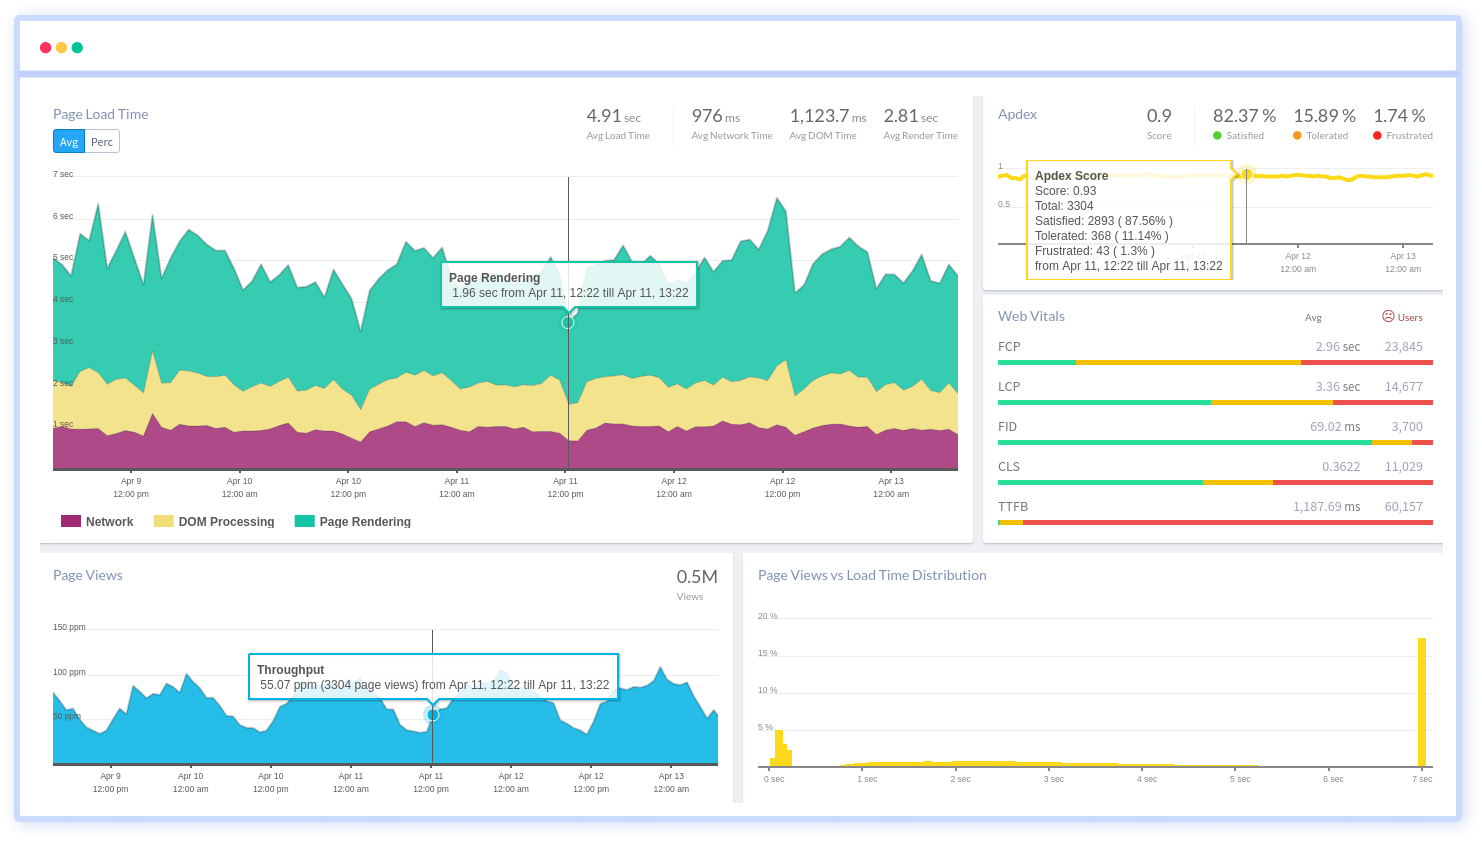
By understanding the complicated frontend performance issues that develop due to slow page loads, route modifications, delayed static assets, poor XMLHttpRequest, JS errors, core web vitals and more, you can discover and fix poor end-user performance with Real User Monitoring (RUM).
You can get a detailed view of each page-load event to quickly detect and fix frontend performance issues affecting actual users. With filterable data by URL, connection type, device, country, and more, you examine a detailed complete resource waterfall view to see which assets are slowing down your pages.
#1 Solution for Logs, Traces & Metrics
![]() APM
APM
![]() Kubernetes
Kubernetes
![]() Logs
Logs
![]() Synthetics
Synthetics
![]() RUM
RUM
![]() Serverless
Serverless
![]() Security
Security
![]() More
More