For efficient Java performance tuning, it's critical to monitor the proper aspects and use the right tools. The following is a list of our top Java performance monitoring tools.
In Java, memory leaks are a real issue. We'll look at what causes memory leaks, how to spot them at runtime, and how to deal with them in our application.
One Java application can generate up to hundreds of metrics. There are a few crucial indicators for monitoring that you should pay attention to thread counts, garbage collection, and memory usage. These metrics are accessible via JMX.
Java's functionality and programming flexibility increased concurrently with technological advancement. A top 7 list of performance metrics to measure when evaluating the health of Java applications.
Java logs are the best source for locating application issues. You can use these best practices in Java logging to troubleshoot before your users are affected.
Discover the role of Java Garbage Collection in enhancing your application's memory management by automating memory cleanup and performance optimization.
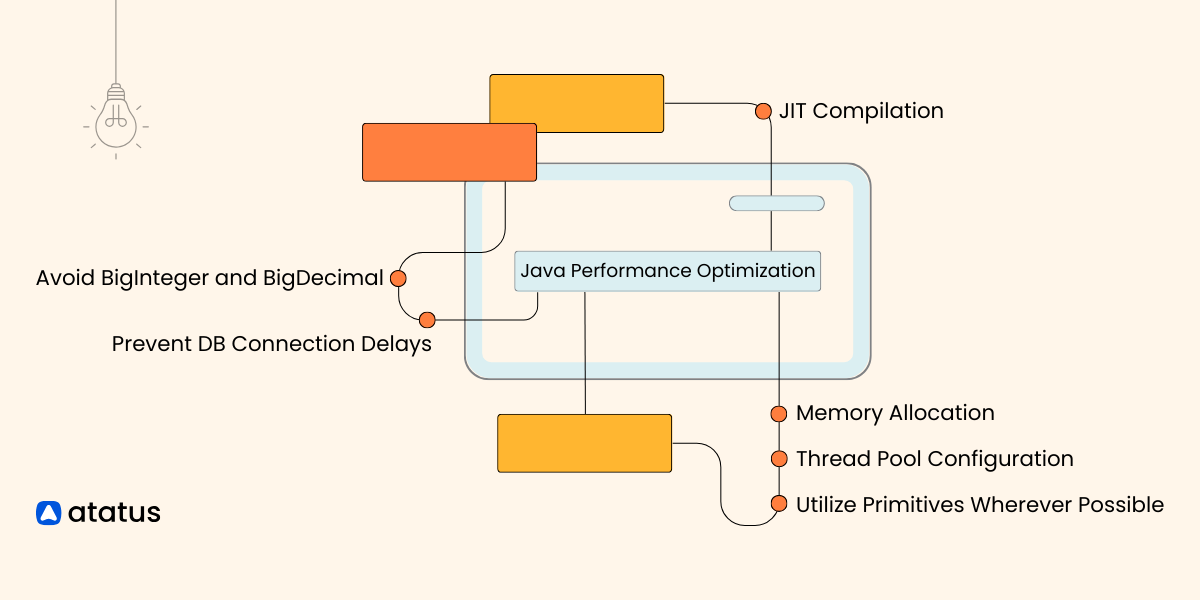
Discover the best practices to ensure smooth and efficient operation, and avoid any performance issues that could impact your users. Maximize your Java performance today!
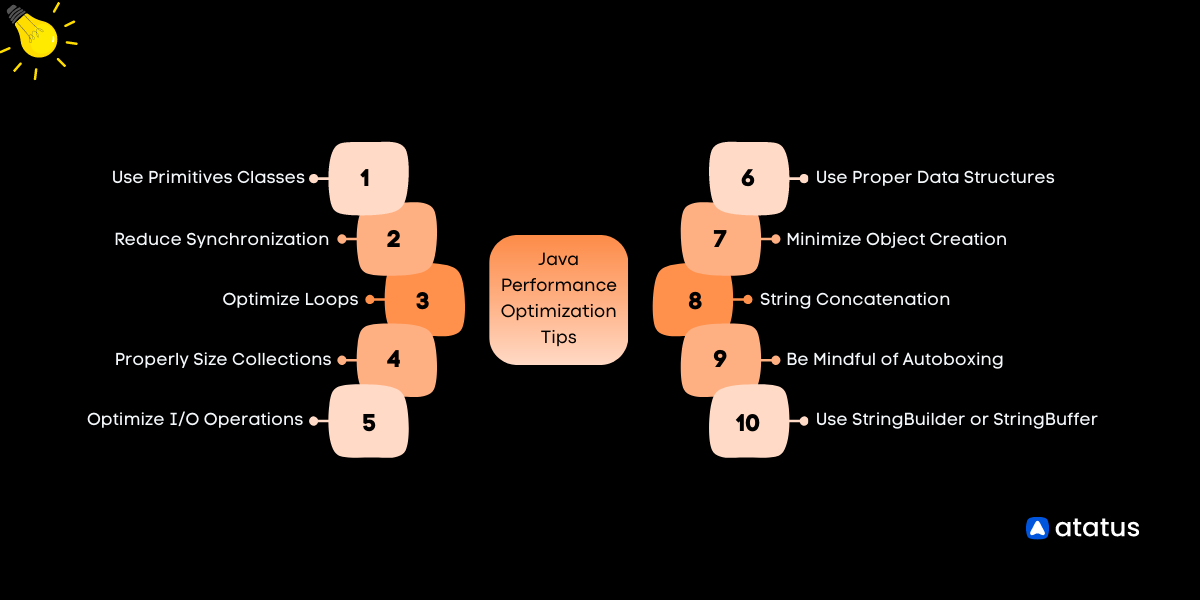
Boost Java app speed with expert tips: data structures, object reuse, string handling, loop efficiency, threading, I/O, and more for optimal performance.
Discover how Java agents can efficiently profile your applications. Learn profiling techniques and tools for identifying and optimizing performance issues.
Monitor your entire software stack
Gain end-to-end visibility of every business transaction and see how each layer of your software stack affects your customer experience.