Java Garbage Collection - Manage your system's memory effectively
Have you ever wondered how computer programs manage their memory, like how they clean up after themselves to keep things running smoothly? what happens to all those blocks you are no longer using?
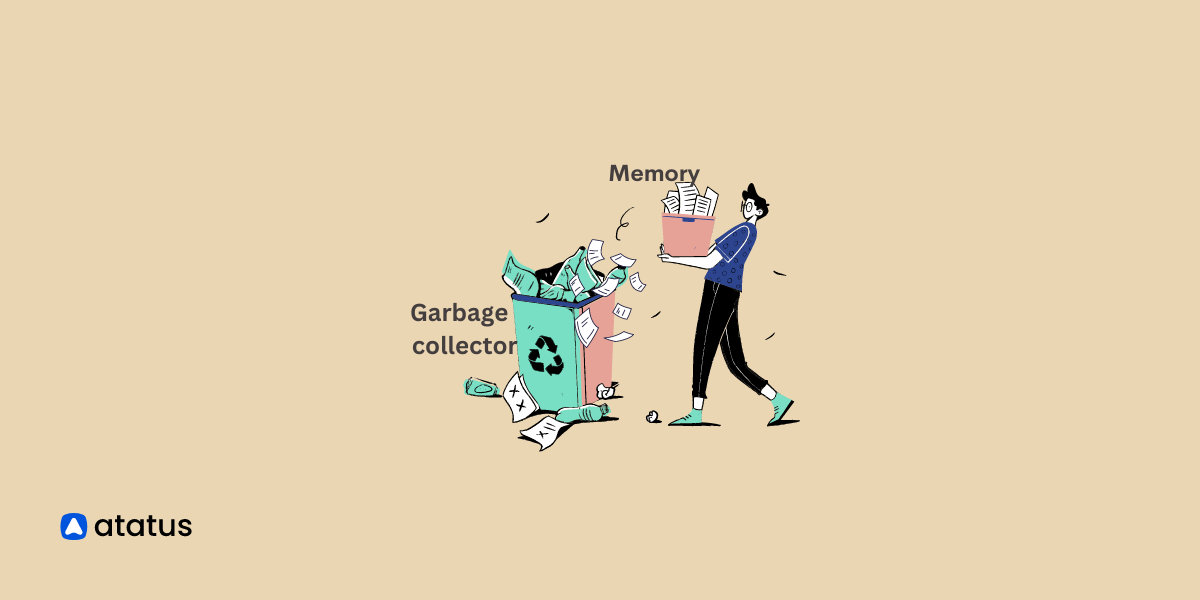
This is where the role of the garbage collector becomes significant. Think of the garbage collector as a diligent assistant that recognizes tools you have finished using. It proceeds to carefully place these tools back into their storage, effectively reclaiming memory. This ensures that the system remains well-organized and prepared for upcoming tasks.
In this blog, let's explore the ins and outs of Java's garbage collector, understand how it works, and why it is crucial for strong and efficient programs.
Let's get started!
Table of Contents
- What is Garbage Collection?
- Why is Java Garbage Collection important?
- Mark and Sweep: Garbage Collection Algorithm
- Types of Java Garbage Collection
- Different Java Garbage Collection Techniques
- Advantages of Java Garbage Collection
What is Garbage Collection?
In Java programming, garbage collection is a procedure through which unutilized memory (storage space) is automatically recognized and eliminated. It plays a crucial role in preventing memory leaks and enhancing memory utilization.
The responsibility of managing this process lies with the Java Virtual Machine (JVM), which keeps track of object references. It periodically identifies and collects objects that are no longer needed, making sure that memory space becomes available for new objects.
This automatic memory management system relieves programmers from the task of manually supervising memory, leading to well-functioning Java applications that run smoothly and efficiently.
Why is Java Garbage Collection important?
In Java programming, when your program runs, it creates and uses objects in its memory to get things done. Think of these objects as tools you use to build something. However, just like in real life, sometimes you finish using a tool and put it back in its place to keep your workspace organized and ready for the next task.
Java Garbage Collection is like a smart cleaner for your program's memory. It is responsible for identifying objects that your program doesn't need anymore. Once an object is no longer being used, Garbage Collection steps in and removes it from memory, making space for new objects.
Why is this important? Imagine you never put away the tools you are done using. Over time, you would run out of space to work, and finding the right tool would become difficult. Similarly, if your program doesn't clean up unused objects, it could run out of memory, causing it to slow down or even crash.
Garbage Collection prevents these issues. It keeps your program's memory organized and prevents it from getting cluttered with things you no longer need. This way, your program can keep running smoothly, efficiently using memory, and making sure it's always ready to handle new tasks.
Java Garbage Collection Algorithm
1. Mark and Sweep Garbage Collection
Mark phase is like a detective work. The system begins by figuring out which objects in your program's memory are actively being used or are reachable.
It starts its investigation from specific points called roots, like main program variables or important references. Then, it follows the connections between objects to see which ones are connected to these starting points. It marks the objects it finds as still useful or "alive."
Once the system has marked the living objects, Sweep shifts to cleaning up the memory. It identifies the objects that weren't marked as alive in the previous step.
These are the objects that are no longer needed by your program. The system then reclaims the memory occupied by these garbage objects, making it available for new objects in the future. This process of cleaning up memory is essential for preventing memory leaks and ensuring efficient memory usage.
These two steps, working hand in hand, ensure that your program's memory stays organized and efficient. It's like a combination of finding out what's still needed and getting rid of what's no longer necessary, helping your program run smoothly.
The essential features of the Mark and Sweep algorithm are as follows:
- Memory Reclamation: The algorithm efficiently recovers memory occupied by objects that have become garbage and are no longer needed.
- Fragmentation Concerns: One drawback is its potential to result in memory fragmentation because it doesn't compact memory after the collection process. This can lead to inefficient memory usage over time.
- Pause Time Impact: As the heap size grows, the algorithm's pause times can extend due to the necessity of scanning the entire heap. This can impact the responsiveness of the application during garbage collection events.
2. Generational Garbage Collection Algorithm
Java's garbage collection is a fundamental aspect of memory management in the world of programming. Understanding what triggers garbage collection events in Java is essential for optimizing the performance and stability of your applications. So lets look into the factors to understand the concept better.
1. Minor Garbage Collection
Minor garbage collection is a process in Java's memory management where the focus is on cleaning up the "young generation" section of the heap. This area is where newly created objects reside.

During a minor collection, the Java Virtual Machine (JVM) identifies and removes objects that are no longer needed in this young generation. The surviving objects that remain are often promoted to an older generation of memory.
2. Major Garbage Collection
Major garbage collection, also known as full garbage collection, addresses the older generation of objects within the heap. This older generation accumulates objects that have survived multiple minor collections.
Major garbage collection events are more extensive and can lead to longer pauses compared to minor collections. In a major collection, the JVM identifies and removes objects in the older generation that are no longer in use. This process helps to release memory and prevent memory leaks in long-running applications.
In a major garbage collection, the focus shifts to the older generation. Comparable to a thorough cleaning, it targets long-lived objects, freeing up substantial memory and optimizing the overall memory landscape.
3. Mixed Garbage Collection
Mixed garbage collection is a hybrid approach that combines characteristics of both minor and major collections. The objective is to strike a balance between minimizing pause times and maintaining efficient memory usage.
During a mixed collection event, parts of the older generation are collected while allowing the application to continue executing. This approach aims to reduce the impact on the application's responsiveness while still ensuring effective memory management.
The key characteristics of Generational Garbage Collection include:
- Efficiency: It takes advantage of the generational behaviour of objects to optimize garbage collection.
- Pause Times: Minor collections are usually faster and less disruptive, while major collections can introduce longer pauses.
- Memory Management: Compacting memory during major collections helps reduce fragmentation and optimize memory usage.
Different Java Garbage Collection Techniques
Before getting into the specifics of various garbage collection types in Java, it is essential to understand that managing memory is a critical aspect of programming.
Different situations call for different approaches to ensure efficient memory utilization. Let's now explore these types in more detail to gain a comprehensive understanding of their roles in maintaining well-functioning Java applications.
Technique 1: Serial Garbage Collection
In Java's Serial Garbage Collection, a single thread is responsible for both garbage collection and application execution.
It is suitable for single-threaded applications or those with small memory footprints. This technique can be used for Simple command-line applications with low memory requirements.
public class SerialGC
{
    public static void main(String[] args)
    {
        // Application code

        System.gc(); // Explicit garbage collection request
    }
}
No specific configuration is required as it's automatically chosen when suitable.
To enable it explicitly (although it might be redundant), you can use:
java -XX:+UseSerialGC YourClassNameTechnique 2: Parallel Garbage Collection
Parallel Garbage Collection employs multiple threads to perform garbage collection, enhancing efficiency on multi-core processors. It divides the heap into smaller sections, with each thread managing a section.
While it reduces pause times compared to the Serial approach, there can still be noticeable pauses during collection. This technique can be used for data processing applications running on multi-core machines.
public class ParallelGC
{
    public static void main(String[] args)
    {
        // Application code
        // ...

        System.gc(); // Explicit garbage collection request
    }
}
To enable it:
java -XX:+UseParallelGC YourClassNameTechnique 3: CMS (Concurrent Mark-Sweep) Garbage Collection
CMS is designed to minimize pause times further. It operates by dividing the collection process into stages: an initial marking phase done in parallel, followed by a concurrent marking phase while the application is running, and finally a sweeping phase.
While it significantly reduces pause times, it can impact application throughout due to concurrent overhead. This collector aims to minimize pause times by performing most of the work concurrently.
To enable it:
java -XX:+UseConcMarkSweepGC YourClassNameTechnique 4: G1 (Garbage-First) Garbage Collection
G1 Garbage Collection focuses on predictability and minimizing pause times. It divides the heap into regions and uses a sophisticated algorithm to prioritize the collection of regions with the most garbage.
This approach helps maintain a predictable response time for applications, making it suitable for large heaps and low-latency requirements.
java -XX:+UseG1GC YourClassNameTechnique 5: ZGC (Z Garbage Collection)
ZGC is designed to provide low-latency garbage collection for applications requiring nearly uninterrupted performance.
It employs a novel approach that divides the heap into regions like G1 but performs concurrent compaction, reducing fragmentation and pause times. This makes it ideal for applications with stringent latency requirements.
java -XX:+UseZGC YourClassName
Technique 6: Shenandoah Garbage Collection
Shenandoah Garbage Collection also targets low-latency requirements. It employs concurrent algorithms to minimize pause times.
It performs most of its work concurrently with application threads, including all phases of compaction, making it suitable for applications with large heaps and strict latency demands.
java -XX:+UseShenandoahGC YourClassNameTechnique 7: Epsilon Garbage Collection
Epsilon is an experimental garbage collector introduced in Java 11.
Unlike other collectors, it doesn't perform significant garbage collection but rather focuses on maximizing application throughput by not collecting garbage at all. This can be beneficial for specific use cases where memory management is handled externally.
java -XX:+UnlockExperimentalVMOptions -XX:+UseEpsilonGC YourClassNameThus, in Java, several garbage collection methods have been developed to manage diverse application requirements. Each type has its own characteristics, strengths, and weaknesses, making them suitable for specific scenarios.
Advantages of Java Garbage Collection
Here are some of the key advantages of garbage collection in Java,
Memory Leak Prevention: Garbage collection prevents memory leaks by automatically reclaiming memory from objects that are no longer referenced. This ensures efficient memory usage over time. Example: Imagine a web server managing user sessions. Without garbage collection, discarded sessions could accumulate, consuming memory and potentially crashing the server.
Automatic Reclamation: Unreferenced objects are automatically identified and collected, optimizing memory utilization and maintaining good application performance. Example: A social media app can discard no-longer-used user profile objects, ensuring efficient memory management as users interact with the app.
Enhanced Productivity: Developers can concentrate on building features rather than managing memory, resulting in faster development cycles. Example: A team working on a financial application can dedicate more time to implementing complex algorithms for risk assessment instead of manual memory handling.
Lower Maintenance Effort: Memory-related bugs become less likely, reducing maintenance efforts and the need for frequent updates. Example: A productivity app can undergo fewer patches and updates, as the absence of memory-related issues leads to better stability.
Support for Large-Scale Apps: Garbage collection scales well with complex applications, managing memory efficiently in software with numerous components. Example: An enterprise resource planning (ERP) system can handle extensive data and user interactions without developers constantly managing memory.
Conclusion
In a nutshell, Java's Garbage Collection plays a pivotal role in automatic memory management. It ensures efficient memory utilization by identifying and cleaning up memory that is no longer in use, preventing memory leaks and optimizing application performance.
By managing memory automatically, Garbage Collection relieves developers from the burden of manual memory allocation and deallocation, reducing the risk of memory-related bugs and improving productivity. It contributes to the stability and reliability of Java applications by preventing issues.
Thus, garbage collection is a foundation of Java's memory management model, providing automated memory clean up that enhances application stability, security, and performance.
Monitor your Java application for errors & exceptions with Atatus
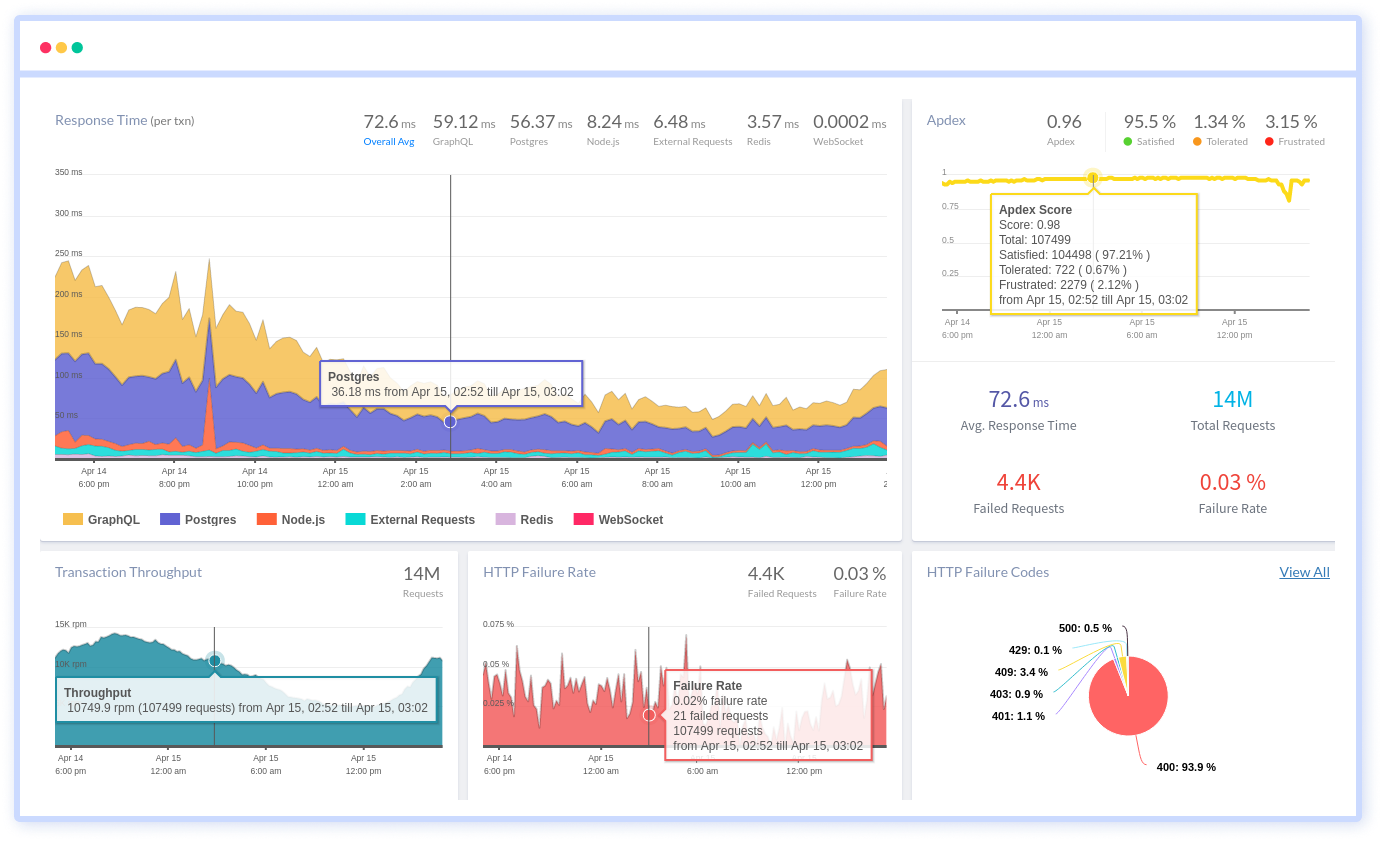
When it comes to ensuring the optimal performance and reliability of your Java applications, monitoring is key. The ability to detect bottlenecks, identify slowdowns, and troubleshoot issues in real-time can significantly enhance the user experience and streamline your development workflow. That's where Atatus comes in.
With its powerful features and intuitive interface, you can gain deep insights into your application's performance metrics, traces, and errors. By visualizing the entire request lifecycle, pinpointing problematic areas becomes a breeze.
With Atatus Java performance monitoring:
- Root Cause Analysis: Quickly pinpoint the root causes of performance regressions.
- Improve User Experience: Deliver faster response times and smoother interactions for users.
- Code Profiling: Profile code execution to identify CPU-intensive or slow sections.
- Reduced Downtime: Minimize downtime through early identification and resolution of issues.
If you are not yet a Atatus customer, you can sign up for a 14-day free trial .
#1 Solution for Logs, Traces & Metrics
![]() APM
APM
![]() Kubernetes
Kubernetes
![]() Logs
Logs
![]() Synthetics
Synthetics
![]() RUM
RUM
![]() Serverless
Serverless
![]() Security
Security
![]() More
More