Top 7 Java Performance Metrics to Monitor
Today, almost any metric you can think of can be tracked down and reported, as opposed to the past when the software was traditionally provided in boxes and its performance in production could not be predicted. The issues we are currently facing are not due to a lack of information, but rather to an abundance and scale of information.
This becomes significantly more difficult to manage when dozens or even hundreds of servers are in use. Logs have largely remained the same for more than 20 years and are one reminder of those boxed software days. Most developers still rely on those for information on their production systems, although they are gradually being replaced.
Without relying on log files in any way, we've chosen to compile some of the most insightful metrics you can monitor to understand how your application behaves in production. New deployments are probably the most frequent influence on how Java performance indicators behave, excluding external factors like user loads. Thus, following up on them after fresh deployments become much more crucial.
Here's how it is done:
- Business Transactions
- External Dependencies
- Caching Strategy
- Error Rates
- Garbage Collection
- Application Topology
- Log Size
#1 Business Transactions
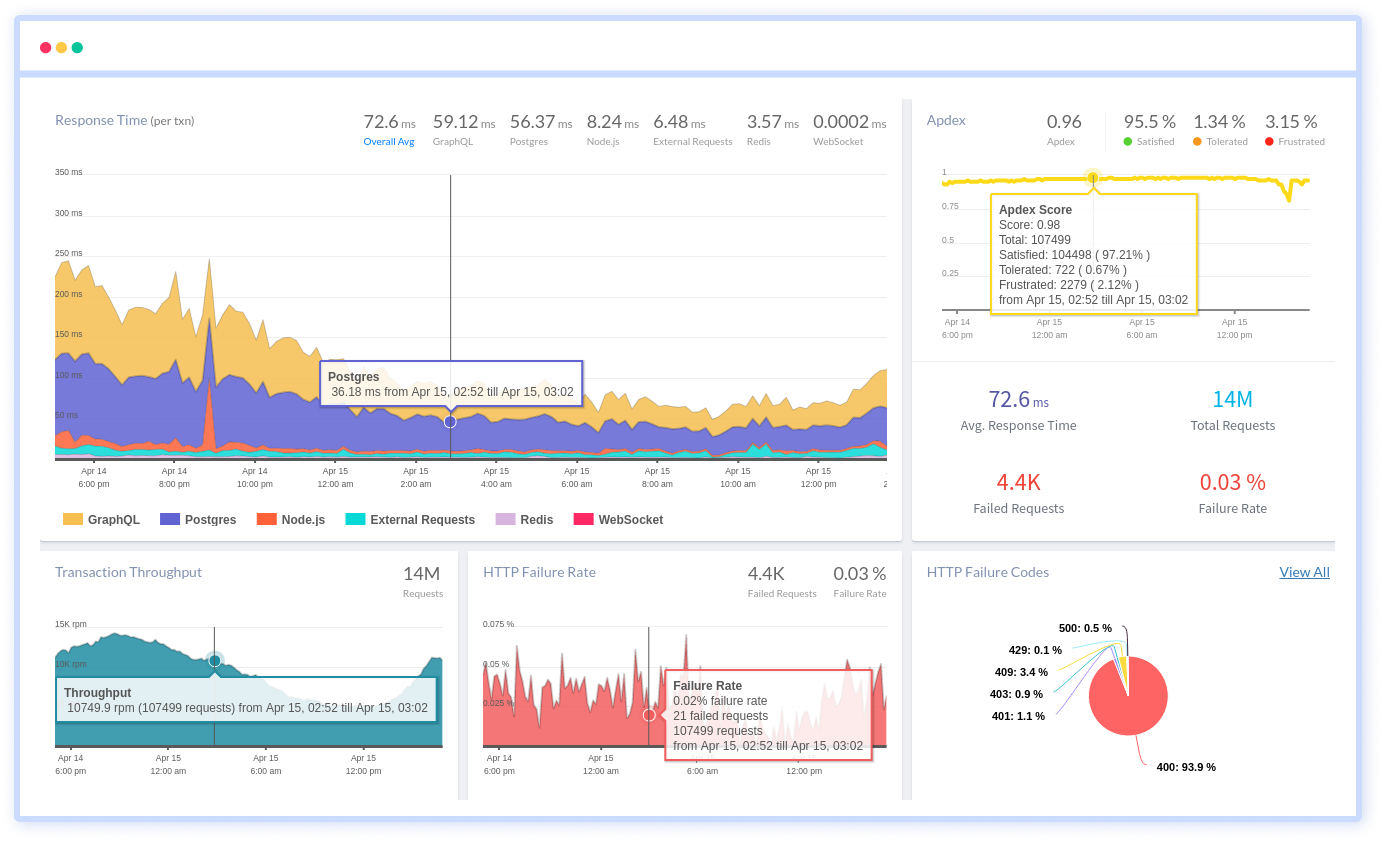
Business Transactions offer insight into real-user behavior since they record the performance that real users are having when they use your application in real-time. Measuring the effectiveness of a business transaction involves recording both the overall response time of the transaction as well as the response times of each of its constituent levels. The baseline that best suits your company's needs can then be used to compare these response times against and decide what is normal.
We would advise you to measure how your business transactions perform if you could only measure one feature of your application. The performance of your application is determined by your business transactions, even while container metrics can offer a wealth of information and can guide you in deciding when to auto-scale your environment.
To give you some background, business transactions are recognized by their entry-point, which is the interaction with your application that initiates the business transaction. Interactions such as a web request, a web service call, or a message on a message queue can be used to establish the entry point of a business transaction.
A business transaction's performance is evaluated once it has been recognized across your entire application ecosystem. To determine whether a business transaction is normal, the performance of each one is measured against its baseline.
The baseline used to evaluate the business transaction is constant for the hour that it is operating, but it is becoming better with each execution. In conclusion, business transactions are the most accurate measure of the user experience, making them the most crucial metric to monitor.
#2 External Dependencies
External dependencies are systems that your application interacts with and can take many different forms, including dependent web services, legacy systems, or databases.
It is crucial to understand when external dependencies are functioning well and when they are not since we frequently have control over their configuration even though we do not always have control over the code that is included within them. We also need to be able to differentiate between issues with our application and issues with dependencies.
From the viewpoint of a business transaction, we can recognize and quantify external dependencies as being in several tiers. External dependencies can sometimes be automatically discovered for standard protocols like HTTP and JDBC, but sometimes we need to set up the monitoring tool to identify methods that package external service calls.
For example, an insurance company using AS/400 and communicating with it using a proprietary protocol. That method call was recognized as an external dependence and its execution was credited to the AS/400.
However, they also had web service calls that could be recognized for us automatically. Additionally, external dependence behavior should be baselined and response times evaluated against those baselines, just like business transactions and the application tiers that make up them.
Business transactions give you the clearest overall picture of the performance of your application and can help you prioritize performance issues, but if you aren't paying attention, external dependencies can have a big impact on your applications in unexpected ways.
#3 Caching Strategy
Caches offer a method for keeping object instances locally to prevent this network round trip. Serving an object directly from memory is always faster than making a network request to fetch the object from a system like a database. Caches, however, might create their own speed issues if they are not set up properly. Too much data being loaded into the cache and improper cache sizing are common caching issues.
You must count the number of objects placed into the cache and then keep track of the proportion of those objects that are being used to evaluate the performance of a cache.
The number of objects being expelled from the cache and the cache hit ratio are the two main metrics to watch. The number of object requests that are satisfied from the cache rather than requiring a network trip to get the object is reported by the cache hit count, also known as the hit ratio.
It is a sign that you are loading too much data into the cache if the cache is huge, the hit ratio is tiny, and you are not seeing many objects expelled from the cache. In other words, your cache is big enough to hold a lot of data that isn't being used and isn't thrashing.
The cache size is another factor to take into account when assessing cache performance. Not accurately anticipating user behavior and how the cache will be used is a common issue when sizing a cache.
Consider a cache that is set up to hold 100 objects, but the application constantly requires 300 objects. The first set of objects will be loaded into the cache during the first 100 calls, but further calls won't be successful in finding the desired objects.
A least-recently-used (LRU) algorithm might be used to choose which object to remove from the cache to make place for the newly requested object.
To retrieve the object and subsequently put it in the cache, the request will need to run a network query. As a result, we spend more time managing the cache than we do serving objects. In this case, the cache is harming performance rather than improving it.
Due to Java's nature and the way it handles garbage collection, problems will be made worse by the constant addition and deletion of objects from the cache, which will result in more regular trash collection.
It is nearly always preferable to have no cache than a thrashing cache when you size a cache too tiny and the aforementioned behavior takes place. In this case, we refer to the cache as thrashing.

In this example, the application searches the cache for an object but is unable to locate it. The object is then added to the cache when it searches a networked external resource for it. Finally, the cache is full, thus something needs to be removed to create room for the new object before it can be added to the cache.
#4 Error Rates
There are numerous ways to examine error rates, but most developers choose high-level metrics. For example, they might look at error rates at the whole application level or the proportion of all failed HTTP transactions to total HTTP requests.
But there's an inner layer to this that's frequently ignored that has direct effects on the health of your application: error rates for particular transactions. Displaying the proportion of times, out of all calls, a specific method in your code fails and generates a reported error or exception.
But this information isn't very meaningful on its own, right?

After identifying the most urgent occurrences, such as logged errors or exceptions, that you should address, the next step is to identify their true root cause and fix it.
Additionally, we created a solution to this issue. You don't have to open log files and start seeking clues when using Atatus. On the same screen, you can access all of the server's status information which helps you in finding root causes and fixing issues faster. This covers many instances of each problematic call and includes the transaction trace, the actual source code, and the variable values.
#5 Garbage Collection
Garbage collection was one of the fundamental Java features offered from the time of its initial release, and it has proven to be both a blessing and a burden. When we complete using an object, we just destroy the reference to it, and garbage collection will automatically free it for us.
This relieves us of the burden of manually managing memory. You'll enjoy how this simplifies memory allocation and release if you're coming from a language like C or C++ that requires manual memory management. Additionally, the garbage collector releases memory on its own when there are no references to it.
Traditional memory leaks—which happen when memory is allocated and the reference to it is erased before the memory is released—are eliminated.
While eliminating manual memory management and liberating us from conventional memory leaks was the purpose of garbage collection, it did so at the expense of occasionally burdensome garbage collection procedures. Several garbage collection strategies that are available depending on the JVM you are using, but suffice it to say that you need to know how your garbage collector works and how to set it effectively.
The major, or full, garbage collection is regarded as the biggest foe of garbage collection. All JVMs, except the Azul JVM, have significant garbage collectors. There are two types of garbage collections in general:
- Minor
- Major
The purpose of minor garbage collections is to release transient objects, which happen very regularly. They rarely have a noticeable impact and do not cause JVM threads to stop operating.
However, because they stop all threads in the JVM while they are running, major garbage collections are also known as "Stop The World" (STW) garbage collections.
#6 Application Topology
Applications can now be elastic due to the cloud: your application environment can expand and contract based on user demand. To determine whether or not your environment is sized optimally, it is crucial to perform an inventory of your application topology. Your cloud hosting costs will increase if you have too many virtual server instances, but your business operations will suffer if you have too few.
In this examination, it's crucial to track two metrics:
- Business Transaction Load
- Container Performance
You should baseline business transactions and always be aware of the minimum number of servers required to meet your baseline. You may wish to add additional servers if your business transaction load spikes suddenly, such as to more than double the standard deviation of the normal load.
The performance of your containers is the other metric to monitor. You should specifically check to see whether any server tiers are under pressure. If they are, you may wish to add more servers to that tier.
An individual server may be under stress owing to variables like garbage collection, thus it's necessary to look at the servers throughout a tier. However, if a sizable portion of the servers within a tier are under strain, it may be a sign that the tier cannot manage the demand it is receiving.
It is crucial to evaluate each application component's performance and modify your topology as necessary because your application components can scale independently.
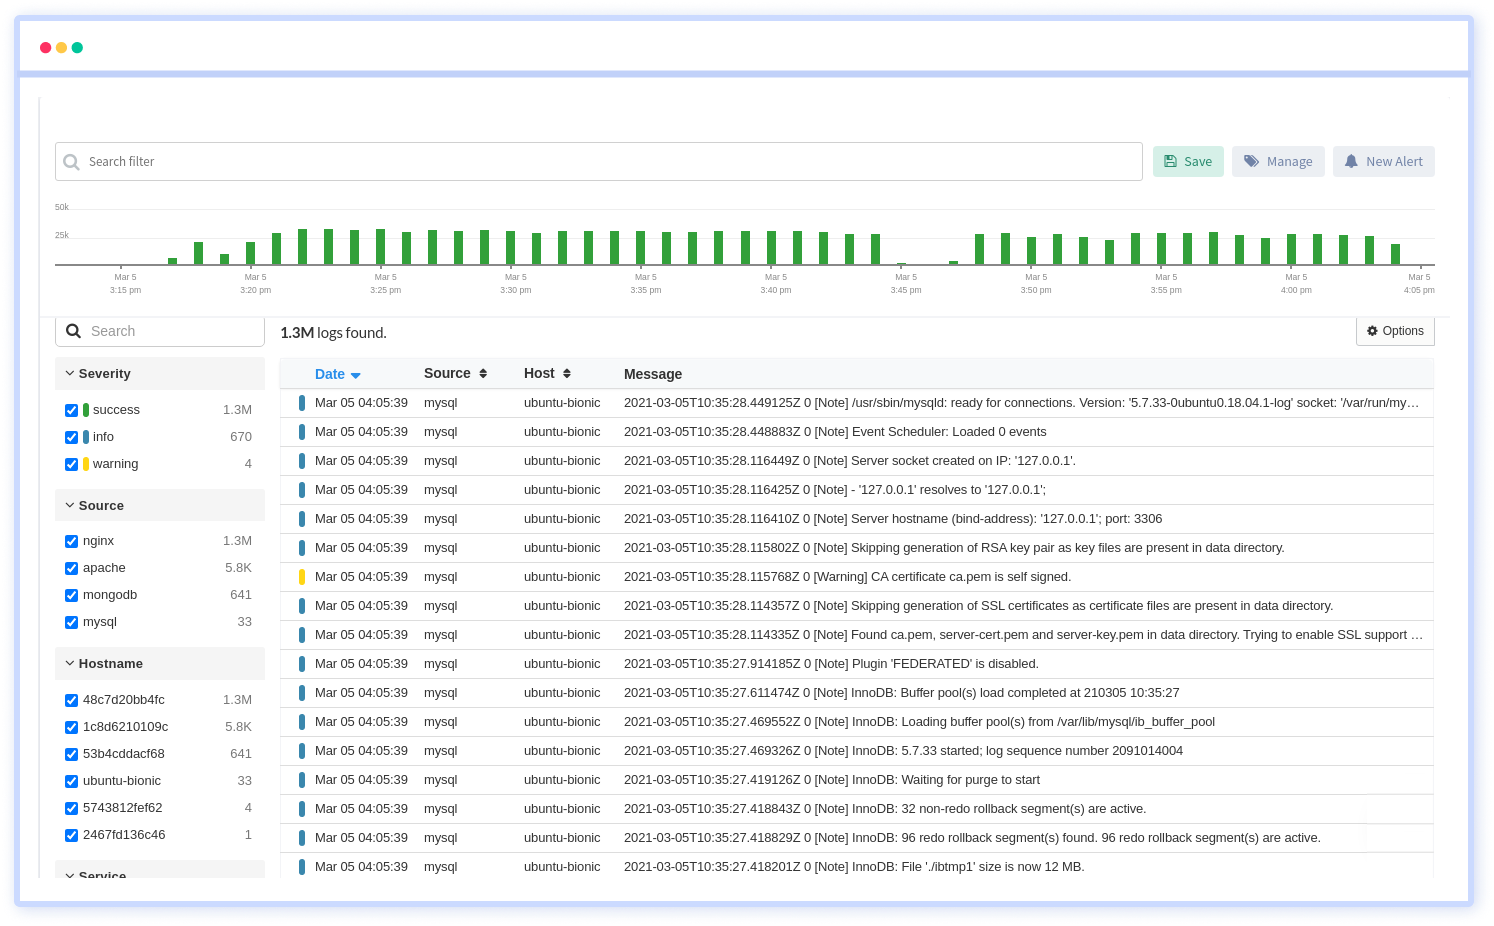
#7 Log Size
However, we still can't completely ignore logs. Logs have the unavoidable side consequence of continual growth. Bad things can happen if you don't monitor their size and the process you have in place for keeping them in check. Hard drives scream as logs come loose. Everything starts to slow down as your server starts to fill up with trash. Therefore, it's critical to keep a constant eye on them. It is an endless source of chaos.
The most common approach to a solution is to divide up the server's logs, then transfer them to storage or even just simple storage on S3, for example. Another option would be to simply roll over or delete them at some point, but by doing so, we run the danger of losing information because, like other developers, we haven't yet reduced our dependence on logs.
Atatus Log Management is delivered as a fully managed cloud service. It requires minimal setup and no maintenance at any scale. Therefore you can focus on your business rather than maintaining data pipelines.
Summary
Java has existed for 25 years, and applications continue to favor it as one of their preferred platforms. Java's functionality and programming flexibility increased concurrently with technological advancement, keeping it a useful language for more than 20 years. Outstanding examples of this progression include new garbage collection methods and memory management systems.
A top 7 list of metrics to measure when evaluating the health of your application was provided in this post. These were the top 7 metrics, in brief:
- Business Transactions
- External Dependencies
- Caching Strategy
- Error Rates
- Garbage Collection
- Application Topology
- Log Size
The field of software development is evolving, becoming more open and containing better data that contains rich contextual information in addition to simple numerical values. It will be interesting to see how everything plays out, and we look forward to working with you to create this new future.
Monitor Your Java Applications with Atatus
Atatus keeps track of your Java application to give you a complete picture of your clients' end-user experience. You can determine the source of delayed response times, database queries, and other issues by identifying backend performance bottlenecks for each API request.
To make bug fixing easier, every Java error is captured with a full stack trace and the specific line of source code marked. To assist you in resolving the Java error, look at the user activities, console logs, and all Java requests that occurred at the moment. Error and exception alerts can be sent by email, Slack, PagerDuty, or webhooks.
#1 Solution for Logs, Traces & Metrics
![]() APM
APM
![]() Kubernetes
Kubernetes
![]() Logs
Logs
![]() Synthetics
Synthetics
![]() RUM
RUM
![]() Serverless
Serverless
![]() Security
Security
![]() More
More

![Application Performance Monitoring (APM) Guide: Monitor and Optimize Application Performance - [2026 Update]](/blog/content/images/size/w960/2025/10/APM-GUIDE---Monitor-and-Optimize-Application-Performance.png)