Boosting Business Growth with Advanced BI Tools
In today's fast-paced and ever-evolving business landscape, organizations are constantly striving to gain a competitive edge, make well-informed decisions, and fuel their growth. As a result, advanced Business Intelligence (BI) tools have emerged, revolutionizing the way businesses harness the power of data to drive their success.
These sophisticated BI tools offer a wide range of capabilities, empowering companies to collect, analyze, and visualize data from various sources.
By extracting valuable insights into critical business metrics, trends, and patterns, these tools enable organizations to make data-driven decisions that optimize operations, identify growth opportunities, and ultimately propel business growth.
In this blog, we will explore the transformative potential of advanced BI tools and delve into their significant impact on accelerating business growth. By the end of this read, you will have a comprehensive understanding of how advanced BI tools can become catalysts for driving business growth.
Table Of Contents
- What is Business Intelligence?
- How does Business Intelligence work?
- Top Business Intelligence Tools
- Which one to choose?
- Success Stories of Businesses Boosted by Advanced BI Tools
What is Business Intelligence?
Business Intelligence (BI) refers to the use of technologies, processes, and methodologies to analyze and transform raw data into meaningful and actionable insights that can help organizations make informed business decisions.
It involves collecting and analyzing data from various sources such as internal and external databases, social media, customer feedback, and other sources to identify trends, patterns, and opportunities.
BI can be used to answer various business questions, such as how to optimize operations, improve customer experience, reduce costs, and increase revenue. It typically involves the use of specialized software tools and applications to collect, store, and analyze data, and generate reports, dashboards, and visualizations that help users gain insights and make informed decisions.
How does Business Intelligence work?
The key components of BI include data mining, data warehousing, data analysis, and reporting.
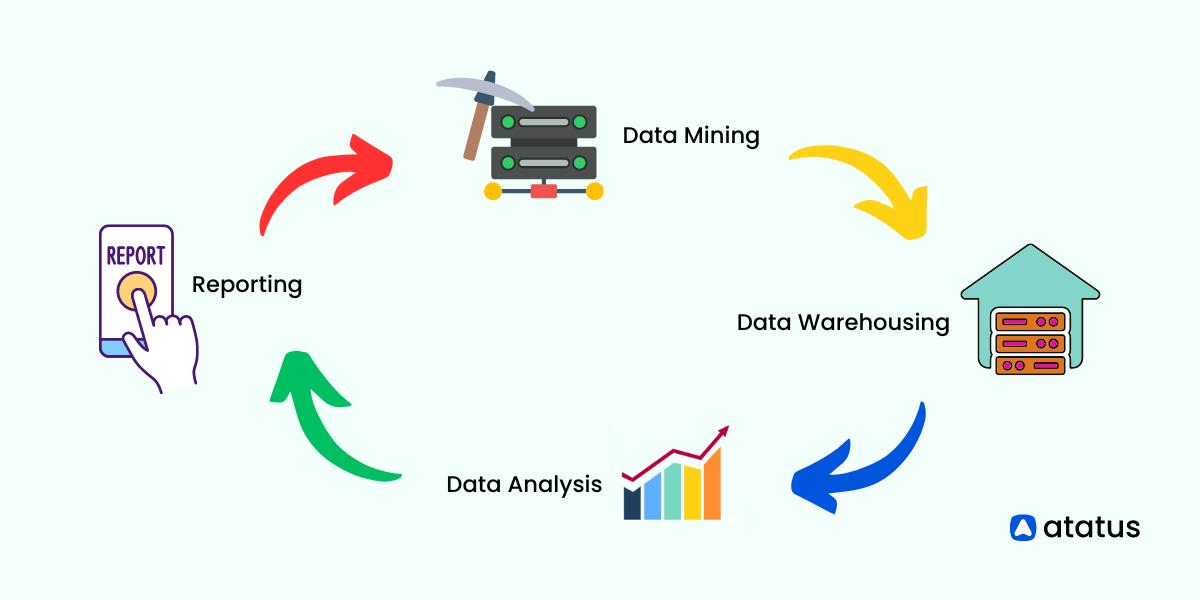
- Data mining involves discovering patterns and trends in large datasets using statistical and mathematical algorithms.
- Data warehousing involves storing large amounts of data in a centralized repository for analysis and reporting.
- Data analysis involves using various techniques to extract insights from data, such as data visualization, predictive modeling, and machine learning.
- Reporting involves creating reports and dashboards that summarize the results of data analysis and present insights in a meaningful and actionable way.
Why should we adopt business intelligence?
In this era of voluptuous content creation, data is only getting bigger and bigger. Many a time, it is not possible for businesses to manage them without such BI Tools. Also, there are many other benefits we derive from these, such as:
- Improved decision-making: BI provides insights and analytics that can help decision-makers make data-driven decisions.
- Increased efficiency: BI can automate data collection and analysis processes, saving time and resources.
- Competitive advantage: BI can provide insights into market trends and customer behavior, helping organizations gain a competitive edge.
- Better communication: BI can improve communication and collaboration between teams by providing a common understanding of data and insights.
- Increased revenue: BI can help identify opportunities for revenue growth by identifying new markets, products, or services.
What are the downsides of business intelligence tools?
Although BI can be regarded as a data organizer and a very good analysis mechanism for your business, not all might be able to afford it. Or even if you can afford, it may function much lesser than your expectation if the data sets fed to it are not of standard quality. Here are few parameters you should consider before adopting BI Tools:
- Data quality issues: BI relies on high-quality data, and poor data quality can lead to inaccurate insights and decision-making.
- Implementation complexity: Implementing BI tools can be complex and require significant technical expertise and resources.
- High costs: BI tools and implementation can be expensive, especially for small or mid-sized organizations.
- Security risks: BI tools may pose a security risk if they are not properly secured and managed, and data breaches can be costly.
- Resistance to change: BI requires a cultural shift in the organization towards data-driven decision-making, which can be met with resistance from employees who are used to making decisions based on intuition and experience.
Top Business Intelligence Tools
Since we have discussed the pros and cons of adopting a business-intelligence tool, let’s scourge through the most popular BI Tools available in the market today. We’ll take a look at the following:-
1. Apache Superset
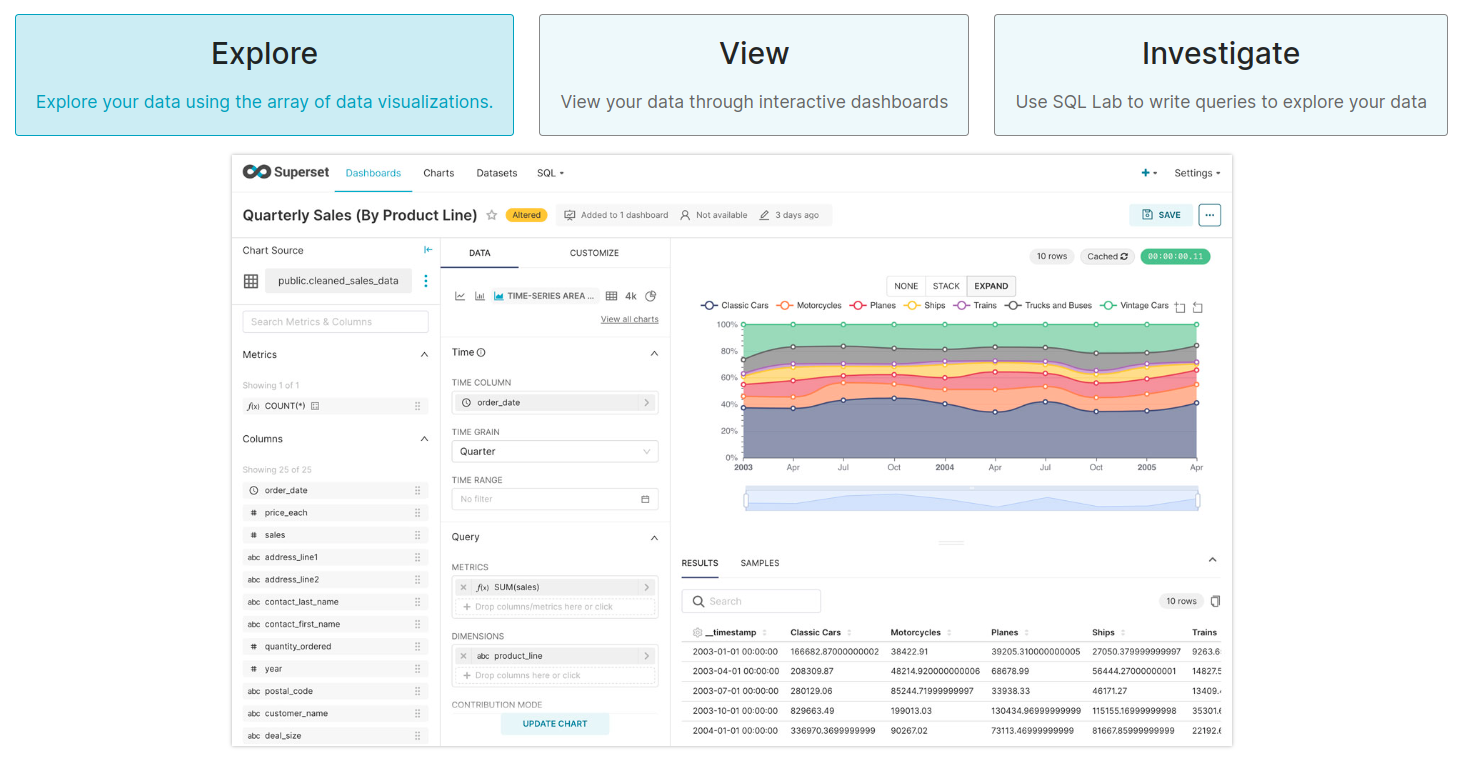
Apache Superset is a platform for data exploration and visualization that is available as an open-source solution. It offers a web-based interface through which users can interact with and analyze data from multiple sources. Superset is equipped with a broad selection of data connectors, enabling seamless integration with popular databases, and provides users with a variety of visualization options to generate engaging charts, graphs, and dashboards.
Features:
- Data Exploration: Superset empowers users with powerful features such as filtering, sorting, and grouping for comprehensive data exploration.
- Interactive Visualizations: It offers a rich collection of visualization options like charts, graphs, and maps, empowering users to analyze and present data effectively.
- Dynamic Dashboards: Superset allows the creation of interactive dashboards by combining multiple visualizations, filters, and controls into a unified view.
- SQL Editor: Users can conveniently write and execute SQL queries within the platform using Superset's SQL editor.
- Collaboration Capabilities: Superset promotes collaboration by facilitating dashboard and report sharing, as well as providing annotations and commenting features for visualizations.
- Security and Access Control: Superset ensures data security by offering user authentication and role-based access control, allowing administrators to manage permissions and data access efficiently.
- Scheduled Reports: Users can automate report generation and delivery through scheduled reports, which can be sent via email or other channels.
- Extensibility: Superset's extensibility allows users to extend its functionality by developing custom plugins and integrating with other tools and frameworks.
Benefits:
- Open-Source Nature: Apache Superset is freely available, allowing customization as per specific requirements.
- User-Friendly Interface: Its web-based interface is intuitive, enabling users to effortlessly explore and visualize data.
- Scalability: Superset efficiently handles large datasets and offers horizontal scaling capabilities.
- Wide Data Source Support: It seamlessly integrates with various data sources, including popular databases like MySQL, PostgreSQL, Apache Hive, and different file formats.
- Vibrant Community: Being an open-source project, Apache Superset benefits from an active community that contributes to its development and provides extensive support.
2. Microsoft Power BI
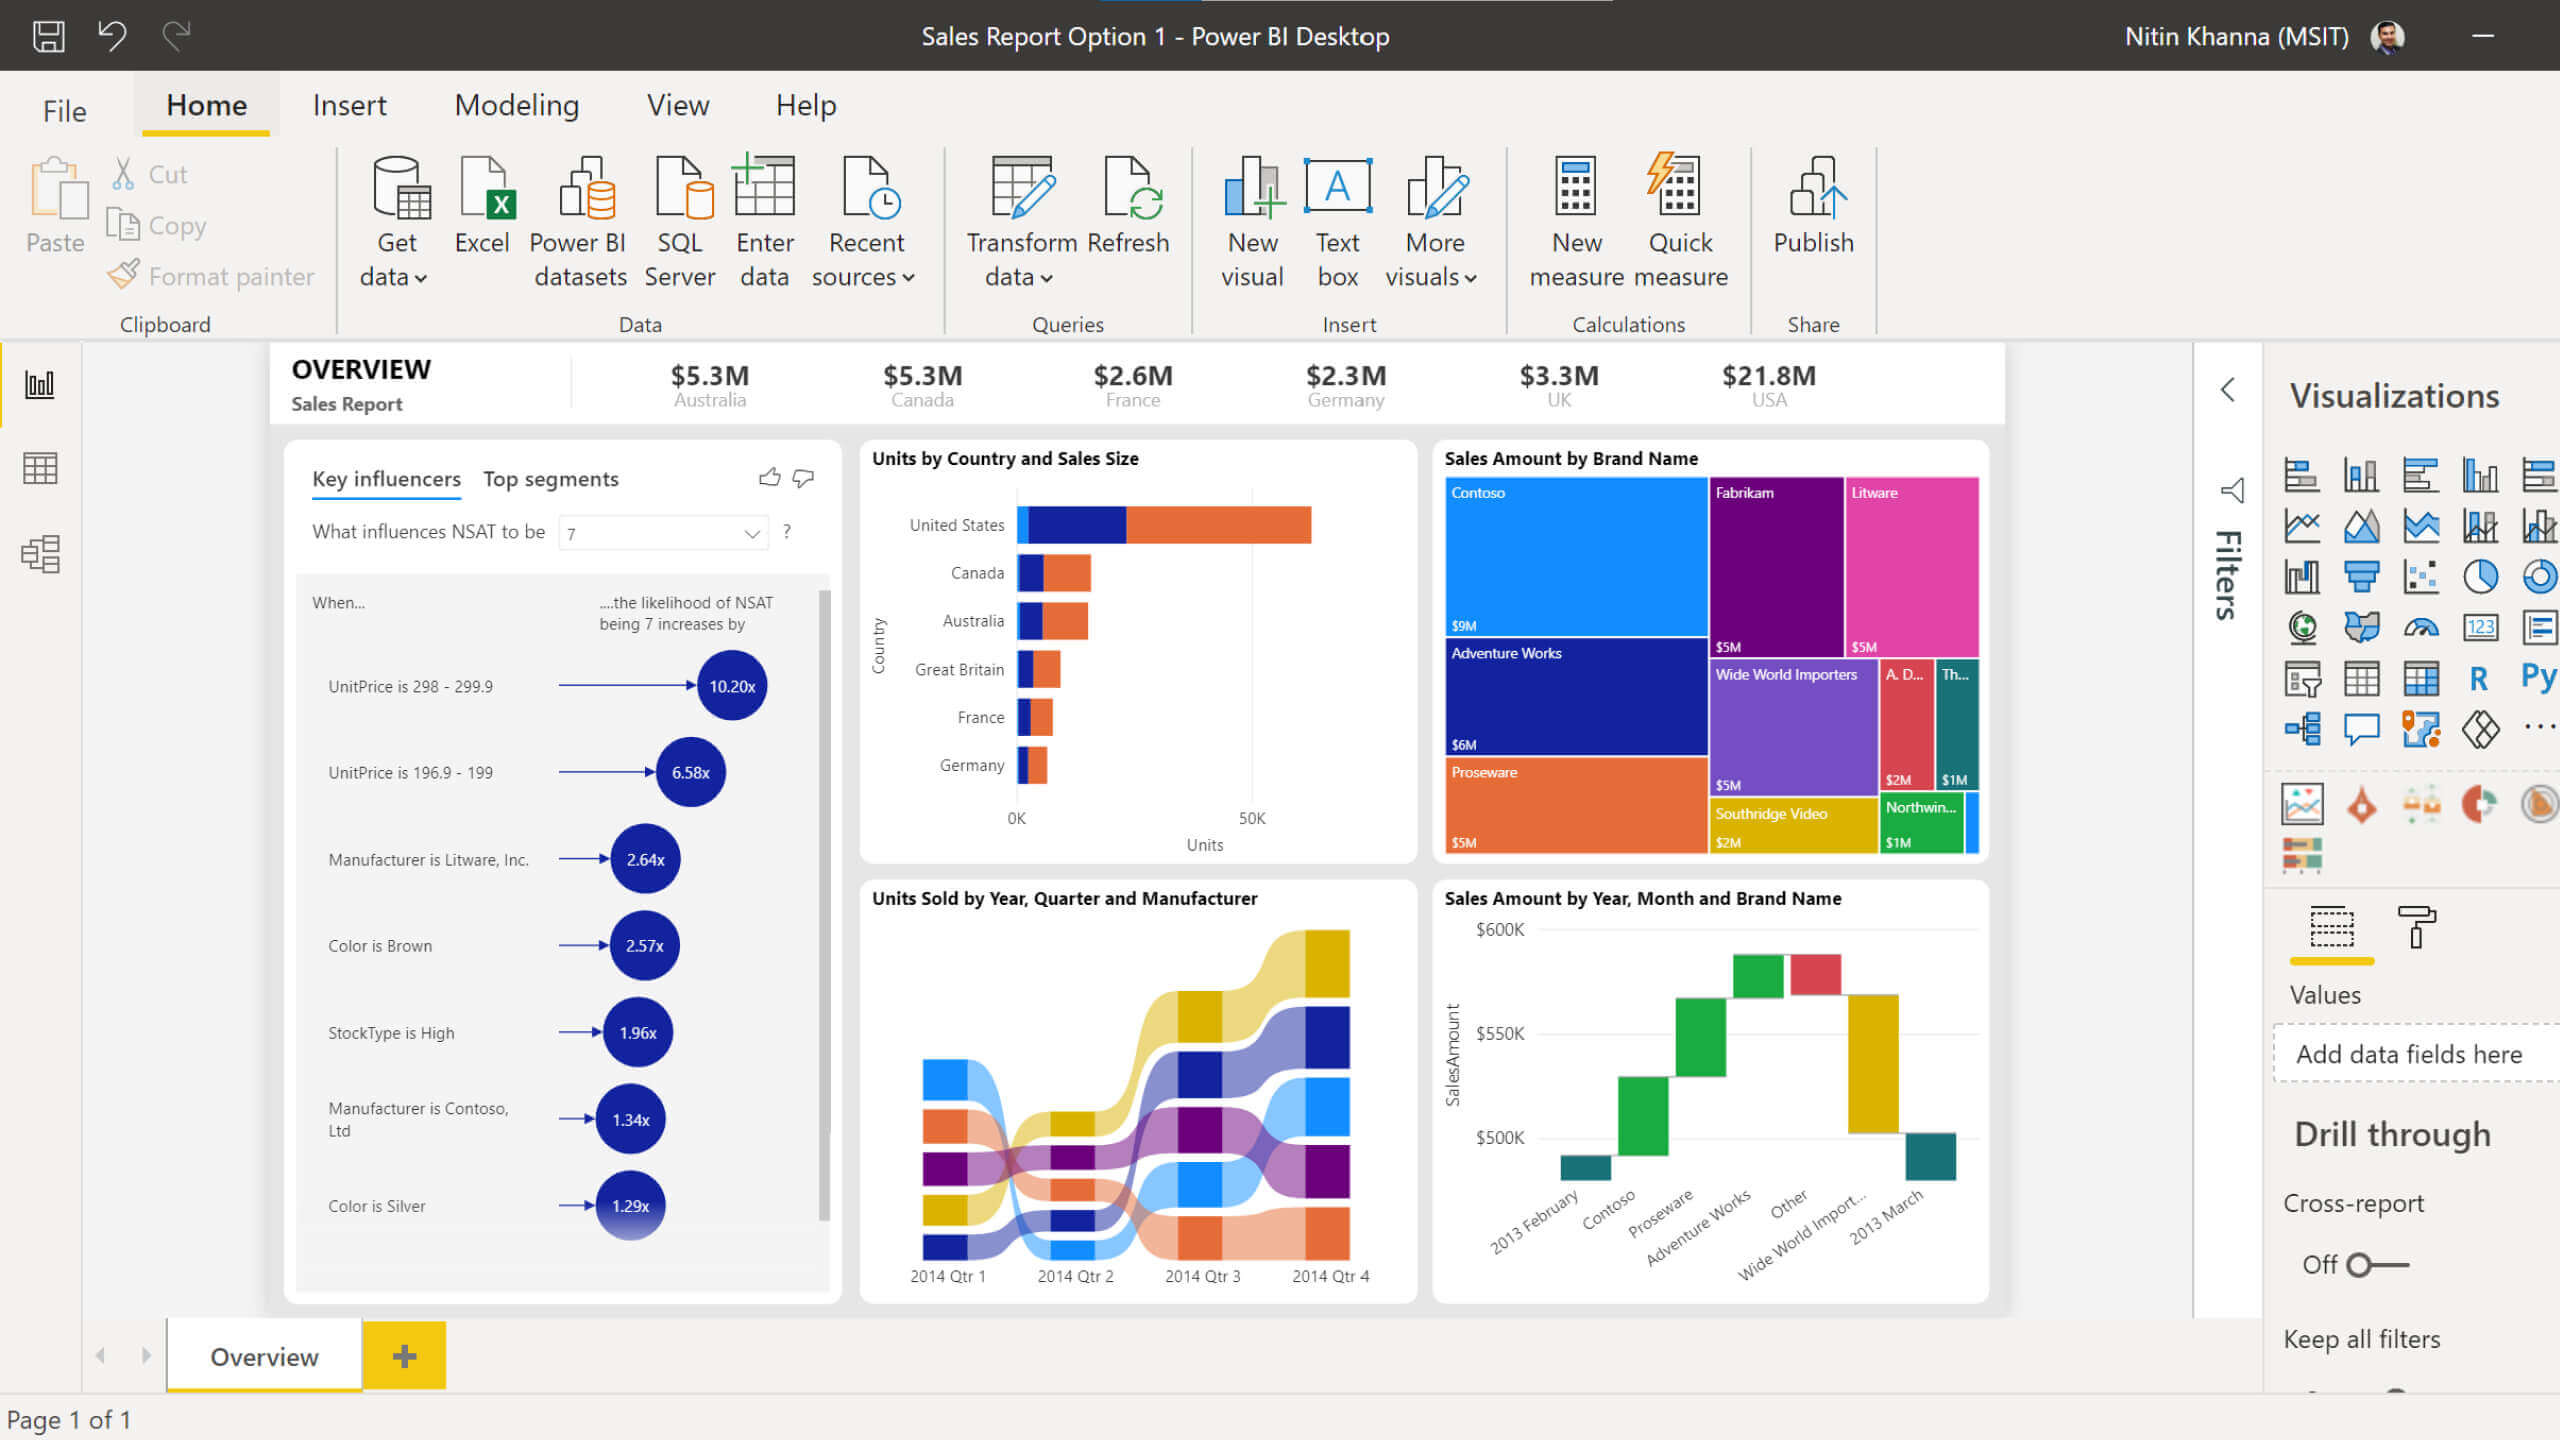
Microsoft Power BI offers a range of business intelligence (BI) tools. With it, organizations can connect, analyze, visualize, and share data effectively. With Power BI, users can make informed decisions, share insights effectively, and gain valuable insights from their data.
With Power BI, you can explore, visualize, and collaborate with data in many different ways. The tool allows users to connect to a variety of data sources, such as databases, cloud services, and files, as well as import and transform data for analysis. It offers a simple and intuitive user interface, allowing users to quickly create interactive dashboards, reports, and visualizations using the platform.
Features of Microsoft Power BI:
- Data Connectivity: Power BI allows users to connect to various data sources, including databases, online services, and files, to import and analyze data.
- Data Preparation: Power BI offers data transformation and cleansing capabilities, enabling users to shape and model data according to their needs.
- Data Visualization: Power BI provides a wide range of visualization options, including charts, graphs, maps, and tables, to present data in a visually appealing and insightful manner.
- Interactive Dashboards: Users can create interactive dashboards that consolidate multiple visualizations and provide real-time data monitoring and exploration.
- Natural Language Queries: Power BI supports natural language queries, allowing users to ask questions about their data using simple and conversational language.
- Mobile Accessibility: Power BI offers mobile apps for iOS and Android, allowing users to access and interact with their reports and dashboards on the go.
- AI and Machine Learning Integration: Power BI integrates with Azure Machine Learning and AI capabilities, enabling users to leverage advanced analytics and predictive modeling.
- Security and Governance: Power BI provides robust security features, including user authentication, role-based access control, and data encryption, ensuring data privacy and compliance.
Benefits of Microsoft Power BI:
- Data-Driven Decision Making: Power BI enables users to analyze and visualize data effectively, leading to data-driven decision-making processes.
- Self-Service Analytics: Power BI empowers business users to perform data analysis and visualization independently without relying on IT departments.
- Seamless Integration: Power BI seamlessly integrates with other Microsoft products and services, such as Azure and Office 365, allowing users to leverage existing infrastructure and tools.
- Cloud-Based Collaboration: Power BI's cloud-based nature facilitates collaboration, enabling teams to work together on reports and dashboards, providing a centralized platform for data sharing and insights.
- Scalability and Performance: Power BI can handle large datasets and provides fast and responsive performance, ensuring efficient data processing and visualization.
- Real-Time Insights: With real-time streaming capabilities, Power BI allows users to monitor data changes and make informed decisions promptly.
- Cost-Effective Solution: Power BI offers various pricing options, including a free version, making it accessible and cost-effective for businesses of all sizes.
- Rich Visualization Options: Power BI's extensive library of visualizations and customization options enables users to create engaging and impactful visual representations of their data.
3. Tableau Public
Tableau Public is a free, cloud-based Business Intelligence (BI) platform that provides a range of tools for data analysis, visualization, and sharing. It is designed for individuals, students, and organizations that want to share data stories with the public.
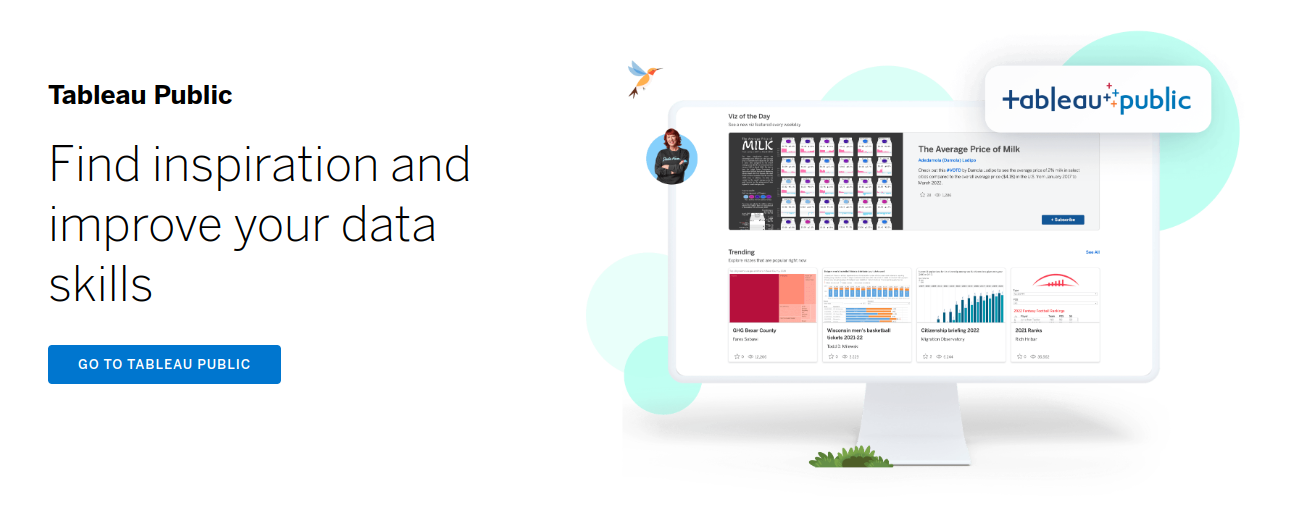
Here is how Tableau Public works:
- Data Collection: Tableau Public allows users to connect to various data sources, including spreadsheets, databases, and web services. Users can import data into Tableau Public or connect directly to the data source.
- Data analysis: Tableau Public provides a range of data analysis tools, including data blending, filtering, and aggregation. It allows users to explore data and extract insights quickly and easily.
- Visualization: Tableau Public provides a drag-and-drop interface that allows users to create interactive visualizations, including charts, graphs, and maps. It provides a range of customization options to tailor the visualization to the user's needs.
- Sharing: Tableau Public allows users to publish their visualizations to the Tableau Public server, where they can be shared with the public. Users can embed visualizations in websites or blogs, or share them on social media platforms.
- Collaboration: Tableau Public allows users to collaborate on visualizations with other users. They can share data, collaborate on analysis, and provide feedback on visualizations.
4. Qlik Sense
A modern and versatile business intelligence (BI) platform developed by Qlik, Qlik Sense. In addition to empowering users to explore data, create interactive visualizations, and share insights, it also provides self-service analytics capabilities.
This software facilitates the discovery, analysis, and collaboration of data with an easy-to-use interface and a variety of features.
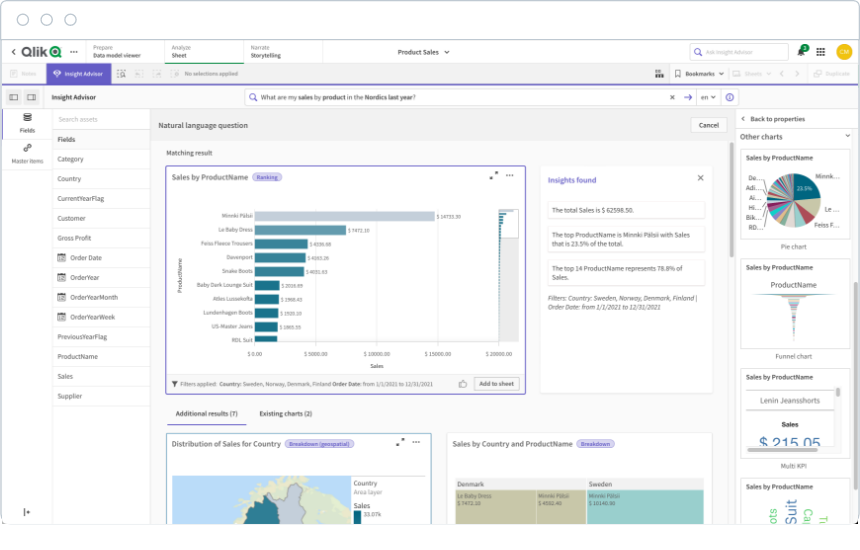
- Qlik Sense provides a user-friendly drag-and-drop interface, allowing users to effortlessly build visualizations and interactive dashboards without extensive coding or technical skills.
- Users can create a diverse range of interactive visualizations, including charts, graphs, maps, and tables, to explore and present data in a meaningful and engaging manner.
- With its smart search and associative data model, Qlik Sense enables users to make dynamic connections between data points and perform intuitive searches, uncovering valuable insights and patterns.
- Qlik Sense empowers users with self-service data exploration, enabling them to analyze data independently and discover insights without relying on predefined reports or queries.
- The platform supports responsive design, ensuring that visualizations and dashboards adapt seamlessly to different devices and screen sizes, allowing access from desktops, tablets, and smartphones.
- Collaboration and sharing capabilities in Qlik Sense enable users to share interactive visualizations, apps, and insights with others, facilitating real-time collaboration and data-driven decision-making.
- Qlik Sense offers data storytelling functionality, allowing users to combine visualizations, images, and narrative text to create compelling data stories that guide viewers through a coherent narrative and deliver impactful presentations.
- Integration with advanced analytics tools enables users to leverage statistical analysis, predictive modeling, and machine learning algorithms, empowering them to gain deeper insights and extract valuable knowledge from their data.
- Qlik Sense supports seamless connectivity and integration with various data sources, including databases, spreadsheets, cloud services, and APIs, enabling users to bring together and analyze data from multiple systems.
5. Metabase BI
Metabase is an open-source Business Intelligence (BI) tool that provides a simple and easy-to-use interface for data analytics and visualization. It is designed for non-technical users who need to explore data and create reports without advanced technical knowledge.

Here are some of the features and benefits of Metabase:
Features:
- Metabase provides a web-based interface that allows users to explore data and create reports without coding.
- It supports various data sources, including SQL databases, Google Analytics, and CSV files.
- It provides a wide range of data visualization tools, including charts, graphs, and maps.
- It supports advanced filtering and grouping options, allowing users to drill down and analyze data in various ways.
- It provides a simple and intuitive user interface that requires minimal training and technical knowledge.
- It supports various deployment options, including local, cloud, and server-based deployments.
Benefits:
- Metabase is open source and free to use.
- It provides a user-friendly interface that requires minimal technical knowledge.
- It supports a wide range of data sources and visualization tools, allowing users to perform a wide range of data analytics tasks.
- It provides a flexible and customizable interface, allowing users to create customized reports that meet their specific needs.
- It integrates well with other data analytics and visualization tools.
6. Redash
Redash is an open-source business intelligence (BI) tool that places a strong emphasis on query and visualization capabilities. With Redash, users can establish connections to multiple data sources, generate visualizations, and collaborate on queries and dashboards.
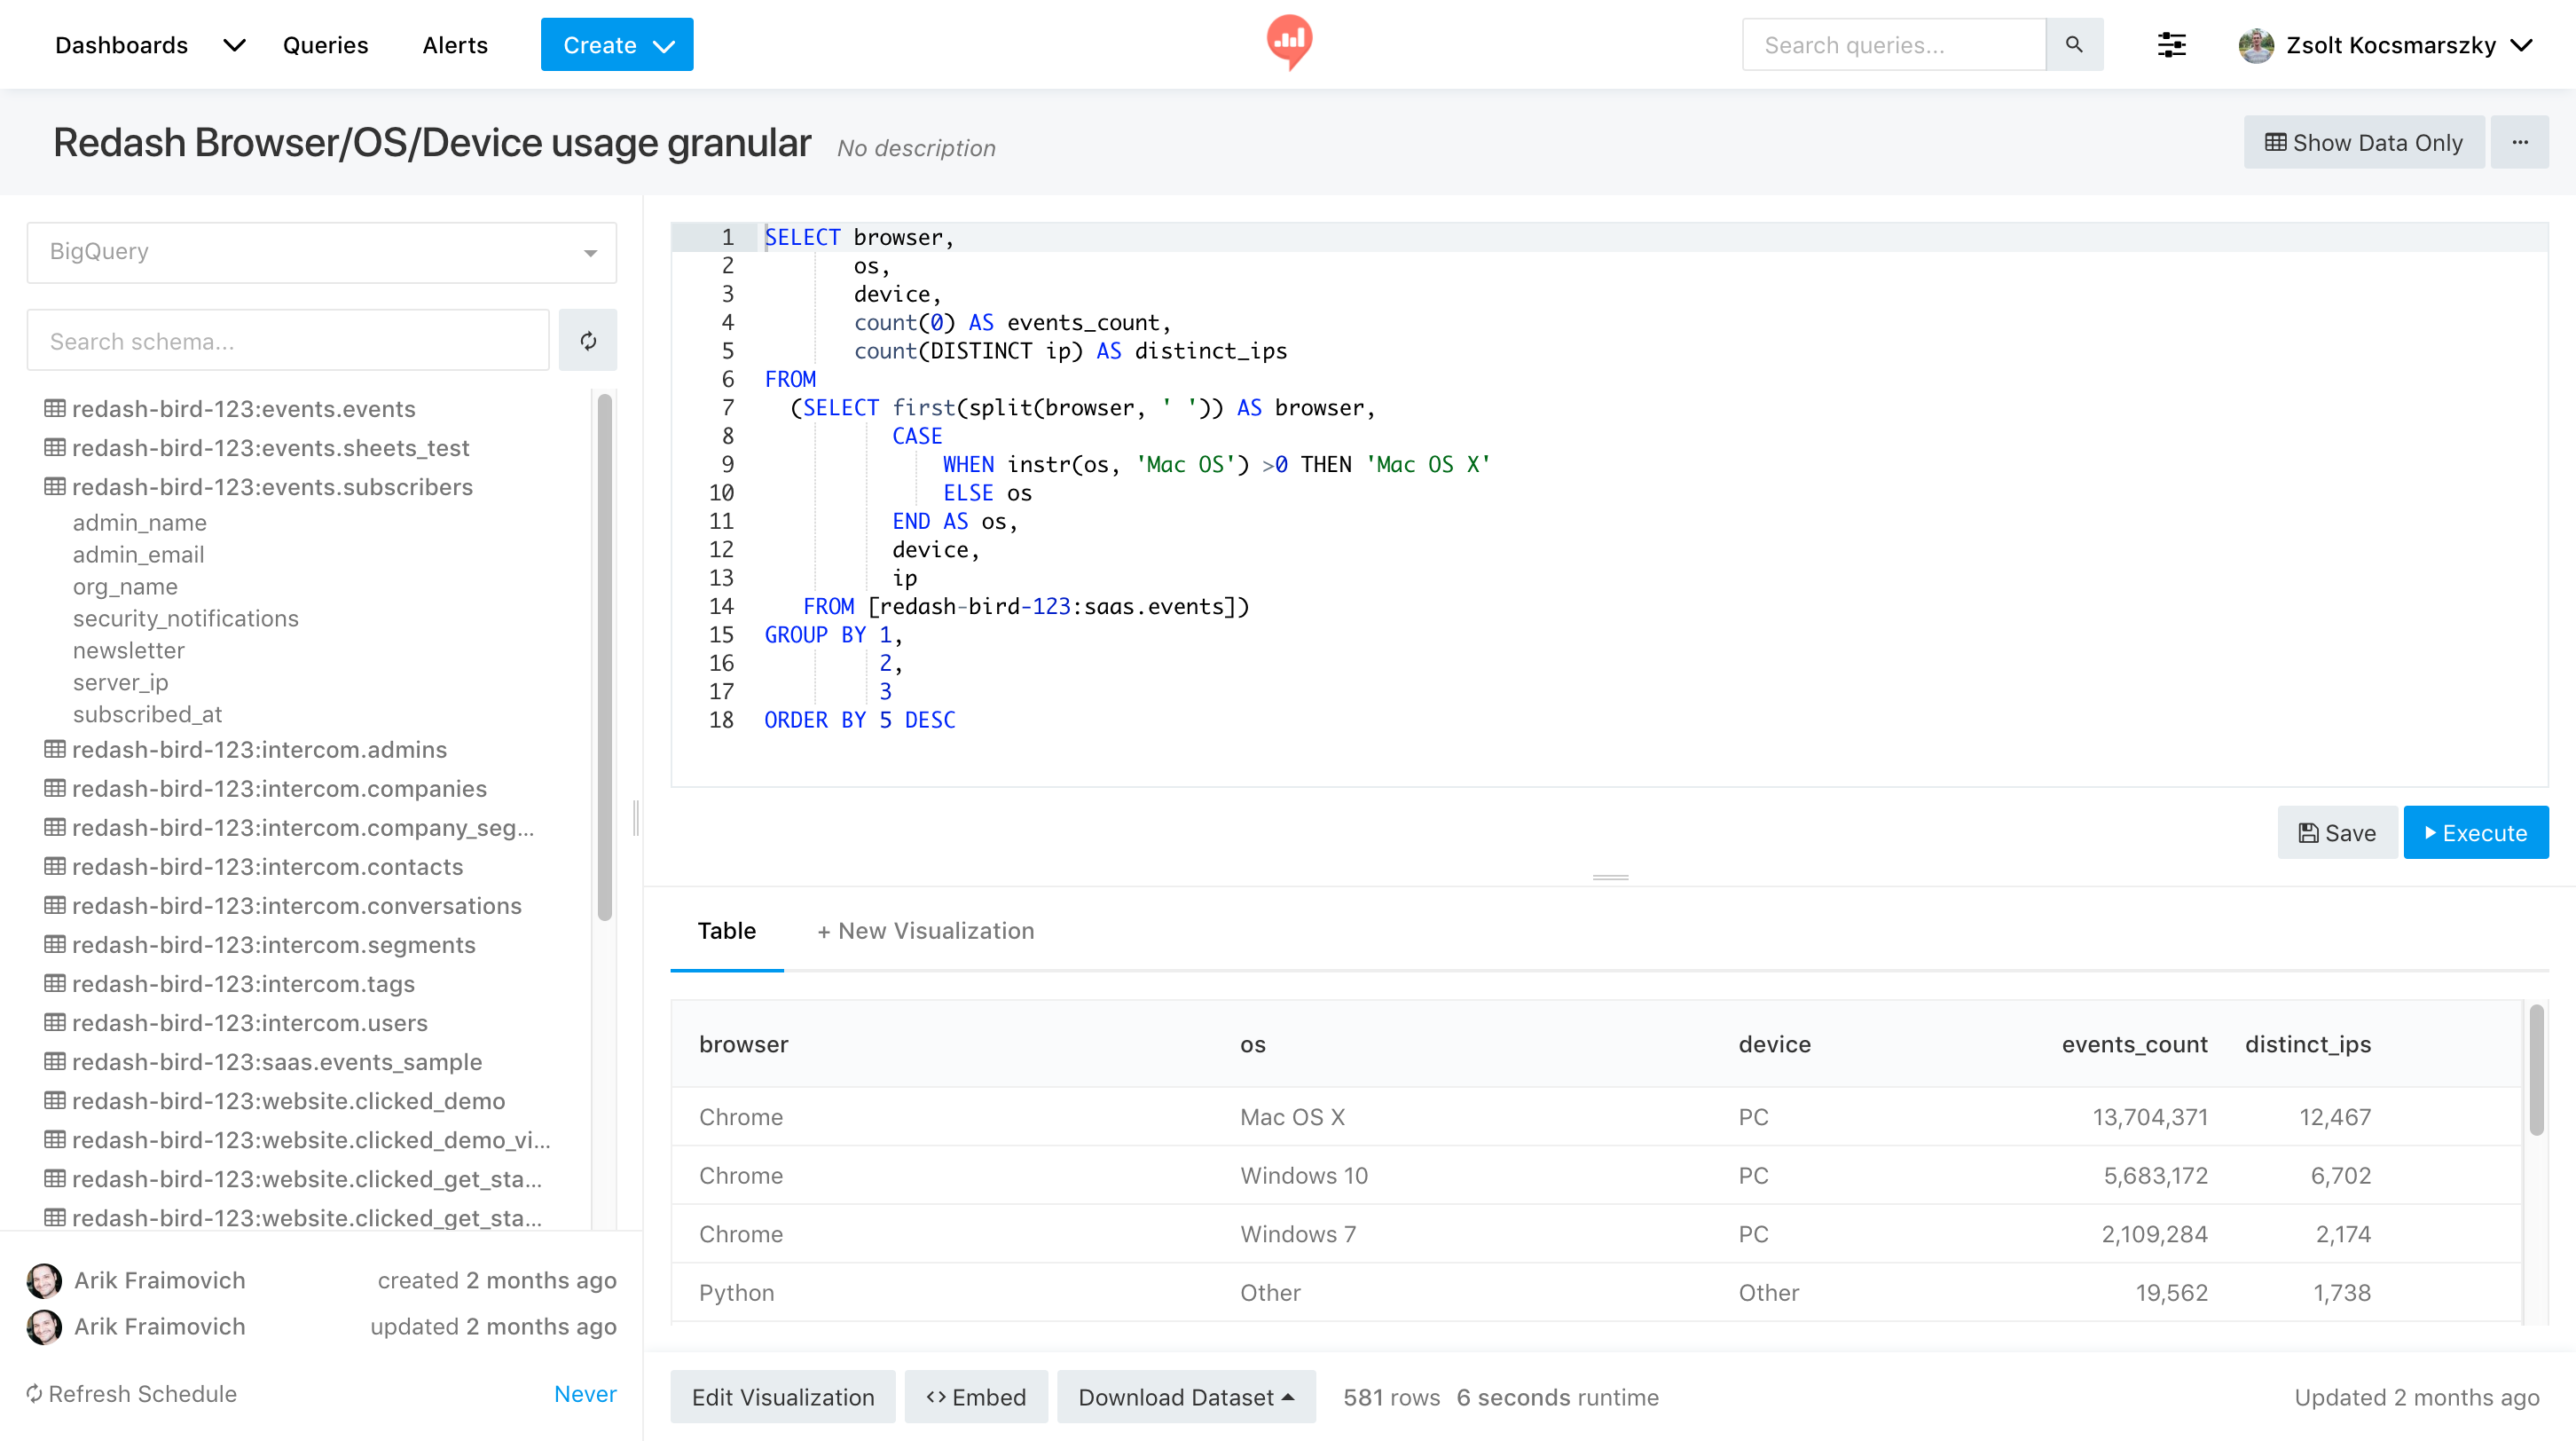
- Open-Source Flexibility: Being open-source, Redash provides the flexibility for customization and extensibility, allowing users to tailor the tool to their unique needs and integrate it with other systems.
- Powerful Querying: Redash provides robust querying capabilities, enabling users to extract insights from their data by running ad-hoc queries and exploring data interactively.
- Versatile Data Source Connectivity: Redash supports connectivity to various data sources, including databases, APIs, and third-party services, offering flexibility in integrating and analyzing data from different systems.
- Interactive Dashboards: Users can build interactive dashboards by combining visualizations and reports, providing a centralized view of their data for real-time monitoring and analysis.
- Ad-hoc Data Exploration: Redash enables users to explore data on-the-fly through ad-hoc queries, allowing for quick insights and deeper analysis of specific questions.
- Embedding and Integration: Redash offers embedding and integration capabilities, enabling users to seamlessly integrate dashboards and visualizations into other applications or websites.
- Data Security and Access Control: Redash ensures data security by implementing user access controls, authentication mechanisms, and permissions management, safeguarding sensitive information.
7. KNIME
KNIME (Konstanz Information Miner) is an open-source Business Intelligence (BI) tool that provides a platform for data analytics and machine learning. It is designed for data scientists, analysts, and IT professionals who need to perform data analytics and automate data-driven workflows.
Features:
- KNIME provides a visual workflow editor that allows users to create and execute data analytics workflows without coding.
- It supports various data sources, including SQL databases, Excel files, and CSV files.
- It provides a wide range of data transformation and manipulation tools, including data cleaning, data filtering, and data merging.
- It supports various data visualization tools, including charts, graphs, and interactive dashboards.
- It integrates with various machine learning algorithms, allowing users to perform predictive analytics and classification tasks.
- It supports various deployment options, including local, cloud, and server-based deployments.
Which one to choose?
Choosing the right tool has always been a difficult task. We need to consider a lot of parameters before choosing the right tool for our program. From the ones discussed above, we can segregate them into different heads based on their functionality.
Firstly, all of the tools discussed here are open-source, so you should not have a problem with finances for trying them out. Metabase, knime, Birt and SpagoBI allows to import data directly without any coding. This can be beneficial for users from non-technical background.
All of these tools allow customization with a drag-and-drop feature for creating interactive visualizations. Birt integrates well with other Eclipse-based Tools. You can find data similar data analysis capabilities across all these tools. It ranges from data blending, filtration to aggregation.
SpagoBI, Pentaho and Tableau Public allow sharing of analysis reports across other users too meanwhile Tableau Public also allows users to collaborate within the platform to share and provide feedback on graphs, pivot tables etc.
Success Stories of Businesses Boosted by Advanced BI Tools
Here are a few real-world examples of businesses that have experienced significant growth and success by leveraging advanced BI tools:
- Netflix: Netflix, the renowned streaming service, owes much of its triumph to its data-driven approach. By harnessing advanced BI tools, Netflix analyzes viewer behavior, preferences, and engagement patterns to deliver personalized content recommendations. This data-driven strategy has resulted in remarkable growth, with Netflix boasting a subscriber base exceeding 209 million users worldwide as of 2021.
- Amazon: Amazon, the e-commerce behemoth, heavily relies on advanced BI tools to propel its business growth. Through comprehensive data analysis and customer insights, Amazon optimizes its product recommendations, pricing strategies, and supply chain management. The impact of this data-driven approach is evident in Amazon's impressive financial performance, with its net sales surging from $280.5 billion in 2019 to $386 billion in 2020.
- Starbucks: Starbucks, the global coffee chain, leverages advanced BI tools to enhance its customer experience and drive growth. By leveraging data analysis and customer preferences, Starbucks fine-tunes its store locations, product offerings, and loyalty programs. This data-driven approach has been instrumental in Starbucks' success, as evidenced by its global net revenues reaching $23.5 billion in 2020.
- Uber: Uber, the renowned ride-sharing platform, heavily relies on advanced BI tools to optimize its operations and provide a seamless user experience. By analyzing real-time data on ride requests, driver availability, and traffic patterns, Uber fine-tunes its dynamic pricing algorithms and minimizes wait times. The data-driven approach has been instrumental in Uber's growth, as reflected in the completion of 1.35 billion trips globally in 2020.
- Coca-Cola: Coca-Cola, the global beverage giant, harnesses advanced BI tools to drive its marketing strategies and gain consumer insights. By analyzing sales data, social media trends, and customer feedback, Coca-Cola tailors its marketing campaigns, product launches, and pricing strategies to specific target audiences. This data-driven approach has significantly contributed to the company's growth, as reflected in its net operating revenues of $33 billion in 2020.
Conclusion
In conclusion, the integration of advanced BI tools into business operations offers a multitude of benefits that directly contribute to accelerated growth. By harnessing the power of data analytics and reporting, organizations can gain valuable insights into customer behavior, market trends, and operational performance.
This empowers decision-makers to make informed choices and develop strategies that align with the ever-changing business landscape. The real-time nature of these tools enables businesses to stay agile and responsive, ensuring they are always one step ahead of the competition.
Furthermore, advanced BI tools provide a solid foundation for optimizing processes and improving operational efficiency. By identifying bottlenecks, streamlining workflows, and automating manual tasks, organizations can eliminate inefficiencies and make the most of their available resources.
This not only boosts productivity but also allows for better resource allocation, ensuring that time, money, and efforts are directed towards activities that drive growth and generate tangible results.
Monitor Your Entire Application with Atatus
Atatus is a Full Stack Observability Platform that lets you review problems as if they happened in your application. Instead of guessing why errors happen or asking users for screenshots and log dumps, Atatus lets you replay the session to quickly understand what went wrong.
We offer Application Performance Monitoring, Real User Monitoring, Server Monitoring, Logs Monitoring, Synthetic Monitoring, Uptime Monitoring and API Analytics. It works perfectly with any application, regardless of framework, and has plugins.

Atatus can be beneficial to your business, which provides a comprehensive view of your application, including how it works, where performance bottlenecks exist, which users are most impacted, and which errors break your code for your frontend, backend, and infrastructure.
If you are not yet a Atatus customer, you can sign up for a 14-day free trial .
#1 Solution for Logs, Traces & Metrics
![]() APM
APM
![]() Kubernetes
Kubernetes
![]() Logs
Logs
![]() Synthetics
Synthetics
![]() RUM
RUM
![]() Serverless
Serverless
![]() Security
Security
![]() More
More
