What is Bashtop? Setup, Commands, and Shortcuts

Usually, we have top and htop to monitor the Linux system and get to know the running processes along with CPU and Memory utilization. But these commands have certain limitations which refrain them from giving a detailed overview of the system performance.
This limitation is overcome by the alternative called Bashtop. In this blog, we will learn about Bashtop, its advantages, and disadvantages along with its shortcuts and installation guide.
Table of Contents
- What is Bashtop?
- Pre-requisites of Bashtop
- Bashtop Installation
- Launching Bashtop
- Other Shortcuts in Bashtop
- Bashtop features
- Advantages of Bashtop
- Disadvantages of Bashtop
What is Bashtop?
Bashtop is a resource monitoring utility in Linux which is terminal based. When launched, it displays the statistics of the CPU, memory along with the running processes, bandwidth, and so on.
Using Bashtop, we can sort processes and also can switch between the various sorting options available. Bashtop can be installed in MAC and FreeBSD too.
Pre-requisites for Bashtop
Before installing Bashtop, there are some prerequisites to be fulfilled. Make sure you have the following before installing Bashtop.
- Bash version 4.4 or above.
- GNU Coreutils.
- GNU command-line tools include sed, awk, grep, ps, and curl.
- Python3.6 or above and PSUTI(version 5.7.0 or above).
- Git.
Bashtop Installation
Now, let us have a look at the installation of Bashtop in various Linux systems like Ubuntu, Fedora, CentOS, Debian and Arch Linux.
How to install Bashtop in Ubuntu
We can install bashtop on Ubuntu using the following two ways.
Using APT package manager
In order to install Bashtop using the APT package manager, we need to append the Bashtop PPA first.
$ sudo add-apt-repository ppa:bashtop-monitor/bashtop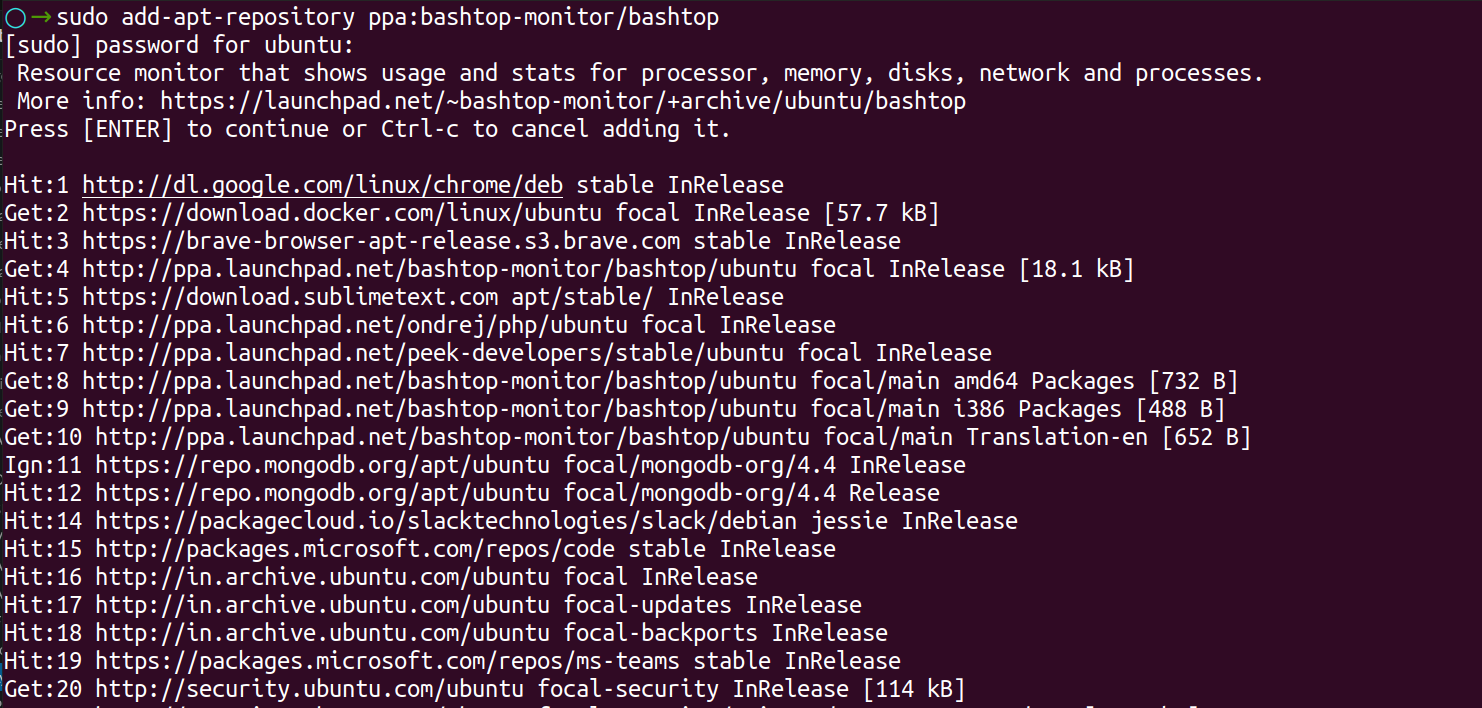
We can install Bashtop now using the following command
$ sudo apt install bashtop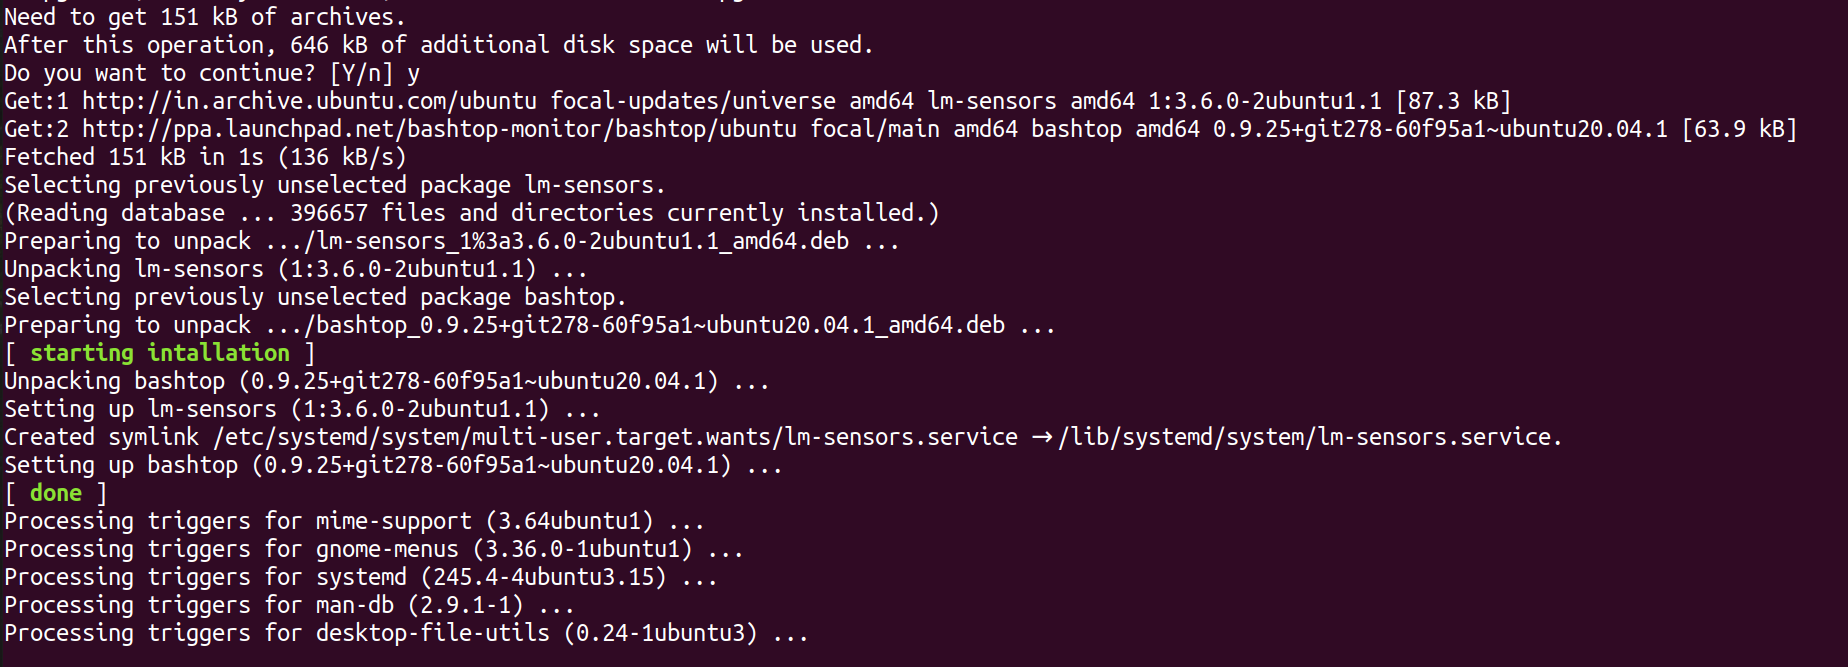
Using snap
Use the following command to install bashtop using snap.
$ snap install bashtop

If the snap is not installed, install it using the following command
$ apt-get install snapdTo uninstall it, use this command
$ apt-get remove snapdTo know the version, the command is
$ snap --version
Install Bashtop in Debian
Since, bashtop is already available in Debian’s official repository, running the following command is enough to install it.
$ sudo apt install bashtopInstall Bashtop in CentOS / RHEL8
In order to install Bashtop in CentOS/RHEL8, we need to enable the EPEL repository first.
$ sudo yum install epel-release
Once the EPEL repository is installed, we are ready to install the bashtop through the command line
$ sudo dnf install bashtopInstall Bashtop in Fedora
To install Bashtop in Fedora, run the following
$ sudo dnf install bashtopInstall Bashtop in Arch Linux
To install Bashtop in Arch Linux, run the command below
$ sudo pacman -S bashtopLaunching Bashtop
After installing Bashtop, we are going to launch Bashtop in Linux.
To launch Bashtop, just use the following command
$ bashtopRunning the above command will produce an output as in the screenshot below:
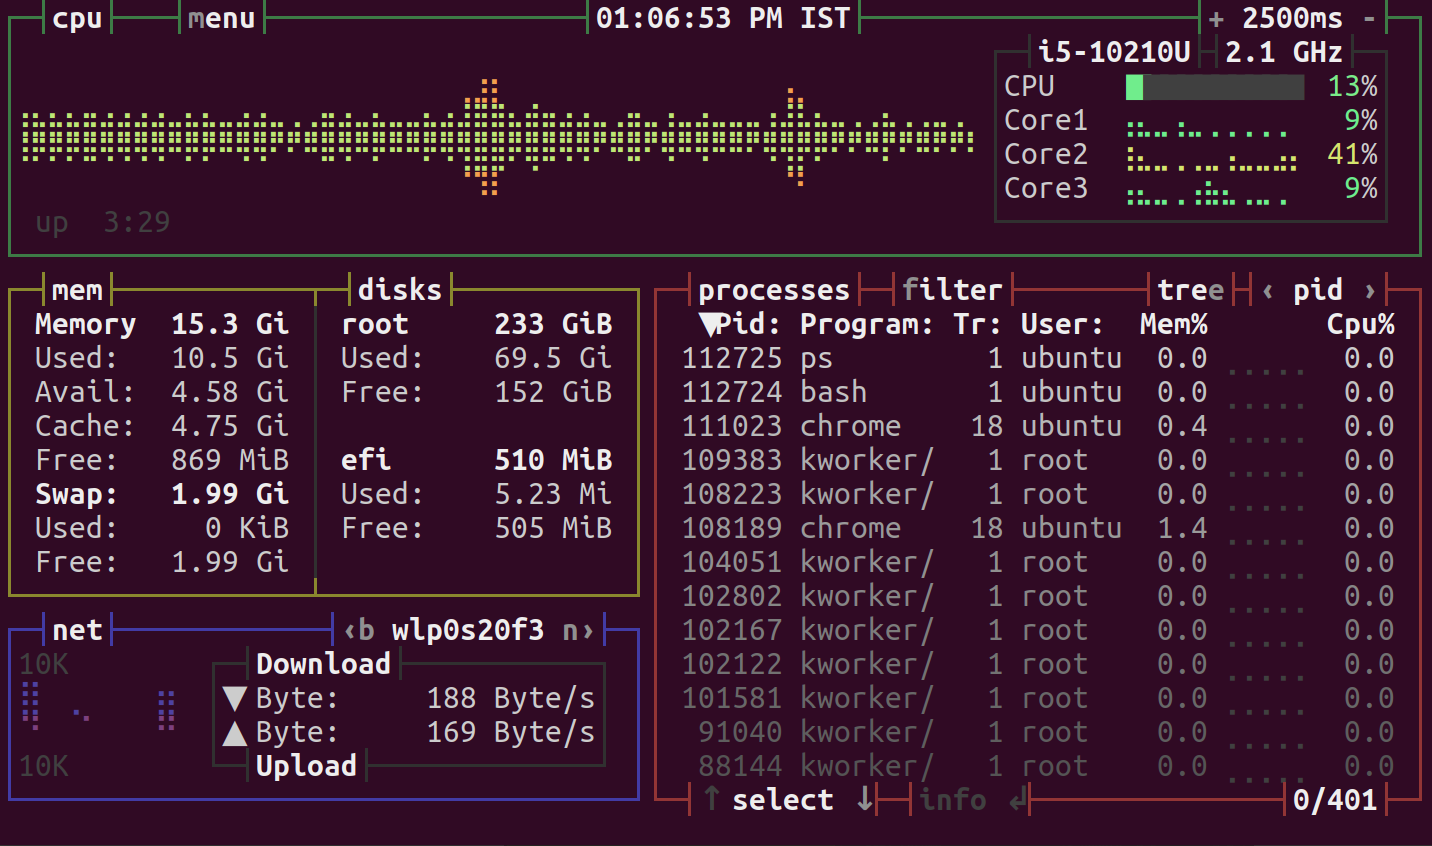
The bashtop command displays the following details:
- CPU usage graph
- Processor clock speed
- Total CPU usage
- Usage of each CPU core
- Total RAM
- Used RAM
- Free RAM
- Cache memory
- Available cache memory
- Swap usage (used and free)
- Current read and write speeds for disks
The default refresh rate for bashtop is 2500 milliseconds. You can increase it by pressing +, A, a which adds 100 ms to the update timer.
To decrease press -, S, s which subtracts 100 ms from the update timer.
Clicking the UP and DOWN arrow keys will allow you to navigate to and view the detail of the processes. Pressing ENTER will display more information about those processes. The left and right arrow keys allow you to switch between columns.
Use the PgUP and PgDn keys to move to the next page. With the Home and End keys, you can easily navigate to the first and last pages.
The process section provides the following details:
- Pid - process ID
- Program - process name
- Threads
- User - owner of the process
- Mem% - memory usage of the process
- Cpu% - CPU usage of the process
To close the selected process hit ENTER key.
If you want to filter a process, simply press F or f and type the name of the process. For example you can view all the processes associated with the string you have entered if you type "bash".
Other Bashtop shortcuts
Let us look at the keyboard shortcuts in bashtop.
| Keys | Function |
|---|---|
| Esc, M, m | It shows the main menu. |
| F2, O, o | It shows options. |
| F1, H, h | It shows the help. |
| Ctrl-C, Q, q | It quits the program. |
| b, B | it selects the previous network device. |
| n, N | it selects the next network device. |
| C, c | It clears any entered filter selected. |
| E, e | It toggles processes tree view. |
| F, f | It inputs a string to filter processes with. |
| I, i | It interrupts the selected process with SIGINT - 2. |
| K, k | It kills the selected process with SIGKILL - 9. |
| R, r | It reverses sorting order in the processes box. |
| T, t | Terminate the selected process with SIGTERM - 15. |
Features of bashtop
- Besides having a beautiful user interface, it also has mouse support.
- With a customizable menu, it has a terminal inspired by games.
- Configuration options can be modified through a menu.
- Processes can be filtered by users.
- An auto-scaling graph is used to display network metrics.
- In addition, it can send SIGTERM, SIGKILL, and SIGINT to processes that are in use.
Advantages of Bashtop
- It has an easy-to-use interface that provides a system stats overview.
- It is also compatible with FreeBSD and MAC.
- It is available in the official repos of Ubuntu 20.10 and Centos8.
Disadvantages of Bashtop
- It consumes more CPU and RAM when compared to top and htop.
- It requires bashv4.4 or above which is not friendly to the CentOS version.
Conclusion
Bashtop remains an excellent tool to monitor the system’s running processes, CPU, and Memory Utilization among the other tools like top and htop. Its responsive terminal UI with a customizable menu makes it stand apart from other command line tools like top and htop.
Since it has a neat arrangement along with various display sections it is way easier to have a look at the overview of the system’s resources. It acts as a great resource monitoring tool not only in Linux but also in MAC and FreeBSD.
Monitor API Failures with Atatus
Monitoring API failures in production is very hard. You'll need tools like Atatus to figure out which APIs are failing, how often they're failing, and why they're failing.
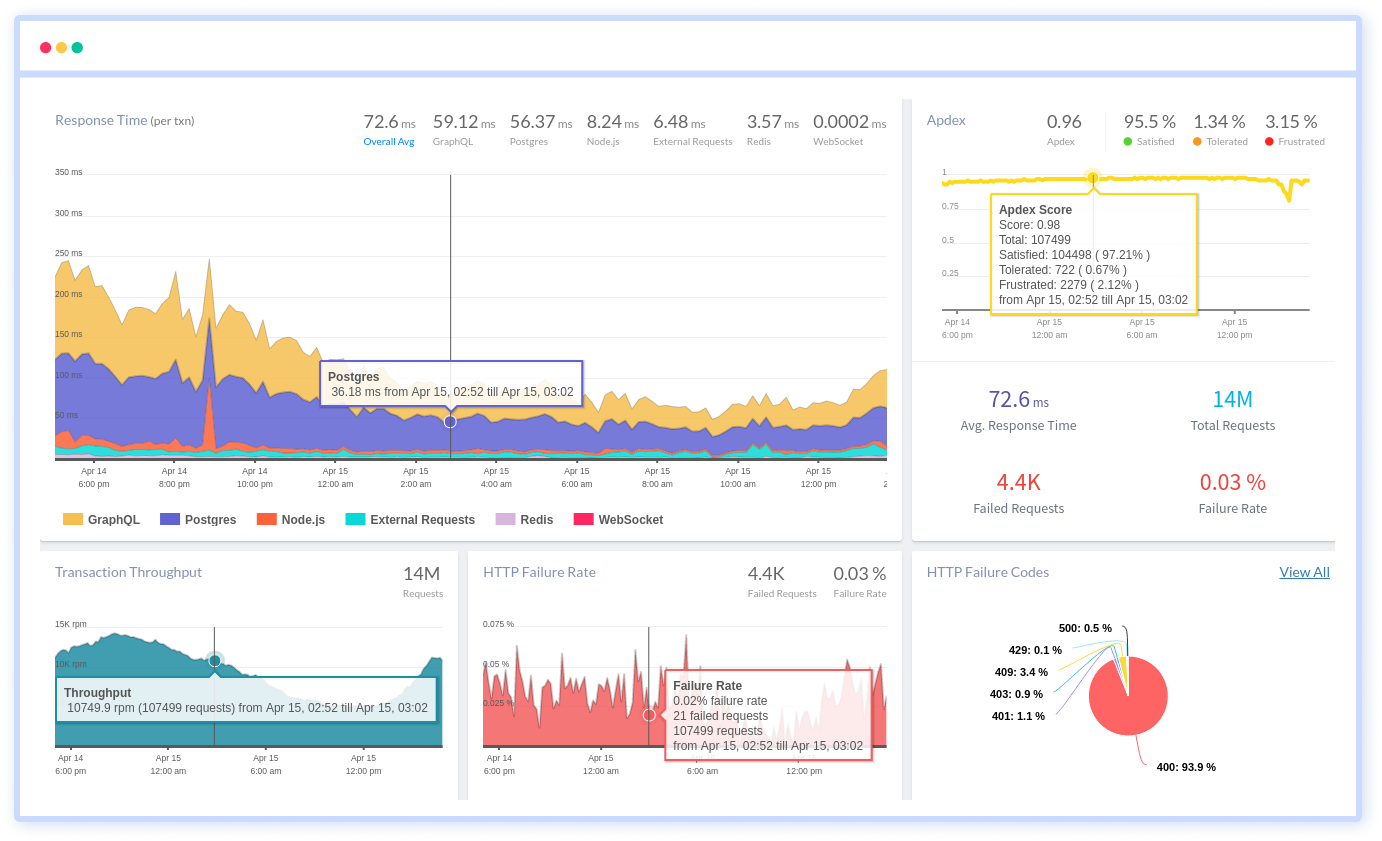
You can see the most common HTTP failures and get detailed information about each request, as well as custom data, to figure out what's causing the failures. You may also view how API failures are broken down by HTTP Status Codes and which end-users have the most impact.
#1 Solution for Logs, Traces & Metrics
![]() APM
APM
![]() Kubernetes
Kubernetes
![]() Logs
Logs
![]() Synthetics
Synthetics
![]() RUM
RUM
![]() Serverless
Serverless
![]() Security
Security
![]() More
More