Serverless Applications: Why Monitoring is Essential for Speed and Reliability
Serverless applications are becoming the go-to architecture for modern developers. Startups and enterprises are building serverless applications because they offer scalability, cost-efficiency, and flexibility. However, these advantages come with unique challenges, especially when it comes to monitoring serverless applications.
Traditional server monitoring tools fail to capture short-lived functions, making serverless application monitoring essential for maintaining performance and reliability.
In this blog, we will explore why performance monitoring is different for serverless applications, the key metrics to track, and best practices for effective serverless application monitoring.
In this Blog,
- What Makes Serverless Applications Different?
- The Risks of Ignoring Serverless Application Monitoring
- Why Monitoring Serverless Applications is Critical?
- Key Metrics to Monitor in Serverless Applications
- Best Practices for Effective Serverless Application Monitoring
- Take Your Serverless Monitoring to the Next Level with Atatus
What Makes Serverless Applications Different?
Unlike traditional apps hosted on always-on servers, serverless applications operate on-demand. Each function runs only when triggered and terminates immediately after execution. While this is cost-effective, it introduces complexities that make serverless application monitoring critical.
Key Differences:
- Short-lived functions – Traditional monitoring expects servers running 24/7. In serverless applications, functions are temporary, so errors or performance issues can easily go unnoticed without specialized serverless application monitoring.
- Distributed architecture – A single user request may trigger multiple functions across a serverless application. Monitoring must track the entire serverless application to capture issues.
- Cold starts – Some functions may take longer to initialize, causing latency. Serverless application monitoring captures these delays for optimisation.
- Pay-per-execution model – Inefficient functions increase costs. Monitoring the serverless application helps identify bottlenecks and optimise resource usage.
In short, serverless applications are fundamentally different, and ignoring monitoring can lead to slow apps, frustrated users, and wasted resources.
The Risks of Ignoring Serverless Application Monitoring
Monitoring is no longer optional for modern serverless applications. Without proper serverless application monitoring:
- Hidden errors go unnoticed, causing downtime or user frustration.
- Slow functions reduce performance and affect user experience.
- Resource inefficiencies increase operational costs.
For instance, a startup running a serverless application for payment processing might experience delayed transactions or login issues. Without serverless application monitoring, these issues remain invisible until customers report them. This could result in lost revenue and reputation damage.
Monitor Serverless Applications in Real Time
Get instant visibility into errors, latency, cold starts, and end-to-end traces—without heavy setup.
Start Free TrialWhy Monitoring Serverless Applications is Critical?
Monitoring a serverless application provides developers and DevOps teams with actionable insights to maintain speed, reliability, and efficiency.
1. Real-Time Error Detection
Errors in serverless applications are often temporary and distributed across functions. Serverless application monitoring ensures every exception is captured and reported in real-time, allowing fixes before users are affected.
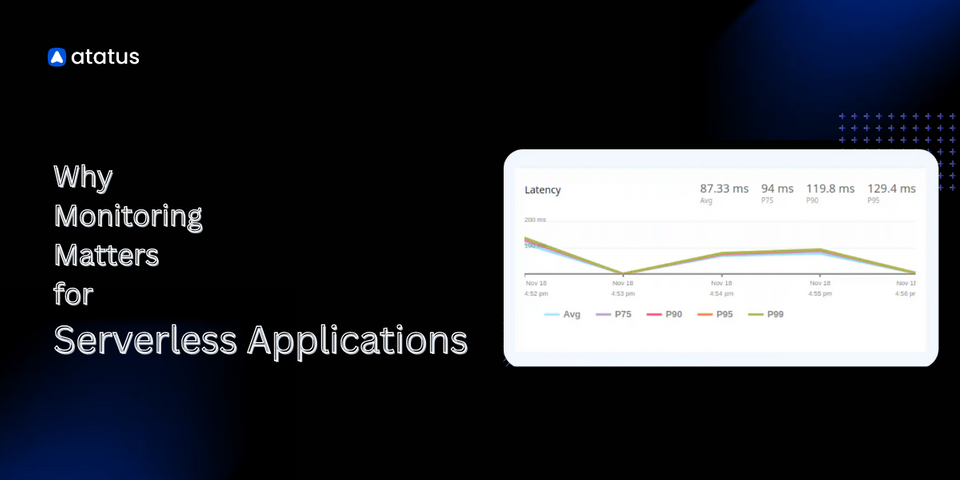
2. Performance Visibility
Performance monitoring tracks execution times, latency, and throughput across the entire serverless application. This helps developers optimise slow functions and improve overall application performance.
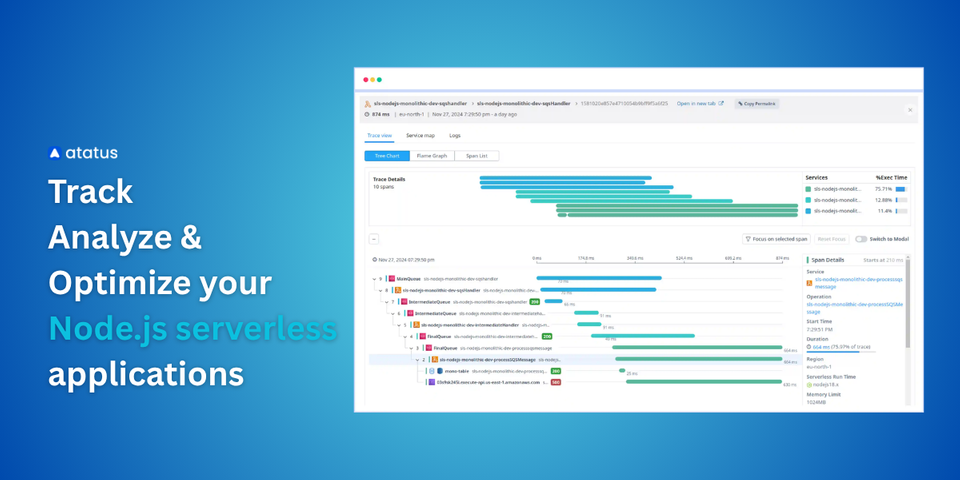
3. End-to-End Transaction Tracing
Modern serverless applications rely on multiple functions interacting with each other. Serverless application monitoring traces user requests end-to-end, showing exactly where delays or failures occur.
4. Cost Optimisation
Since serverless platforms charge based on execution time, monitoring the serverless application helps identify inefficient functions and optimise costs.
5. Business and User Impact
Slow or failing functions impact users directly. Monitoring a serverless application ensures uptime, reduces errors, and improves the overall user experience.
Key Metrics to Monitor in Serverless Applications
To maintain a high-performing serverless application, focus on these critical metrics:
- Invocations:Tracks the number of times your function is executed, indicating usage and potential spikes.
- Errors:Monitors function-level exceptions and runtime errors, signaling potential issues in your code or integrations.
- Throttles:Counts invocation requests that are blocked due to exceeding resource limits, which can indicate scaling or concurrency problems.
- Latency:Measures the total time from when a request is sent to when a response is received, crucial for performance monitoring.
- Duration:The execution time of each individual function invocation, helping to identify slow-performing functions that may need optimization.
- Cold Starts:Tracks the delay when a serverless function is initialized after a period of inactivity, impacting user experience and performance.
- Memory Usage:Monitors the memory allocated to functions, ensuring efficient resource utilisation and identifying potential memory leaks.
Track all these key serverless metrics in real time with Atatus for faster, more reliable applications.
Best Practices for Effective Serverless Application Monitoring
Implementing monitoring for serverless applications requires strategy and the right tools.
1. Logging
- Standardise & Structure: Implement a consistent log format (like JSON) to make logs machine-readable and easier to parse, query, and analyze.
- Add Context: Include crucial information such as
request IDs,function names,timestamps, andlog levels(INFO, WARN, ERROR) in every log entry. - Centralise: Aggregate logs from all functions into a single, unified view using services like AWS CloudWatch Logs, or through third-party solutions to simplify searching and analysis.
2. Tracing
- Implement Distributed Tracing: Use distributed tracing tools to track requests as they flow across multiple serverless functions and services.
- Visualise Data Flows: This provides a full picture of your application's performance, allowing you to zoom in on bottlenecks and understand the interaction between different components.
3. Metrics & Alerting
- Monitor Core Metrics: Track key metrics such as
invocation count,error rates, andlatencyfor high availability. - Use Custom Metrics: Publish custom metrics relevant to your application's business logic for more detailed insights.
- Configure Smart Alerts: Set up alerts that are specific to your application's needs, ensuring you receive timely notifications of issues and can integrate with your existing alert mechanisms.
4. Tools & Integration
- Leverage Third-Party Solutions: Utilise specialized serverless monitoring solutions to gain unified, real-time visibility into your application.
- Integrate with Workflow Tools: Integrate your monitoring tools with CI/CD pipelines, incident management systems, and collaboration platforms for a smoother operational workflow.
Ready to simplify serverless monitoring? Atatus provides real-time insights, error tracking, and full visibility so your apps stay fast and reliable. Request a Demo
Take Your Serverless Monitoring to the Next Level with Atatus
Atatus gives you complete visibility into your serverless applications, helping you monitor performance, errors, and latency in real-time. It empowers DevOps and SRE teams to detect issues instantly and optimise applications for seamless user experiences.
- Real-Time Visibility
Monitor every serverless function invocation, detect errors, latency spikes, and cold starts instantly, and gain complete end-to-end traces across your cloud infrastructure. - Actionable Insights for DevOps and SREs
Get instant alerts and deep performance insights that help your teams optimise serverless applications, reduce downtime, and deliver faster, seamless user experiences. - Start Monitoring Smarter Today
With Atatus, setup is effortless and insights are actionable from day one. Ensure your serverless apps run at peak efficiency and stay ahead of potential issues before they impact users.
Take the Next Step!
Serverless apps face latency, cold starts, and hidden errors—monitoring isn’t optional, it’s essential. Experience Atatus in action and start optimizing your serverless performance now.
Start Free Trial#1 Solution for Logs, Traces & Metrics
![]() APM
APM
![]() Kubernetes
Kubernetes
![]() Logs
Logs
![]() Synthetics
Synthetics
![]() RUM
RUM
![]() Serverless
Serverless
![]() Security
Security
![]() More
More