Xdebug for PHP Developers: Advanced Debugging Made Easy
Debugging can be a challenging task for any programmer, and PHP developers are no exception. With the complexity of web applications and the ever-increasing demands on software development, debugging PHP code can be a time-consuming process.
But what if there was a way to streamline the debugging process and make it more efficient and effective? What if there was a tool that could help developers quickly identify and fix errors in their PHP code, analyze code coverage, generate profiling data, and optimize performance?
Xdebug - a powerful PHP extension that provides advanced debugging and profiling capabilities for PHP developers.
In this blog, we will explore everything you need to know about Xdebug. By the end of this blog, you'll have a comprehensive understanding of how Xdebug can help you improve your PHP development workflow and become a more efficient and effective developer.
Table of Contents
- Introduction to Xdebug
- Installing and Configuring Xdebug
- Setting breakpoints in your PHP code
- Inspecting Variables and Objects with Xdebug
- Using Stack Traces to Debug Errors with Xdebug
- Generating Profiling data with Xdebug
Introduction to Xdebug
Xdebug is a PHP extension that offers sophisticated debugging and profiling functionalities for developers. It comes with a set of advanced features, including code coverage analysis, stack traces, profiling information, and remote debugging.
Using Xdebug is vital for PHP developers as it enables them to promptly and effectively identify and resolve errors in their code.
By utilizing Xdebug, developers can analyze their code line by line, establish breakpoints, and investigate variables and objects at runtime. This significantly simplifies the process of comprehending how their code functions and identifying and addressing issues in their applications.
Installing and Configuring Xdebug
Installing and configuring Xdebug is the first step in using this powerful tool for advanced PHP debugging. Xdebug provides advanced debugging capabilities. Before diving into the advanced debugging techniques that Xdebug offers, it is important to understand how to install and configure Xdebug on various platforms, including Windows, Linux, and Mac.
The installation process may vary depending on your platform, and proper configuration is necessary to ensure that Xdebug works correctly.
1. Windows
Step-1: Download the Xdebug binary that matches your PHP version.
Step-2: Extract the downloaded file to a directory of your choice.
Step-3: Open your php.ini file in a text editor (usually located in your PHP installation directory).
Step-4: Add the following lines at the end of the file,
[Xdebug]
zend_extension="<path to xdebug.dll>"
xdebug.remote_enable=1
Step-5: Replace <path to xdebug.dll> with the full path to the Xdebug binary you downloaded in step 1.
Step-6: Restart your web server or PHP-FPM service.
Step-7: Verify that Xdebug is installed and configured correctly by running php -v in a command prompt and checking if Xdebug is listed as one of the loaded modules.
2. Linux
Step-1: Install the Xdebug package using your distribution's package manager.
sudo apt-get install php-xdebugStep-2: Open your php.ini file in a text editor (usually located in /etc/php/<version>/apache2/php.ini or /etc/php/<version>/cli/php.ini).
Step-3: Add the following lines at the end of the file,
[Xdebug]
zend_extension=xdebug.so
xdebug.remote_enable=1
Step-4: Restart your web server or PHP-FPM service.
Step-5: Verify that Xdebug is installed and configured correctly by running php -v in a terminal and checking if Xdebug is listed as one of the loaded modules.
3. Mac
Step-1: Install the Xdebug package using Homebrew (if Homebrew is not installed, follow the instructions on their website: https://brew.sh/).
Step-2: Open your php.ini file in a text editor (usually located in /usr/local/etc/php/<version>/php.ini).
Step-3: Add the following lines at the end of the file
[Xdebug]
zend_extension="<path to xdebug.so>"
xdebug.remote_enable=1
Step-4: Replace <path to xdebug.so> with the full path to the Xdebug extension file (usually located in /usr/local/Cellar/php/<version>/xdebug/<xdebug-version>/xdebug.so).
Step-5: Restart your web server or PHP-FPM service.
Step-6: Verify that Xdebug is installed and configured correctly by running php -v in a terminal and checking if Xdebug is listed as one of the loaded modules.
Setting breakpoints in your PHP code
Setting breakpoints in your PHP code is a useful technique for debugging your application with Xdebug. A breakpoint is a point in your code where execution will pause, allowing you to inspect the state of your application and the values of variables and objects at that point.
To set a breakpoint in your PHP code with Xdebug, you can use the xdebug_break() function. This function will cause execution to pause when it is reached.
For example, consider the following PHP code,
<?php
function myFunction($a, $b) {
  $c = $a + $b;
  return $c;
}

$a = 2;
$b = 3;
$result = myFunction($a, $b);
echo $result;
?>
To set a breakpoint at line 4, where the variable $c is defined, you can add the following line of code,
<?php
function myFunction($a, $b) {
  xdebug_break(); // set breakpoint here
  $c = $a + $b;
  return $c;
}

$a = 2;
$b = 3;
$result = myFunction($a, $b);
echo $result;
?>
When the xdebug_break() function is executed, execution will pause and Xdebug will open a debugging session in your IDE or browser.
Once the breakpoint is set, you can step through your code line by line, inspecting the values of variables and objects at each point to identify and fix any issues in your application.
Remember to remove the xdebug_break() line once you're done with debugging, as it will pause the execution of your script every time it's reached.
Inspecting Variables and Objects with Xdebug
Inspecting variables and objects with Xdebug is a powerful debugging technique that allows you to understand how your code is executing and identify any issues or bugs. Xdebug provides several ways to inspect variables and objects at runtime, including the var_dump() function and the IDE's debugging interface.
To use var_dump() with Xdebug, you can simply include it in your code and Xdebug will display the results in your IDE's debugging interface. For example
<?php
$a = "Hello";
$b = array(1, 2, 3);
$c = new stdClass();

var_dump($a, $b, $c);
?>
When executed with Xdebug, this code will display the values of $a, $b, and $c in your IDE's debugging interface as below. You can use this information to understand how your code is executing and identify any issues or bugs.
Output:
string(5) "Hello"
array(3) {
  [0]=>
  int(1)
  [1]=>
  int(2)
  [2]=>
  int(3)
}
object(stdClass)#1 (0) {
}
In addition to var_dump(), Xdebug provides several other ways to inspect variables and objects at runtime. These include:
xdebug_var_dump(): Similar tovar_dump(), but provides more detailed information about the variable or object.xdebug_debug_zval(): Displays the internal structure of a variable, including its reference count.- IDE debugging interface: Many IDEs provide a debugging interface like VS code and PHP Storm that allows you to inspect variables and objects at runtime, set breakpoints, and step through your code line by line.
By inspecting variables and objects at runtime with Xdebug, you can gain a deeper understanding of how your code is executing and identify any issues or bugs more quickly and efficiently.
Using Stack Traces to Debug Errors with Xdebug
To demonstrate how to use Xdebug to view and understand the call stack, let's assume you have a PHP script that encounters an error. We'll create a simple example to simulate this scenario:
<?php

function divide_numbers($numerator, $denominator) {
    return $numerator / $denominator;
}

function calculate_average($numbers) {
    $total = 0;
    foreach ($numbers as $number) {
        $total += $number;
    }
    return divide_numbers($total, count($numbers));
}

$numbers = [10, 20, 30, 40, 0]; // Last element is zero, causing division by zero error
$average = calculate_average($numbers);

echo "The average is: " . $average;

?>
Update your PHP configuration (php.ini) with Xdebug settings. For example:
[xdebug]
zend_extension=/path/to/your/xdebug.so
xdebug.mode=debug
xdebug.start_with_request=yes
Restart your web server (e.g., Apache, Nginx) after making changes to the PHP configuration and access the PHP script example.php from your web browser.
When Xdebug is enabled, it will generate a stack trace and display it in the browser when an error occurs. In this example, the script encounters a division by zero error, and Xdebug will provide a detailed stack trace.
The stack trace will show the order of function calls leading up to the error. It helps you identify where the problem originates in your code. The output will look something like this:
Warning: Division by zero in /path/to/your/example.php on line 5

Call Stack:
    0.0011     423688   1. {main}() /path/to/your/example.php:0
    0.0012     424376   2. calculate_average() /path/to/your/example.php:18
    0.0012     424496   3. divide_numbers() /path/to/your/example.php:5
In this example, the error occurred in example.php on line 5, which is inside the divide_numbers function. The function divide_numbers was called from the calculate_average function, which was called from the main script.
By analyzing the call stack, you can trace the flow of execution and pinpoint where the issue occurred. This information is invaluable for debugging and fixing errors in more complex PHP applications.
Xdebug provides several ways to trace the execution of your PHP code, including function tracing and code coverage analysis.
1. Function Tracing
Function tracing allows you to track the execution of specific functions in your PHP code. With Xdebug, you can enable function tracing by adding the following lines to your php.ini file,
xdebug.auto_trace = 1
xdebug.trace_output_dir = /tmp
xdebug.auto_trace = 1: This setting enables function tracing. When set to 1, Xdebug will automatically trace the execution of all functions in your PHP code.xdebug.trace_output_dir = /tmp: This setting specifies the directory where Xdebug should output the trace files. You can replace "/tmp" with the desired path on your server.
When you run your PHP code with Xdebug enabled, it will create a trace file in the specified directory that contains information about the execution of each function. The trace file will show the sequence of function calls and the time taken by each function to execute.
2. Code Coverage Analysis
Code coverage analysis allows you to track which lines of your PHP code are executed during a particular request or test. With Xdebug, you can enable code coverage analysis by adding the following lines to your php.ini file,
xdebug.coverage_enable = 1
xdebug.coverage_output_dir = /tmp
xdebug.coverage_enable = 1: This setting enables code coverage analysis. When set to 1, Xdebug will collect information about which lines of code are executed during the script's run.xdebug.coverage_output_dir = /tmp: This setting specifies the directory where Xdebug should output the coverage files. Similar to function tracing, you can replace "/tmp" with your preferred path.
When you run your PHP code with Xdebug enabled, it will create a coverage file in the specified directory that contains information about which lines of code were executed. The coverage file will show which lines were executed at least once and which lines were not executed (uncovered lines).
By using function tracing and code coverage analysis with Xdebug, you can gain a deeper understanding of how your PHP code is executing and identify any performance issues or bottlenecks. This can help you optimize your code for better performance and scalability.
Generating Profiling data with Xdebug
Profiling is the process of measuring and analyzing the performance of your PHP code. It can help you identify performance bottlenecks and optimize your code for better performance. Xdebug provides a built-in profiling tool that makes it easy to generate profiling data for your PHP code.
To use Xdebug for profiling, you need to enable profiling in your php.ini file by adding the following lines,
xdebug.profiler_enable = 1
xdebug.profiler_output_dir = /tmp
This will enable profiling and specify the directory where Xdebug should output the profiling files.
Once you have enabled profiling, you can run your PHP code with Xdebug enabled and generate a profiling report. To do this, you can use a tool like cachegrind to analyze the profiling data.
For example, to generate a profiling report for your PHP code, you can run the following command
$ php -d xdebug.profiler_enable=On script.php
The profiling report generated by Xdebug will show you a breakdown of the time spent executing each function in your PHP code, as well as the number of times each function was called. This can help you identify which functions are taking the most time to execute and optimize them for better performance.
The profiling report generated by Xdebug will be in a format called "cachegrind". You can use tools like KCacheGrind or WinCacheGrind to visualize and analyze the profiling data.
These tools present a breakdown of the time spent executing each function in your PHP code and the number of times each function was called, helping you identify performance hotspots and areas for optimization.
By using Xdebug for profiling, you can ensure that your PHP code is optimized for better performance and that any performance issues or bottlenecks are identified and addressed before they cause problems in production.
Conclusion
Debugging is an essential aspect of software development, and PHP developers face many challenges while debugging their code. These challenges include finding the root cause of an error, tracing code execution, and inspecting variables and objects. Without a powerful debugging tool, the debugging process can be time-consuming and frustrating.
We covered the installation and configuration of Xdebug on various platforms, including Windows, Linux, and Mac. Additionally, we explored how to set breakpoints, inspect variables and objects, trace code execution, analyze code coverage.
Finally, we discussed how to generate profiling data with Xdebug. The ability to generate profiling data is also a significant advantage, as it allows developers to identify performance bottlenecks in their code and optimize their applications.
By using Xdebug, developers can significantly reduce the time and effort required to debug their PHP code, leading to more efficient and effective development workflows.
Atatus: PHP Performance Monitoring and Error Tracking
Atatus is an Application Performance Management (APM) solution that collects all requests to your PHP applications without requiring you to change your source code. However, the tool does more than just keep track of your application's performance.
Atatus PHP monitoring, tracks and provides real-time notifications for every error, exception, and performance problem that occurs within the application. .
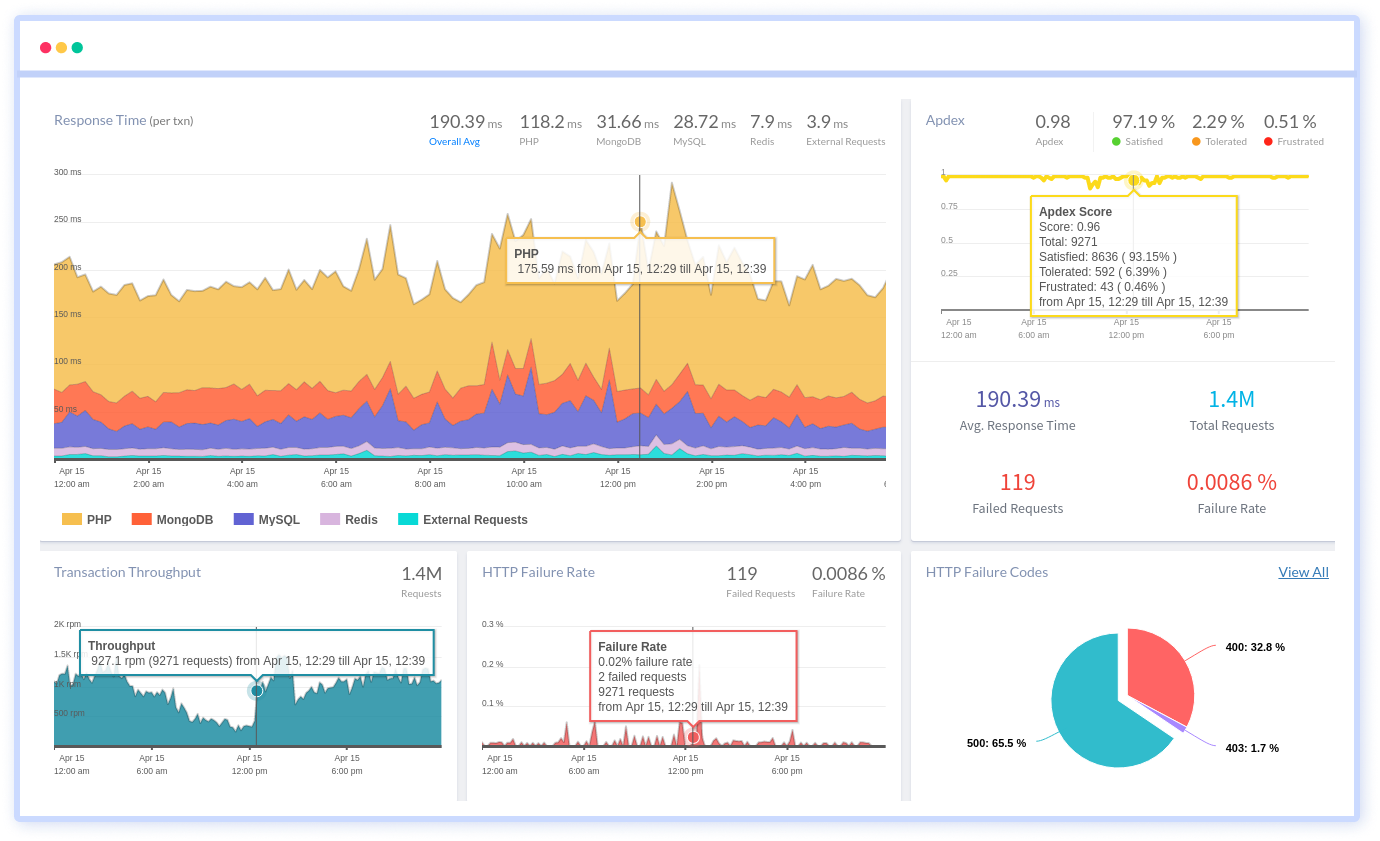
By tracking KPIs such as response times, throughput, HTTP failure rates, and error rates, it can help users identify and address any performance issues before they impact the application's users.
Furthermore, Atatus supports multiple PHP framework such as WordPress, Magento, Laravel, CodeIgniter, CakePHP, Symfony, Yii and Slim making it an adaptable tool that can be used to monitor applications across different frameworks and platforms.
#1 Solution for Logs, Traces & Metrics
![]() APM
APM
![]() Kubernetes
Kubernetes
![]() Logs
Logs
![]() Synthetics
Synthetics
![]() RUM
RUM
![]() Serverless
Serverless
![]() Security
Security
![]() More
More