Slim

Full Stack Slim Performance Monitoring

Get end-to-end visibility into your Slim performance with application monitoring tools. Gain insightful metrics on performance bottlenecks with PHP monitoring to optimize your application.

No Code Changes. Get Instant Insights for PHP frameworks.

1. Add repository and GPG key

sudo curl  https://s3.amazonaws.com/atatus-artifacts/gpg/atatus.gpg  | sudo apt-key add -

  Add the debian repository

sudo  echo  "deb https://s3.amazonaws.com/atatus-artifacts/atatus-php/debian stable main"  | sudo tee -a /etc/apt/sources.list.d/atatus-php-agent.list

2. Install the PHP agent

sudo apt-get update

ATATUS_LICENSE_KEY="APM_LIC_KEY"  ATATUS_APP_NAME="YOUR_APP_NAME"  apt-get install atatus-php-agent -y

3. Restart your PHP services.

1. Add the redhat repository

sudo curl -o /etc/yum.repos.d/atatus-php-agent.repo  https://s3.amazonaws.com/atatus-artifacts/atatus-php/rpm/x86_64/atatus-php-agent.repo

sudo yum -q makecache -y  --disablerepo='*'  --enablerepo='atatus-php-agent'

2. Install the PHP agent

sudo  ATATUS_LICENSE_KEY="APM_LIC_KEY"  ATATUS_APP_NAME="YOUR_APP_NAME"  yum install atatus-php-agent -y

3. Restart your PHP services.

1. Download Atatus PHP agent

wget  https://s3.amazonaws.com/atatus-artifacts/atatus-php/downloads/atatus-php-1.14.0-x64-musl.tar.gz

  Unzip the agent files

tar -xzvf atatus-php-1.14.0-x64-musl.tar.gz
cd  atatus-php-1.14.0-x64-musl

2. Install the PHP agent

sudo  ATATUS_LICENSE_KEY="APM_LIC_KEY"  ATATUS_APP_NAME="YOUR_APP_NAME"  bash install.sh

3. Restart your PHP services.

1. Download Atatus PHP agent

wget  https://s3.amazonaws.com/atatus-artifacts/atatus-php/downloads/atatus-php-1.14.0-x64-osx.tar.gz

  Unzip the agent files

tar -xzvf atatus-php-1.14.0-x64-osx.tar.gz
cd  atatus-php-1.14.0-x64-osx

2. Install the PHP agent

sudo  ATATUS_LICENSE_KEY="APM_LIC_KEY"  ATATUS_APP_NAME="YOUR_APP_NAME"  bash install.sh

3. Restart your PHP services.

1. Download Atatus PHP agent

heroku config:set  HEROKU_PHP_PLATFORM_REPOSITORIES="https://s3.amazonaws.com/atatus-php-heroku-ext/heroku/"

  Set license key and app name

heroku config:set  ATATUS_LICENSE_KEY="APM_LIC_KEY"  ATATUS_APP_NAME="YOUR_APP_NAME"

2. Add Atatus Heroku extension in composer.json

{
    "require" : {
     "ext-atatus" : "1.14.0"
    }
    "require" : {
     "platform" : {
      "ext-atatus" : "1.14.0"
       }
    }
}

3. Install Atatus Heroku extension.

composer update ext-atatus

4. Commit those changes to Heroku and deploy your application once again.

git add composer.json composer.lock
git commit -m  'Added ext-atatus dependency to Heroku app'
git push heroku master

5. Access your PHP app

Slim Performance Monitoring in real-time

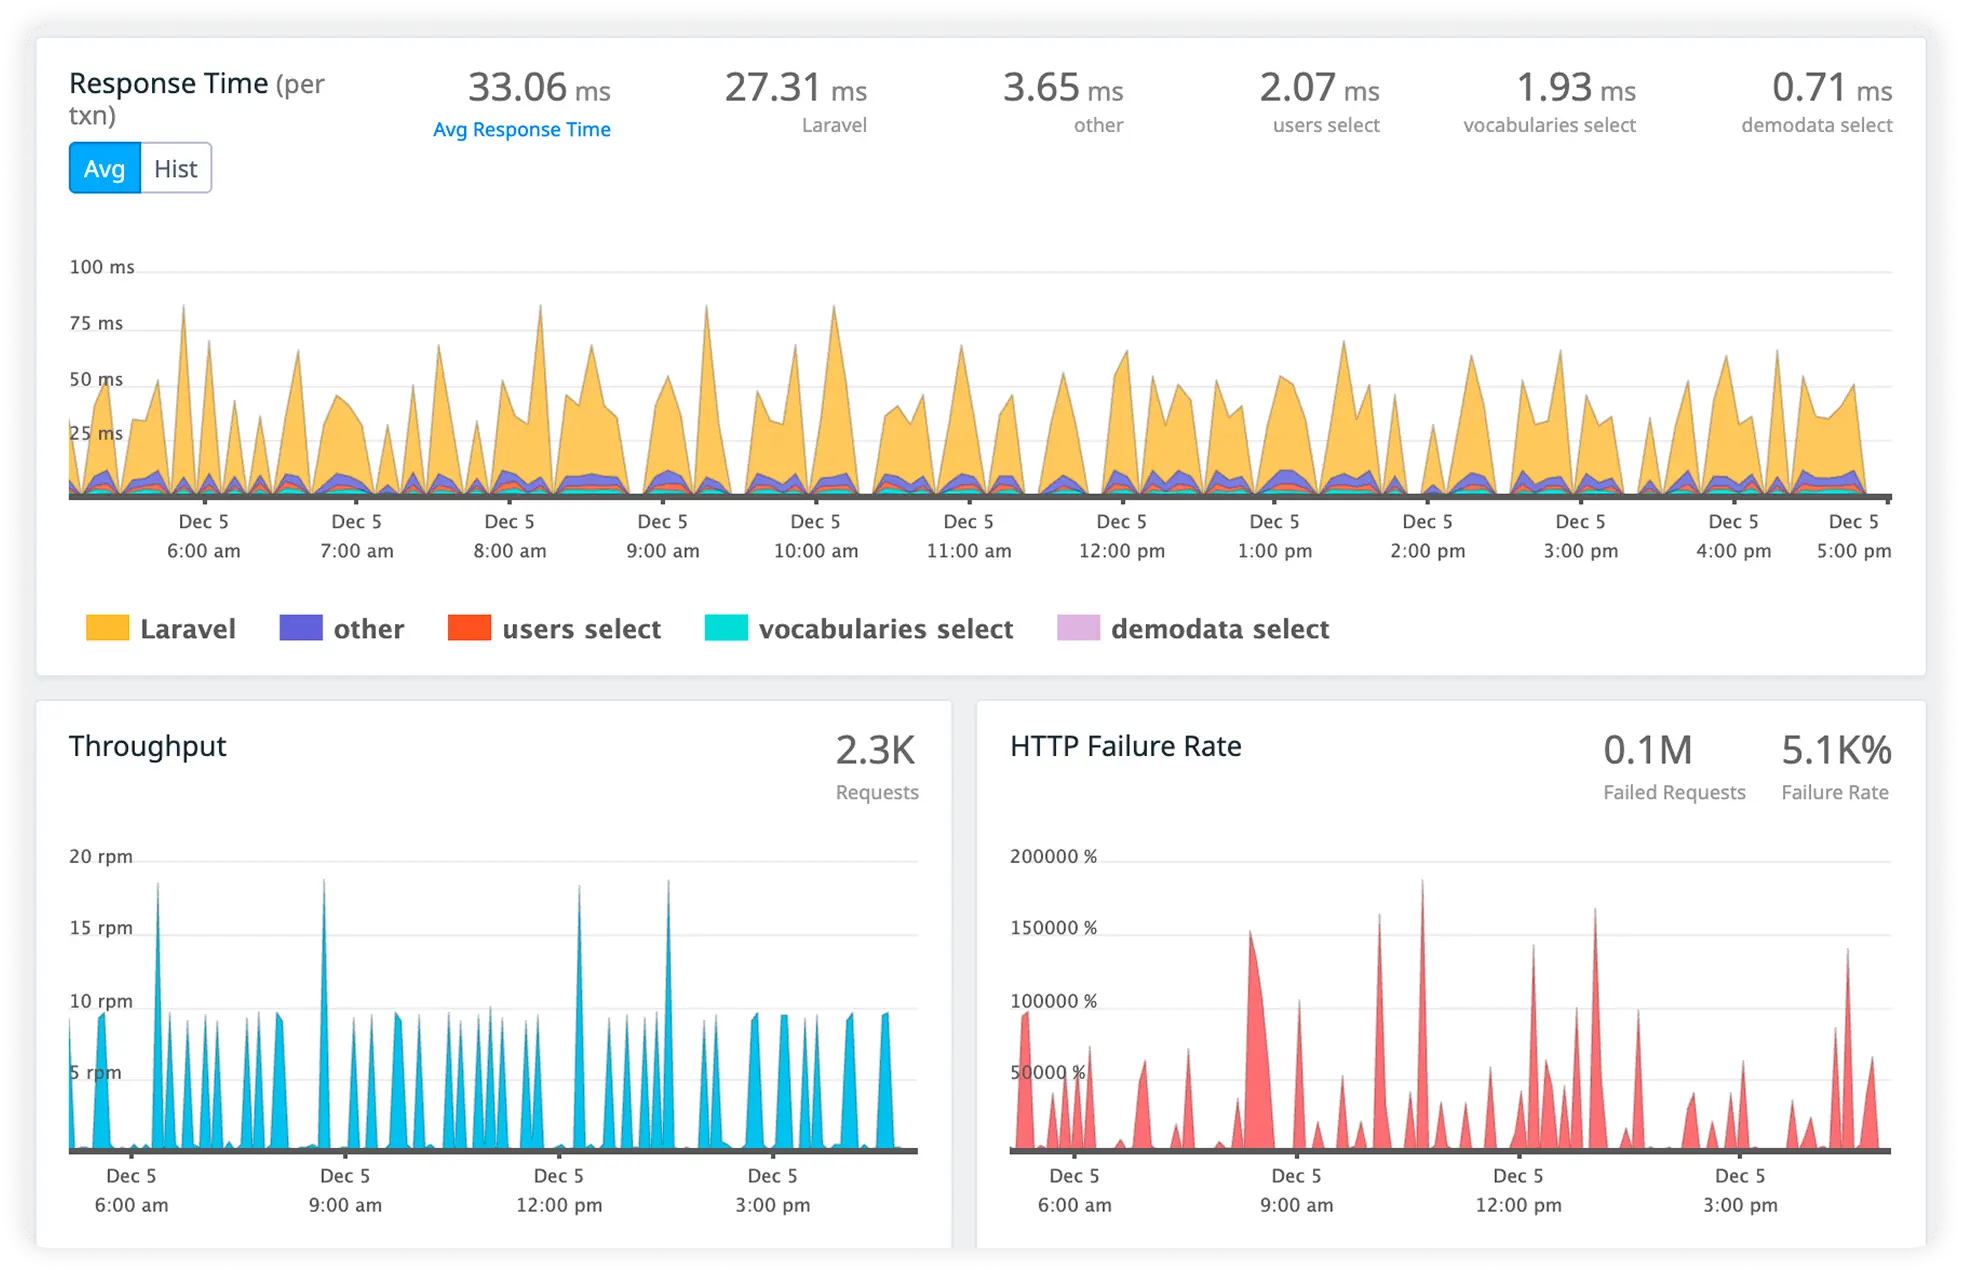
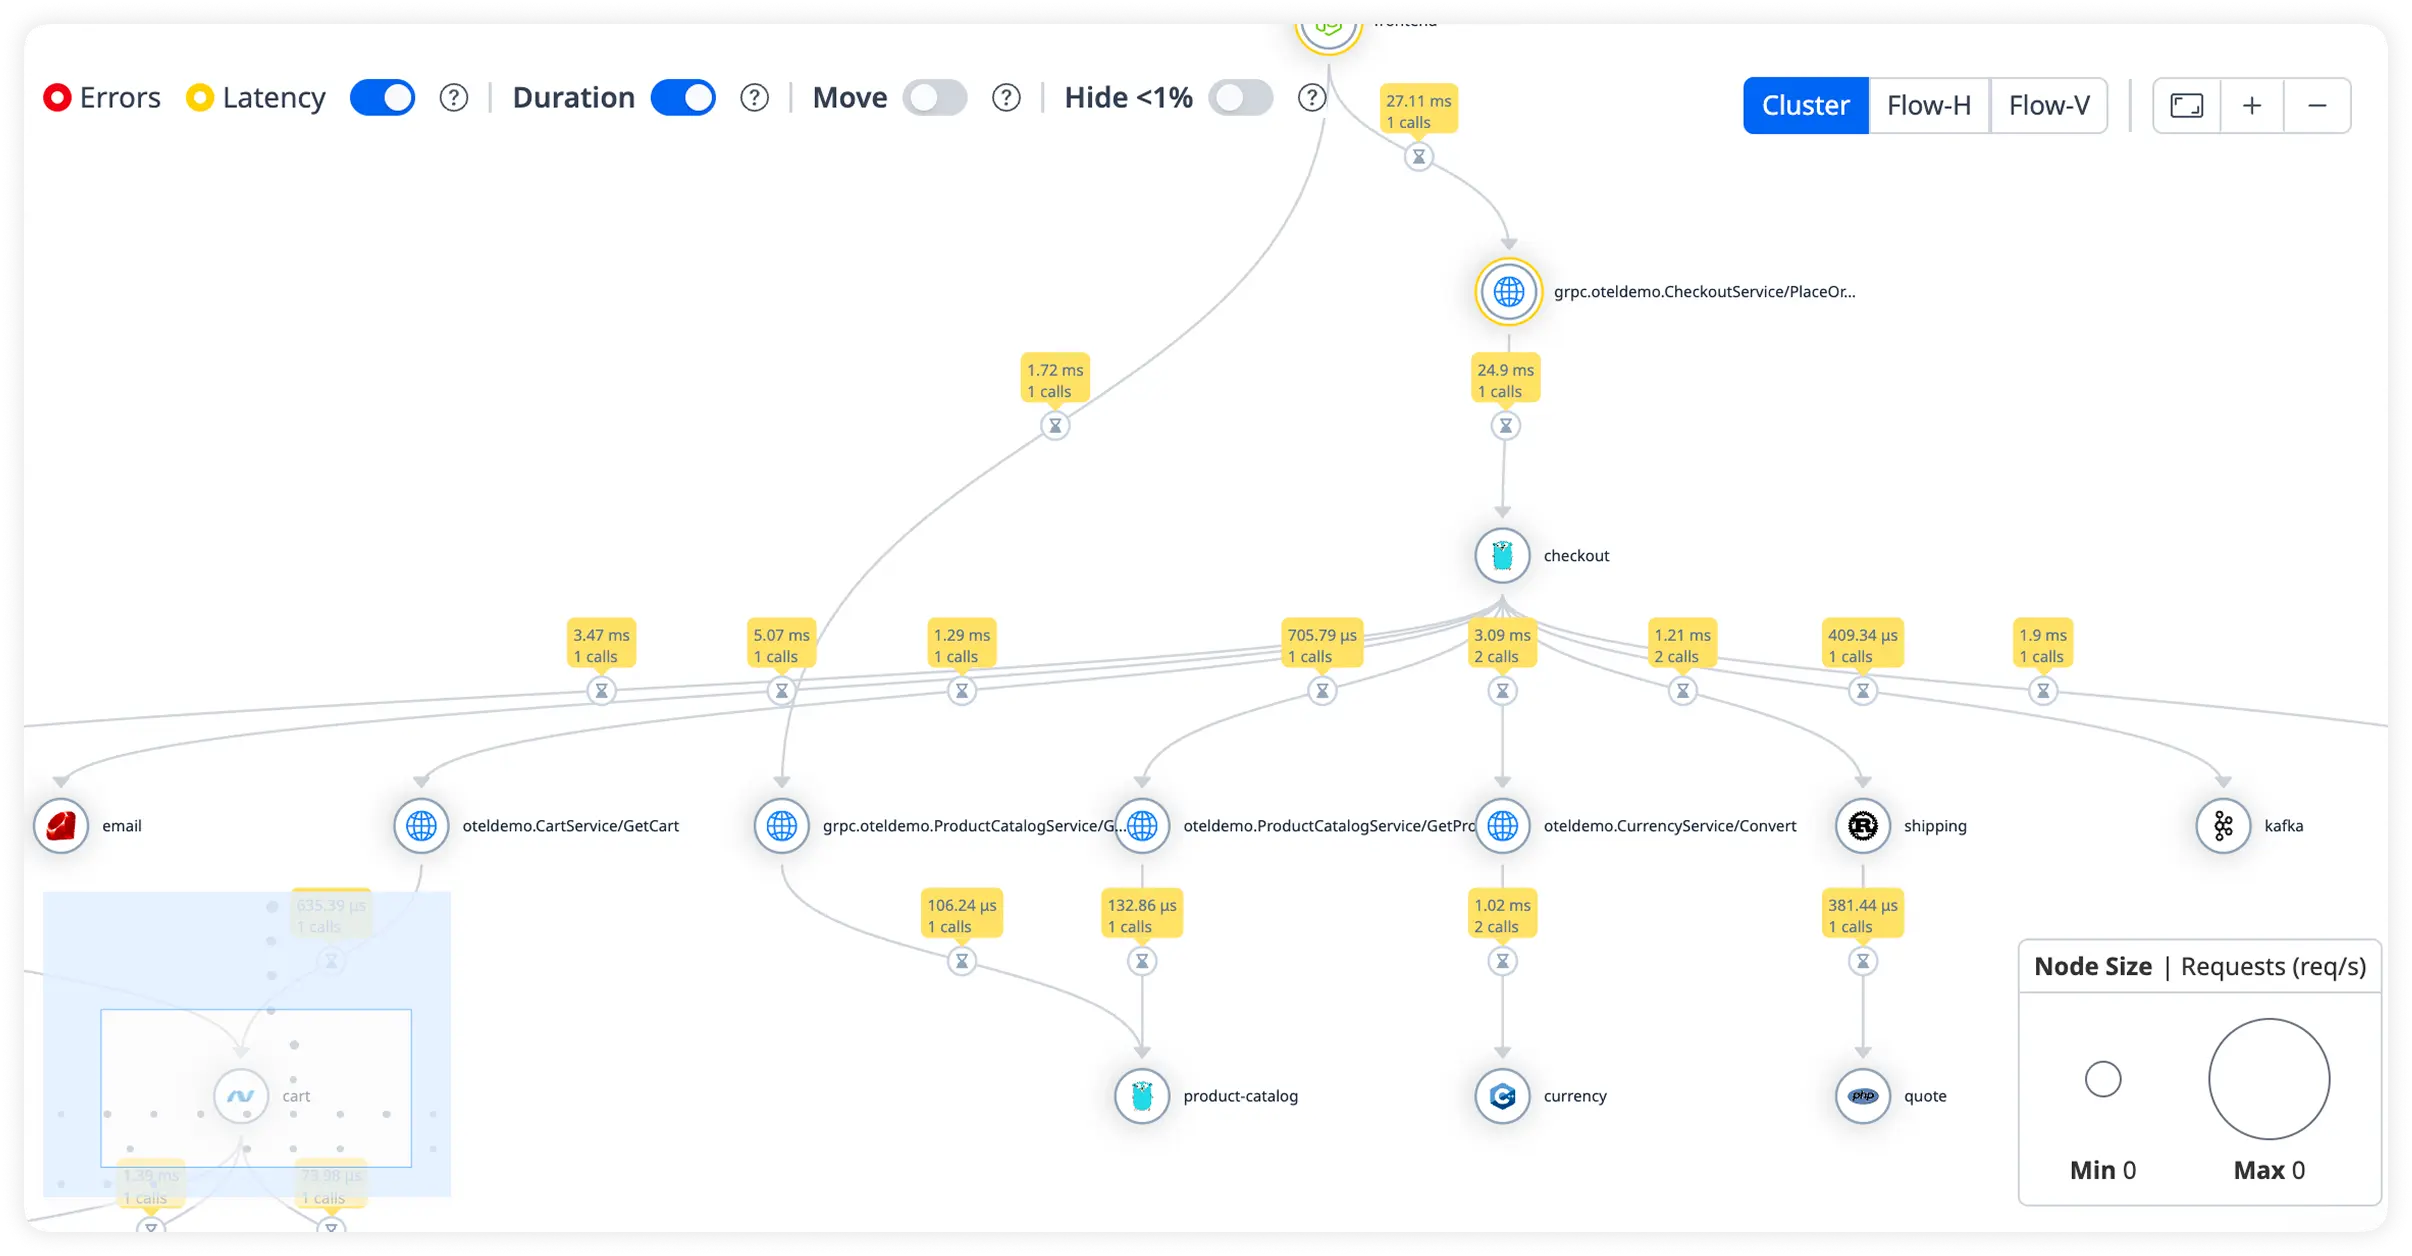
Atatus captures all requests to your Slim applications without requiring you to change your source code. Get a clear picture of how all your methods, database statements and external requests are affecting your user's experience.

Slim Slowest APISlowest API

Optimize slow response times caused by Slim errors

Automatically visualize end-to-end business transactions in your Slim application. Monitor the amount and type of failed HTTP status codes and application crash with Slim Monitoring. Analyze response time to identify Slim performance issues and errors on each and every business transaction. Understand the impact of methods and database calls that affects your customer's experience.

Learn moreLearn More
Slim Transaction Monitoring
Optimize DB queriesOptimize DB queries

Find Performance Bottlenecks in your Slim Application

Examine all SQL and NoSQL queries used by your Slim server. Identify slow database queries and optimize query performance with database monitoring proactively. Monitor and measure third party API calls' response times and REST API failure rates along with HTTP status codes. Slice and dice performance metrics in real time—based on host, version, release stage, URL and other attributes.

Learn moreLearn More
Slim Database Monitoring
Exception RateFix issues

Quickly diagnose and fix Slim exceptions

Every Slim error is tracked using error tracking and captured with full stacktrace and exact line of source code is highlighted to make bug fixing easier. Get all the essential data such as class, message, URL, request agent, version etc to fix the Slim exceptions and errors. Identify buggy API or third party services by investigating API failure rates and application crashes. Get alerts for application errors and exceptions via Email, Slack, PagerDuty, or using webhooks.

Learn moreLearn More
Slim Error Tracking
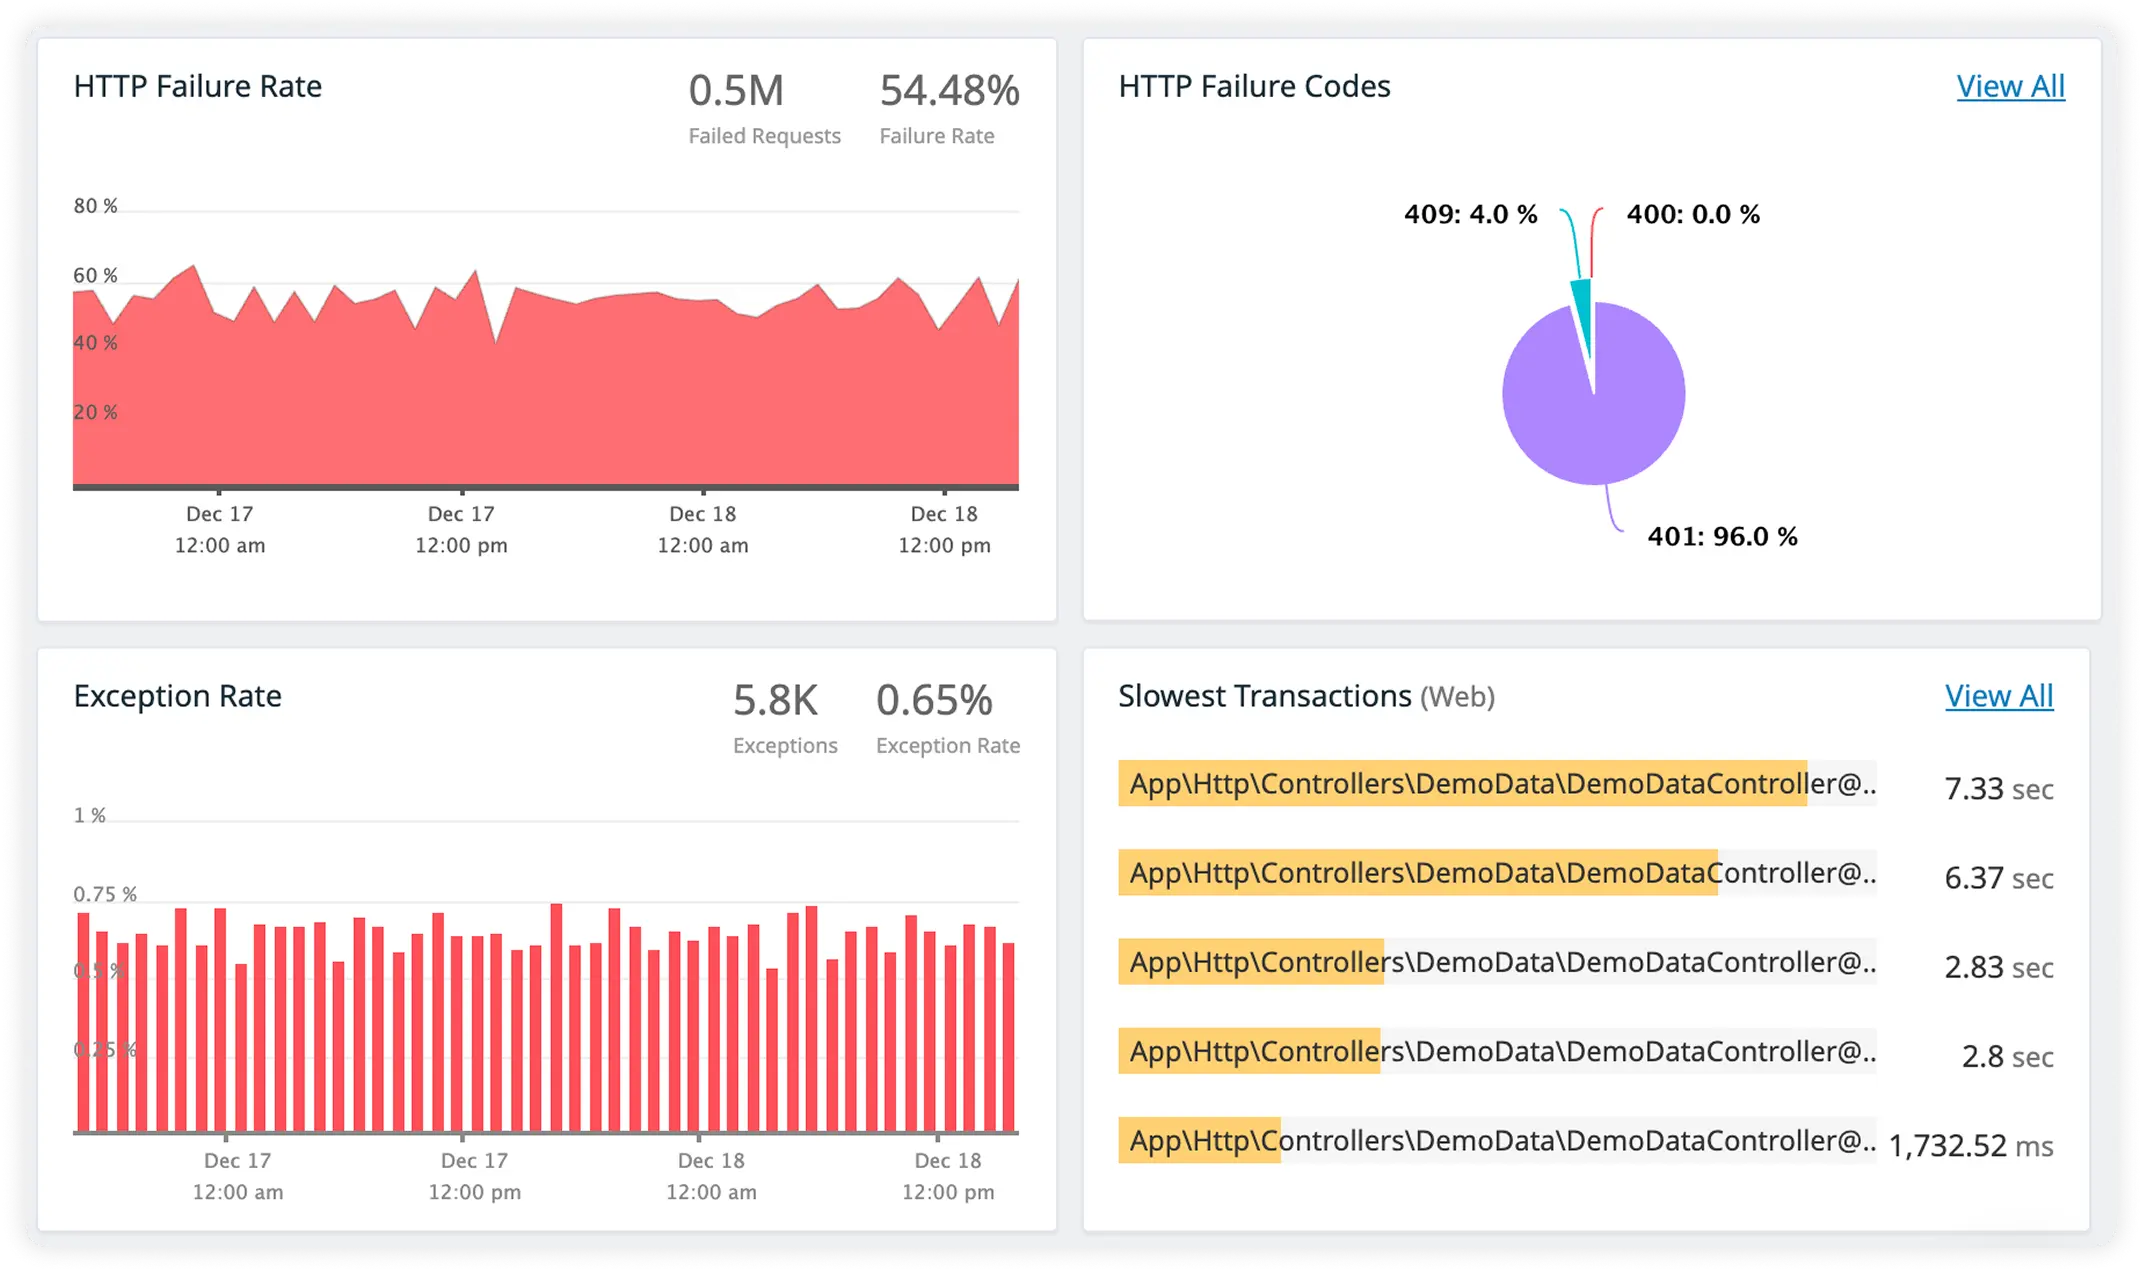
Failure countHTTP Failures

Spot out and fix Slim API failures

Quickly view the highest Slim HTTP failures and get each request information along with custom data to identify the root cause of the failures. See the breakdown of the API failures based on HTTP Status Codes and the end-users having the highest impact.

Learn moreLearn More
API Failures
Slowest RequestSlowest Request Breakdown

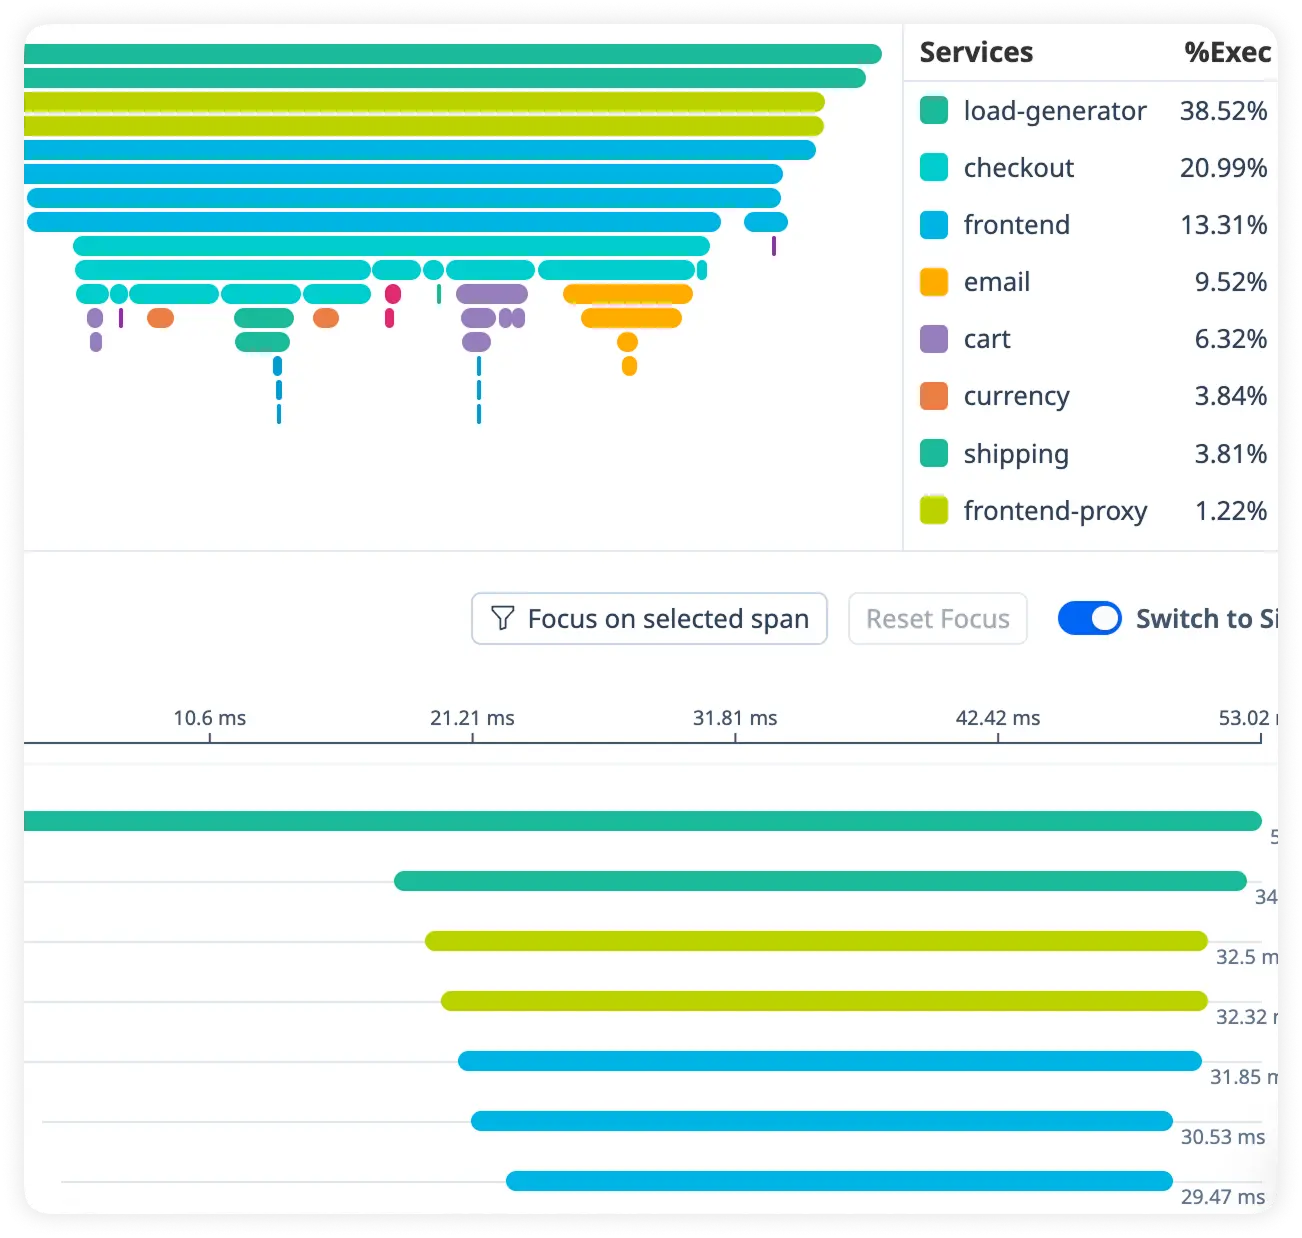
Figure out where your Slim app time is spent

Break down slow Slim requests by time spent in code blocks, database queries, external services, templates, message queues and much more. View logs, infrastructure metrics, VM metrics in context with the original request.

Learn moreLearn More
Slowest Request Breakdown

Start fixing issues impacting your users right now

Try it free. No credit card required. Instant set-up.

Awesome Support

Best APM Monitoring tool

"Atatus customer service is just amazing. I had before New Relic and Stackify and I can honestly say that Atatus compared to those two is the leader! Leader in pricing and user interface and ability to drill down to the problem."

— S Herman Kiefus, DevOps Admin, Compass

We've Got Your Stack Covered!

Boost Framework Performance

Boost Framework Performance

Monitor Laravel, Silex, Symfony, Yii, Drupal, Magento and more. Gain insights into your Slim performance, enhancing transaction flow and speeding up error resolution.

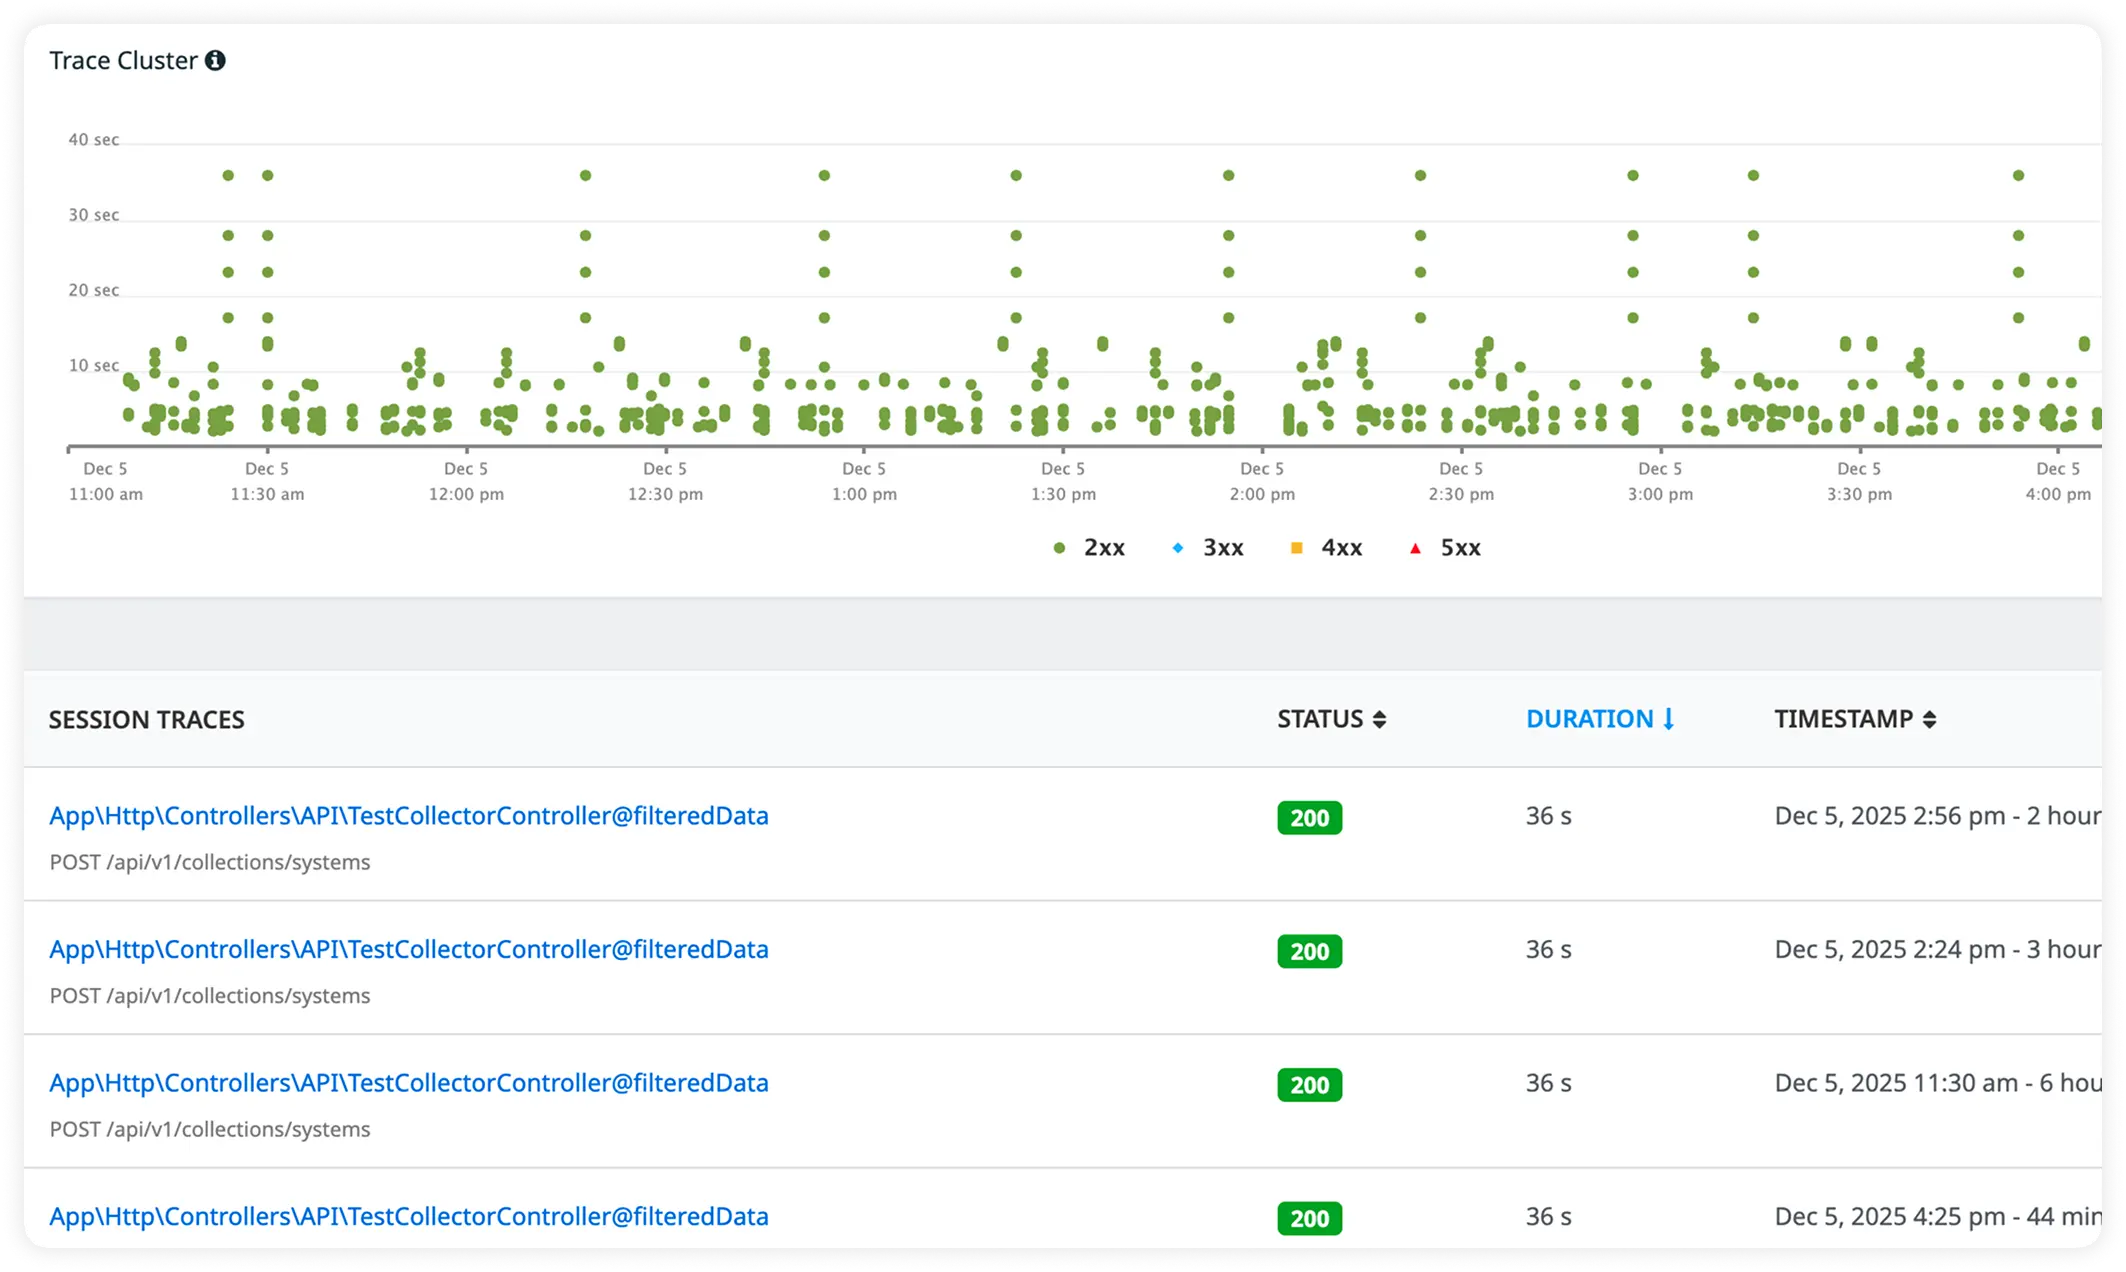
Trace Every Request Instantly

Trace Every Request Instantly

Visualize end-to-end traces across your stack, ensuring that you catch every Slim error, performance issue, or bottleneck before it affects users.

Identify Slow Queries Instantly

Identify Slow Queries Instantly

Pinpoint and resolve slow database queries and eliminate performance bottlenecks impacting your Slim application's responsiveness, leading to faster response times

Stay Alert to Vulnerabilities

Stay Alert to Vulnerabilities

Get alerted to potential library vulnerabilities, preventing security risks before they affect your customers or compliance.

Simplify Logs, Troubleshoot Faster

Simplify Logs, Troubleshoot Faster

Centralize all your Slim logs in one place, and quickly identify the root cause of issues using advanced filtering, pattern detection, and log pipelines.

Custom Metrics That Matter

Custom Metrics That Matter

Set up and track custom metrics that align with your app's KPIs to ensure you're monitoring exactly what matters most for your success.

Quick Request Analysis Anytime

Quick Request Analysis Anytime

Explore request-level analysis, including stdout APM logs, to understand execution times, bottlenecks, and areas that need optimization.

Align APM with Server Metrics

Align APM with Server Metrics

Correlate your app’s Slim APM metrics with server health to get a complete picture of your application’s performance and infrastructure dependencies.

Actionable Alerts

Actionable Alerts

Receive real-time alerts for Slim app performance degradations and critical issues. Take immediate action to prevent downtime and optimize user experiences.

FAQ on Slim Application Performance Monitoring

What is Slim performance monitoring?

The Slim performance monitoring tool helps developers to optimize the Slim server performance.

A good Slim APM solution answers the following two questions:

  1. Is an application broken or slow?
  2. What is issue that's causing the application broken or slow?

You can easily use application performance monitoring tools to answer, detect and resolve the above issues before they could impact the end users.

How to monitor a Slim app?

In general, there are two types of monitoring:

  1. Black-box monitoring - It allows you can monitor the external behaviour of your system such as CPU usage, disk usage, memory usage, load averages etc..
  2. White-box monitoring - It allows you to keep an eye on the applications running on your server. It requires an agent to enable white-box monitoring.
Why do we need an Slim performance monitoring tool?

Every organization should have a well-implemented Slim APM solution, which allows DevOps teams (and the organization as a whole) to resolve issues and performance bottlenecks efficiently and reduce Mean Time To Resolution (MTTR). This has a substantial impact on the bottom line of the business.

Now organizations do not have to deal with the unnecessary work involved in maintaining an extensive software analysis group.

How to choose the right application performance monitoring tool?

Your Slim performance monitoring tools should be easy to use, offer actionable insights, and be able to:

  1. Manage applications in the language(s) your apps use
  2. Track performance at the code level
  3. Keep an eye on end-user experiences
  4. Make use of artificial intelligence
  5. The ability to monitor the entire infrastructure
  6. Provides information that connects app performance metrics to business outcomes.

Check out this blog to know more information - Things You Should Know Before Choosing Application Performance Monitoring Tools.

What are the benefits of Slim APM?

Technical Benefits:

  1. Increase application uptime and reduces downtime
  2. Code level diagnostics
  3. Avoid network outages
  4. Reduces MTTR
  5. Server metrics
  6. Alerts and notification on error information

Business Benefits:

  1. Higher conversion rate
  2. Improves SEO
  3. Better end-user experience
  4. Improves productivity
  5. Reduced operational costs
How to manage database performance issues in a Slim application?

With the help of the database monitoring, you can easily identify the database performance bottlenecks.

  1. Understand who's using your databases.
  2. Track key performance metrics for DB performance tuning.
  3. Detect the slow and most-time consuming SQL queries to optimize it.
  4. Alerts on availability and performance issues.

Trusted Protection through Global Compliance

Feel assured as we maintain rigorous security protocols, ensuring the safety of your data with every interaction

SOC 2 Type 2 Compliant
ISO 27001 Certified
ISO 27001 Certified
GDPR & CCPA Compliant

Ready to see actionable data?

Avail Atatus features for 14 days free-trial. No credit card required. Instant set-up.