Apache Camel Java Agent Extension Monitoring
Atatus actively monitors the Apache Camel Java Agent Extension, tracking Camel route performance in real time. It analyzes exchange patterns, measures route latencies, and assesses resource utilization, helping you optimize integrations with minimal overhead.
Where Camel production visibility breaks
Route Execution Ambiguity
Dynamic routing logic and conditional flows make it difficult to confirm which execution paths actually processed messages in production.
Fragmented Exchange Context
Failures surface without complete exchange state, forcing engineers to infer header mutations, payload transitions, and processing order.
Slow Root Localization
Identifying the first failing step across multi-stage routes takes time, especially when errors propagate downstream.
Hidden Endpoint Latency
Internal endpoints and external systems introduce delays that remain invisible until latency compounds across route chains.
Asynchronous Flow Gaps
Parallel processing and async endpoints break execution continuity, complicating accurate failure timeline reconstruction.
Noisy Failure Signals
Error notifications lack sufficient execution detail, pushing teams to triage symptoms before isolating causes.
Scaling Behavior Uncertainty
Increased throughput and concurrency alter route behavior in ways teams cannot easily observe or predict.
Declining Operational Confidence
Repeated blind investigations reduce trust in production understanding, slowing response during critical integration failures.
Complete Performance Visibility for
Camel Integrations
Real-time observability for Camel workloads that helps teams trace route performance, monitor throughput, and understand runtime behavior across distributed integrations.
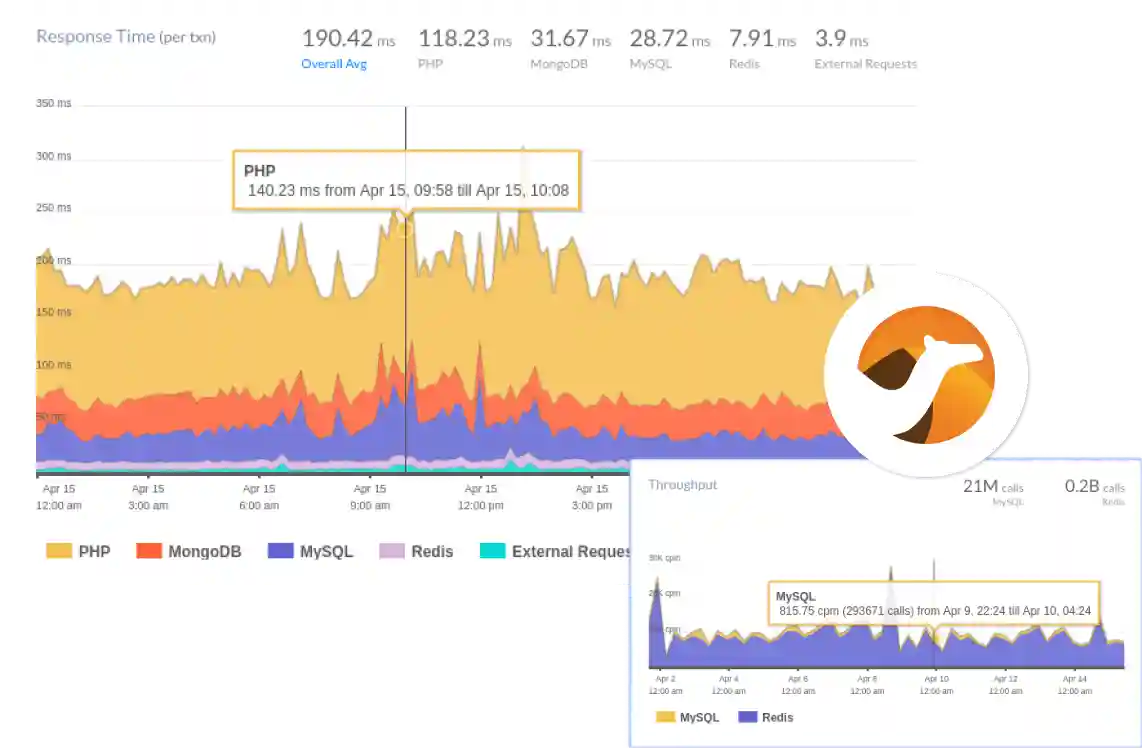
Route & Exchange Timing
Track execution time across Camel routes and message exchanges. Quickly identify latency introduced at each processing stage.

Throughput Metrics
Measure message volume and processing rate across integration pipelines. Spot performance slowdowns and capacity issues in real time.

Endpoint Latency Trends
Analyze response times for internal and external endpoints connected through Camel. Detect rising latency before it impacts data flows.

JVM Resource Correlation with Deployment Performance Shift
Correlate JVM CPU and memory usage with performance changes across deployments. Understand how releases impact throughput and latency.


Why Camel teams standardize on Atatus
As integration complexity grows, understanding real production behavior becomes harder than building new routes. Teams standardize on Atatus to preserve execution clarity, align engineers around the same runtime reality, and maintain confidence as message volume and route depth increase.
End-To-End Route Clarity
Engineers maintain a clear understanding of how messages traverse complex route chains in live production systems.
Fast Team Alignment
New and existing engineers reach shared understanding of route behavior without relying on undocumented assumptions.
Immediate Signal Trust
Production signals are trusted early in investigations, enabling faster decisions during integration failures.
Reduced Debug Overhead
Engineers spend less time correlating endpoints and more time validating where execution broke.
Predictable Incident Handling
Incident response follows repeatable patterns even as route depth and integration complexity grow.
Shared Execution Reality
Platform, SRE, and backend teams reference the same runtime evidence during outages and reviews.
Stability Under Throughput
Production understanding remains reliable as message volume and concurrency increase.
Lower On-Call Fatigue
Clear execution insight shortens incident duration and reduces escalation loops for on-call engineers.
Long-Term Integration Confidence
Teams continue expanding routes and integrations without fear of unseen production behavior.
Unified Observability for Every Engineering Team
Atatus adapts to how engineering teams work across development, operations, and reliability.
Developers
Trace requests, debug errors, and identify performance issues at the code level with clear context.
DevOps
Track deployments, monitor infrastructure impact, and understand how releases affect application stability.
Release Engineer
Measure service health, latency, and error rates to maintain reliability and reduce production risk.