Serverless Monitoring
Atatus shows every AWS Lambda and Azure Functions invocation with its duration, status and errors, and follows it into the queues and services it calls, in one view.
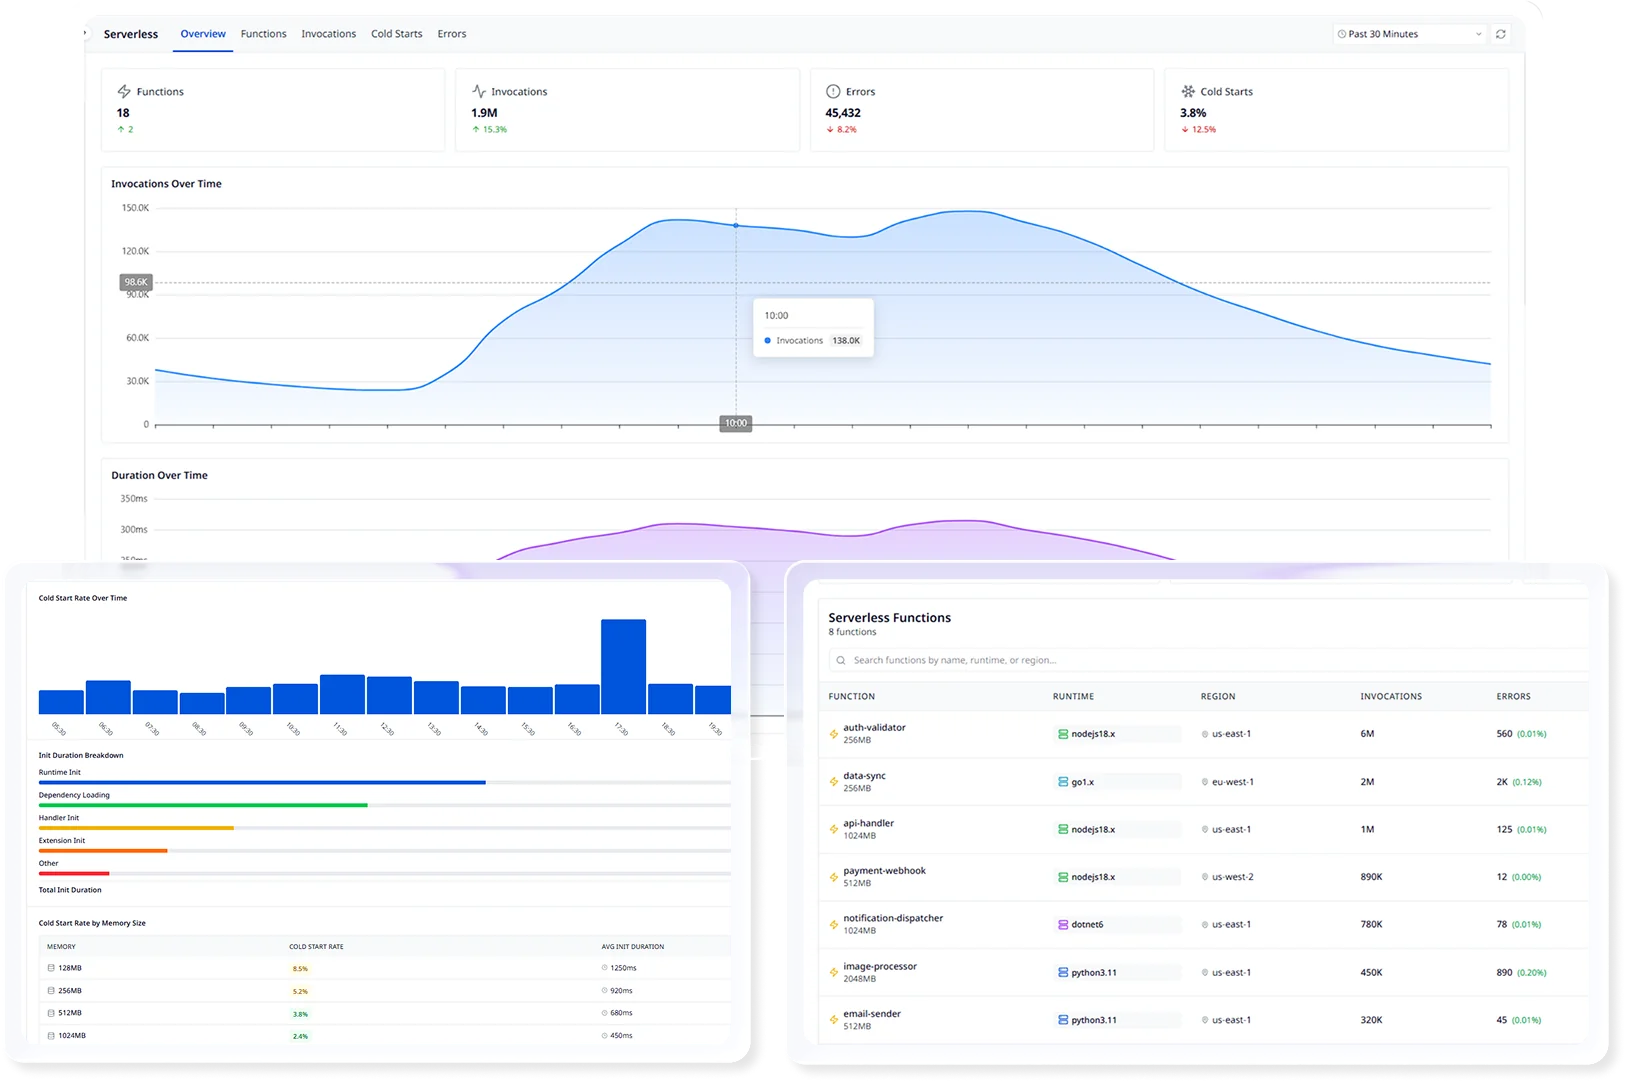
Every invocation. Every cold start.
See which calls paid the init cost, and which ones failed. The numbers follow your filter.
- Invocations
- 40
- Avg
- 164 ms
- P75
- 66 ms
- P90
- 472 ms
- P95
- 891 ms
- Errors
- 3
- 14:03:11.20436 msapigw200
- 14:03:09.474436 ms · coldapigw200
- 14:03:07.74448 mssqs200
- 14:03:06.014891 msapigw500
- 14:03:04.28460 msapigw200
- 14:03:02.55449 mssqs200
- 14:03:00.82438 msapigw200
Follow one request across functions.
Queues and topics stay on the same trace. Click a service to see where the time went.
- Starts at
- 43 ms
- Duration
- 840 ms (47.1% of trace)
- Status
- ok
The message waited 840 ms in order-queue before order-worker picked it up.
One layer for traces. One more for logs.
Add the Atatus layers to a Lambda function and see which settings it needs and what starts arriving.
- Atatus Lambda Extension
arn:aws:lambda:us-east-1:317265140635:layer:Atatus-Lambda-Extension-x86_64:4 - Atatus Node.js agent
arn:aws:lambda:us-east-1:317265140635:layer:Atatus-NodeJS:5 - Your handler
index.handler
- ATATUS_LICENSE_KEY
- <YOUR_API_KEY>
- AWS_LAMBDA_EXEC_WRAPPER
- /opt/atatus_wrapper
- Traces and errors from every invocation
- Function logs
- Extension logs
One function, at a glance.

Questions about serverless monitoring
Pricing, deployment, data and the agent. If something is missing, a person will answer it on a demo call.
Serverless monitoring shows how your functions behave: invocation count, execution duration and error rates, with metrics, logs and traces from each function. Atatus serverless monitoring also includes cold start tracking.
AWS Lambda functions written in Node.js and Python, Azure Functions on .NET, and Azure App Service applications in Node.js, .NET Core, Java and Python. Each has its own setup guide.
Yes. Cold start tracking is part of Atatus serverless monitoring, along with invocation duration and error analysis.
Yes. Atatus traces serverless functions in distributed transactions, so a request can be followed from your API into the function and on to the services it calls.
Add the Atatus Lambda Extension layer next to the agent layer and set ATATUS_EXTENSION_ENABLED. The extension collects data and sends it in bulk, and it can also send your function logs and its own extension logs to Atatus.
Atatus records each invocation's status and duration, so failed invocations stand out, and the agents capture errors with their stack traces. In Azure Functions you can also send ILogger LogError and LogCritical calls to Atatus as error logs.
Yes. Atatus serverless monitoring includes event source correlation, SQS queue latency and failure tracking, and SNS event flow monitoring, alongside distributed traces.
Add the Atatus layer for your runtime and set your license key. For Node.js, set AWS_LAMBDA_EXEC_WRAPPER to /opt/atatus_wrapper. For Python, point the handler at the Atatus tracer and keep your own handler in ATATUS_ORIGINAL_HANDLER. Both work with the Serverless Framework.