
Complete Azure Monitoring for Modern Applications
Get comprehensive visibility into your Azure infrastructure including Virtual Machines, App Services, Azure Functions, and Kubernetes. Monitor performance, availability, and costs across your Azure environment with unified dashboards and proactive alerting.
Full-Stack Observability for Azure Workloads
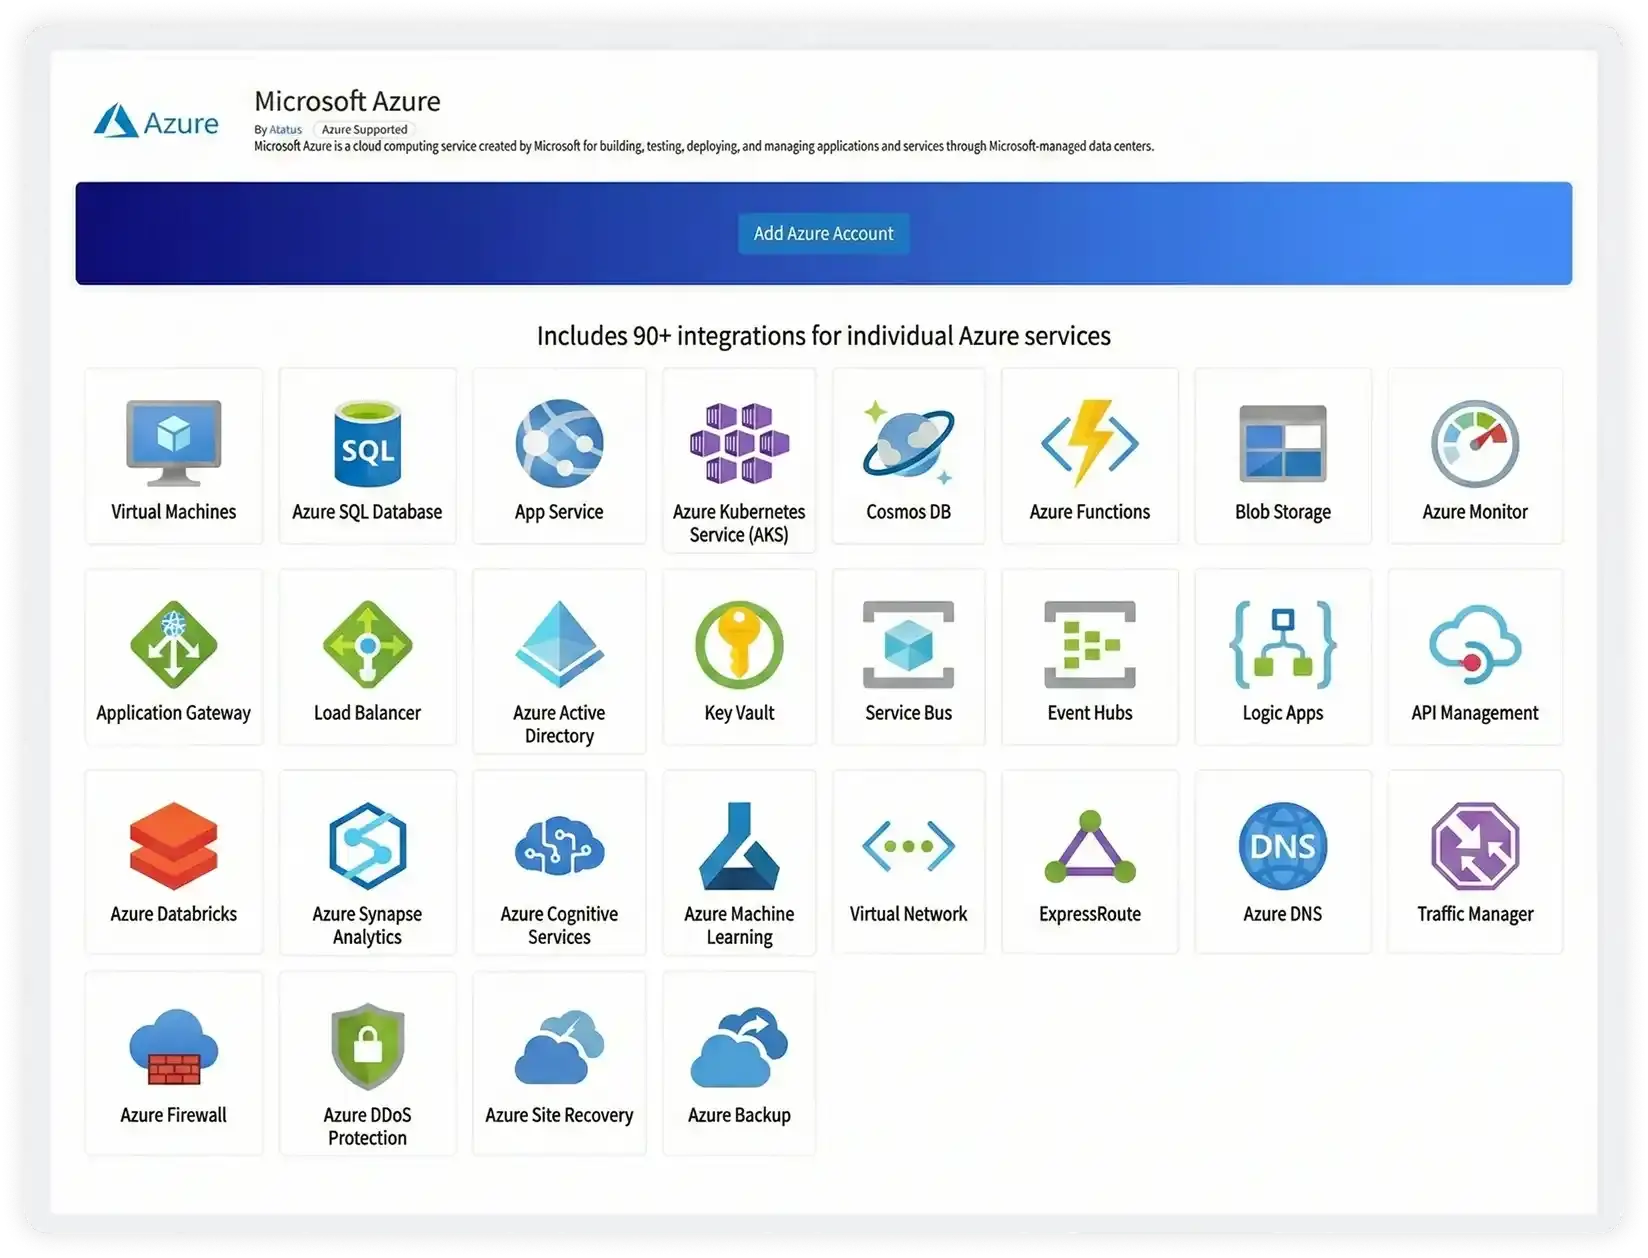
Comprehensive Azure coverage
Observe workloads running on Virtual Machines, App Services, AKS, Functions, Storage, and networking services.
AKS workload visibility
Track pod, node, and service behavior inside AKS clusters with application context intact.
Serverless execution clarity
Maintain visibility into Azure Functions where instances scale dynamically and execution is short-lived.
Cross-service request tracing
Follow requests across gateways, application services, background workers, and databases.
Contextual infrastructure signals
Interpret CPU, memory, and network metrics based on real application demand.
Unified telemetry correlation
Investigate issues using a single timeline that correlates logs, metrics, and traces.
Scalable observability model
Retain consistent visibility as subscriptions, services, and regions expand.
Aligned team visibility
Provide platform, SRE, and backend teams a shared operational understanding of production.
Azure Resource Graph Visibility
- Provide centralized visibility into Azure resources across multiple subscriptions, regions, and resource groups using Azure Resource Graph queries.
- Enable filtering and discovery of resources using dimensions such as tags, resource types, and subscription boundaries.
- Track configuration state and deployment status of ARM-managed resources to ensure consistency with intended infrastructure design.
- Detect configuration drift, misconfigurations, and failed or incomplete deployments at the individual resource level.
Monitoring & Metrics
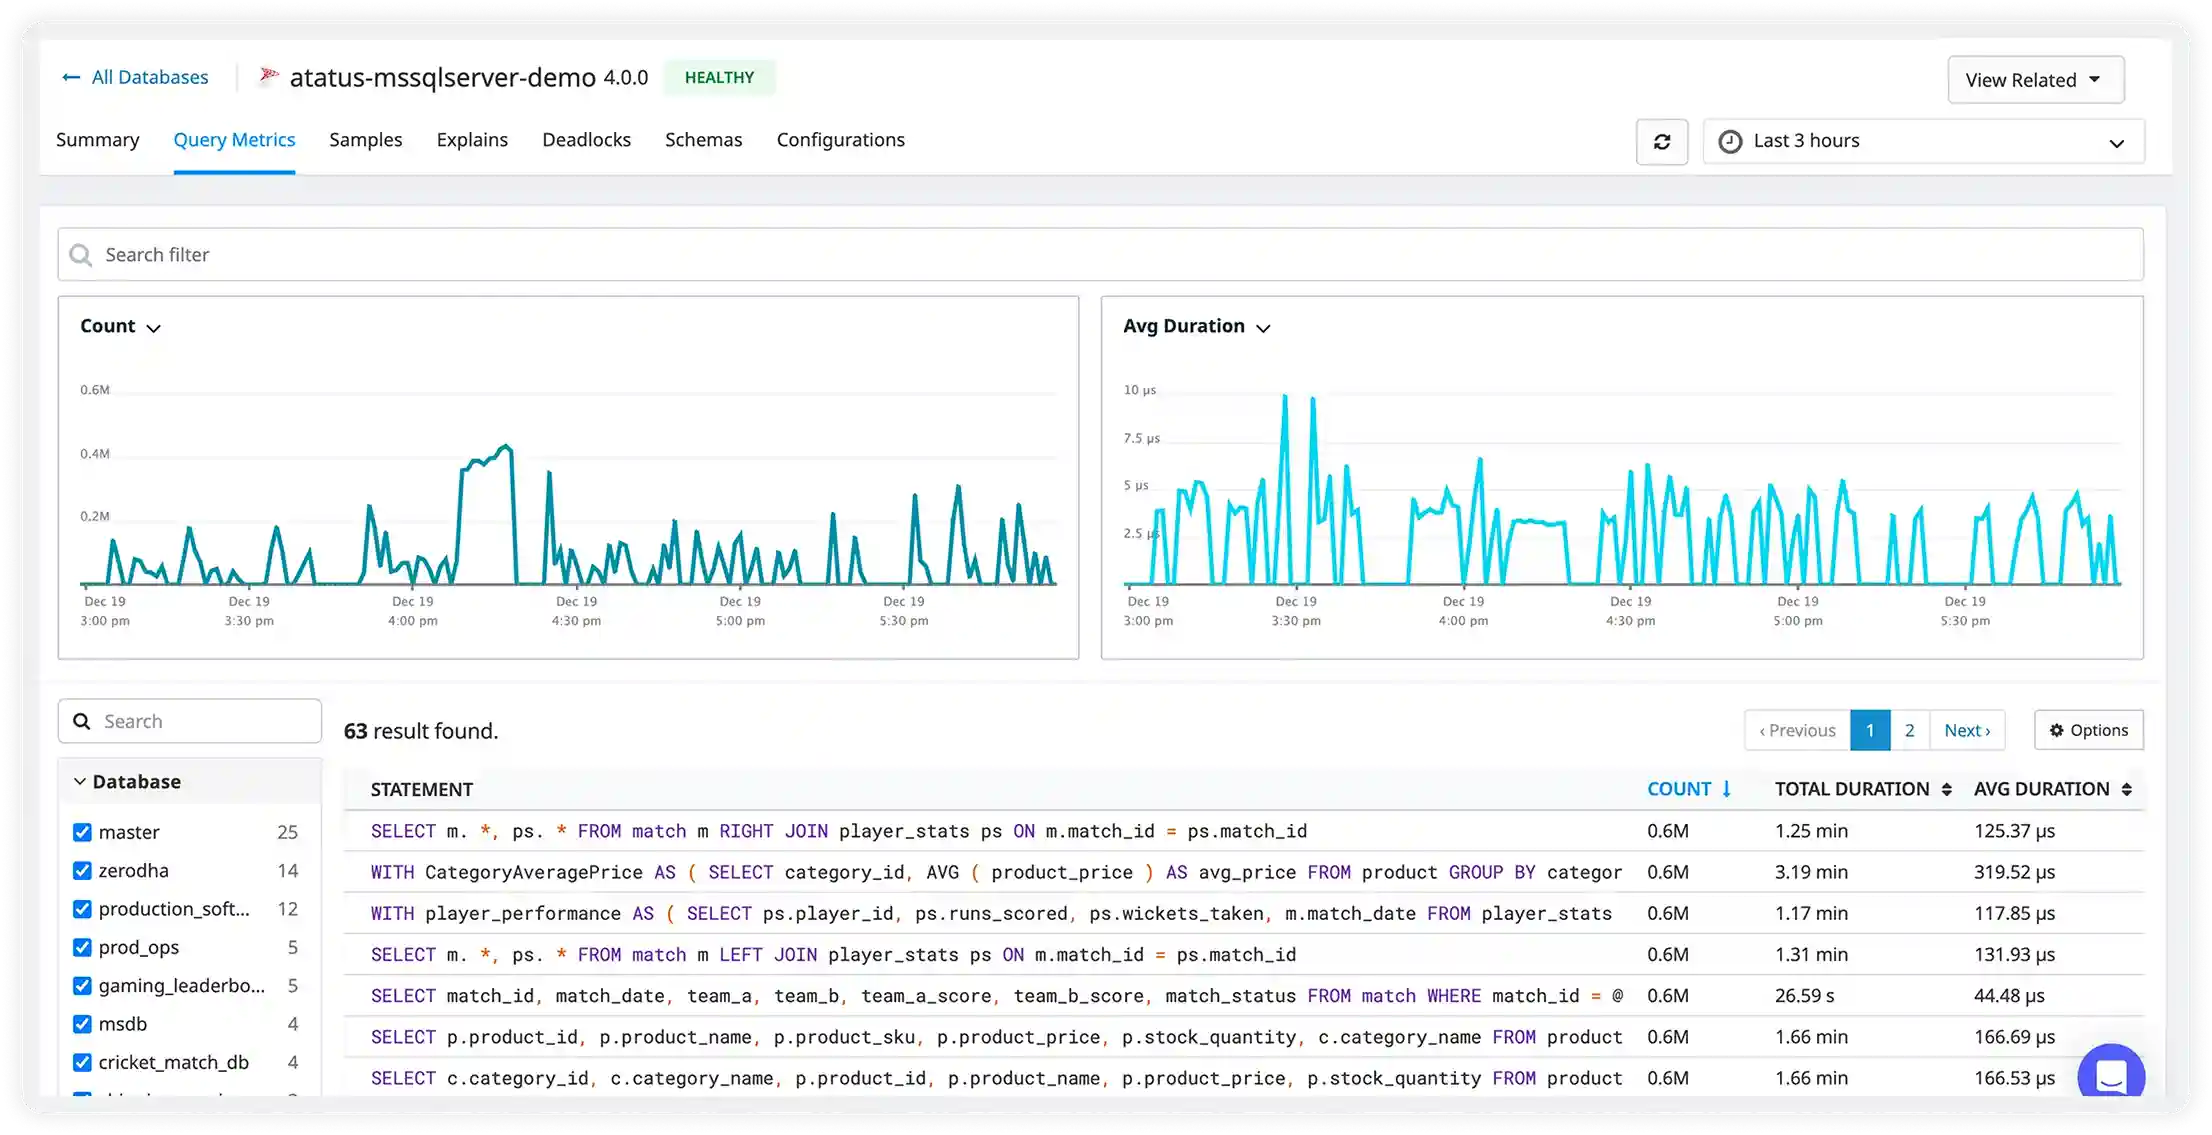
- Ingest native platform metrics and service health signals through Azure Monitor for real-time observability.
- Monitor compute, storage, networking, and managed Azure services using high-resolution time-series metrics.
- Analyze historical trends to support performance optimization, capacity planning, and cost-aware scaling decisions.
- Correlate metric anomalies with Azure platform events, maintenance windows, and service incidents to improve root cause analysis.
AKS & App Service Telemetry
- Monitor AKS cluster health including node conditions, pod lifecycle events, restarts, and resource utilization.
- Track App Service performance metrics such as request latency, HTTP error rates, throughput, and autoscale behavior.
- Gain visibility into application resource requests and limits to identify over-provisioning or resource contention.
- Correlate application performance signals with underlying Azure infrastructure metrics for full-stack observability.
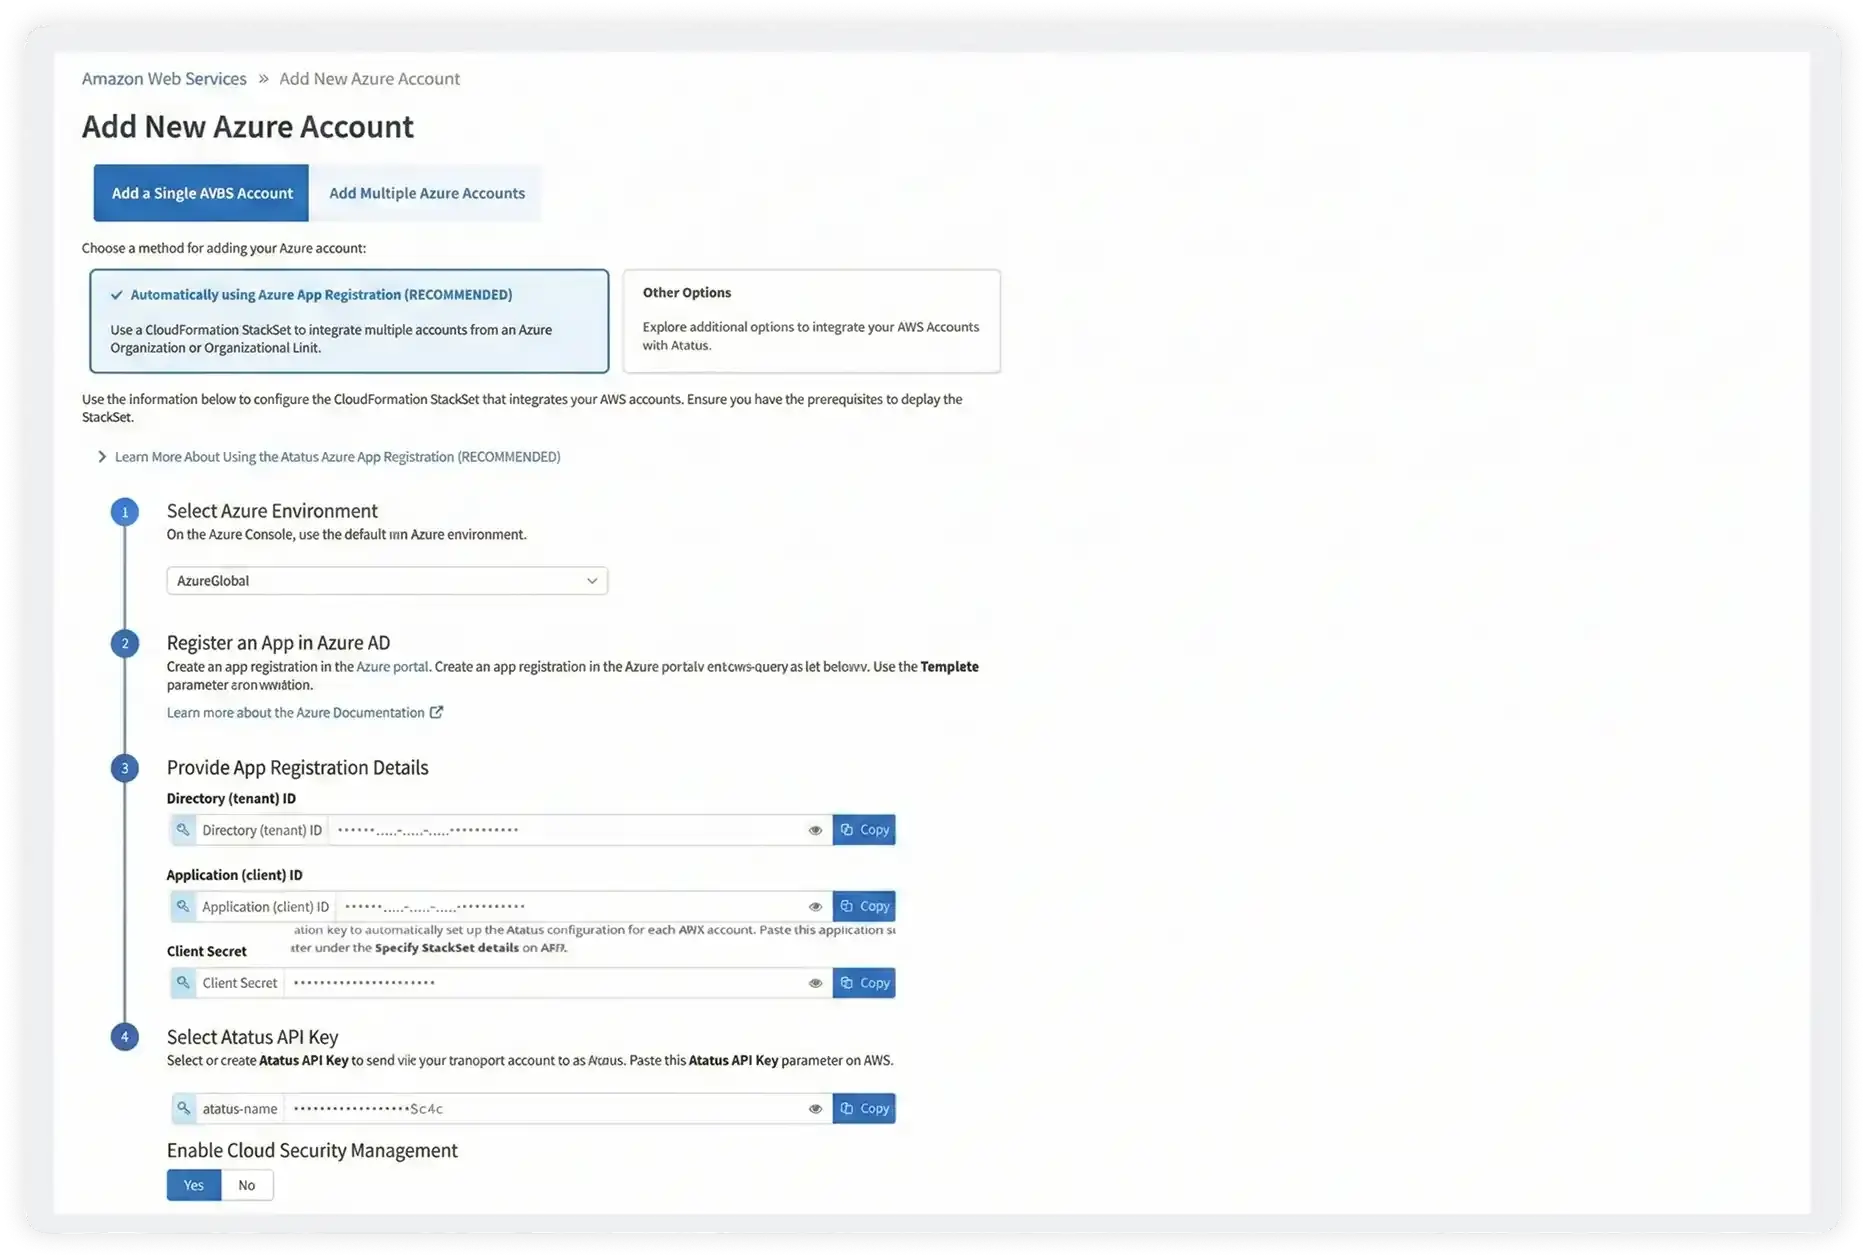
Why teams choose Atatus for Azure?
Azure teams choose Atatus for consistent observability across managed platforms, virtualized compute, and distributed services.
Aligned with Azure workloads
Atatus maps naturally to how Azure services are deployed and operated in production.
Clear execution context
Engineers can trace behavior across services without manual correlation.
Handles dynamic scaling
Visibility persists as Azure resources scale and rebalance under load.
Reduced investigation time
Teams reach root cause faster with coherent production context.
Easy team adoption
Developers and SREs gain value quickly without deep platform rework.
Operational confidence
Teams deploy and scale knowing production behavior remains visible.
Unified Observability for Every Engineering Team
Atatus adapts to how engineering teams work across development, operations, and reliability.
Developers
Trace requests, debug errors, and identify performance issues at the code level with clear context.
DevOps
Track deployments, monitor infrastructure impact, and understand how releases affect application stability.
Release Engineer
Measure service health, latency, and error rates to maintain reliability and reduce production risk.
Powering better performance
for modern teams
Feedback from teams improving monitoring and debugging workflows
"Solid Product even better support", The integration path is incredibly simple/easy and the overall interface is very intuitive. That said, I had a handful of odd use cases that the support team was incredibly responsive in helping me work through.

Wes D
Site Reliability Engineer