
Complete GCP Monitoring for Cloud-Native Applications
Monitor your Google Cloud Platform infrastructure with comprehensive visibility into Compute Engine, Cloud Functions, Cloud Run, and GKE. Track performance, optimize costs, and ensure reliability across your GCP environment with real-time observability.
Full-Stack Observability for GCP Workloads
End-to-end GCP coverage
Observe workloads running on Compute Engine, GKE, Cloud Run, App Engine, and managed databases with a unified operational view.
GKE workload visibility
Track pod behavior, node performance, and service communication inside Kubernetes clusters without losing application context.
Serverless execution clarity
Maintain visibility into Cloud Functions and Cloud Run executions where infrastructure is abstracted and short-lived.
Distributed request tracing
Follow requests across load balancers, APIs, background services, and data stores throughout GCP.
Application-aware infrastructure
Interpret CPU, memory, and network behavior in the context of real application traffic and workload demand.
Correlated telemetry timelines
Analyze logs, metrics, and traces together through a shared execution timeline during investigations.
Scale-ready observability
Maintain consistent visibility as services autoscale, traffic grows, and regions expand.
Shared operational context
Enable platform, SRE, and backend teams to operate from the same production view without data silos.
Unified GCP Monitoring
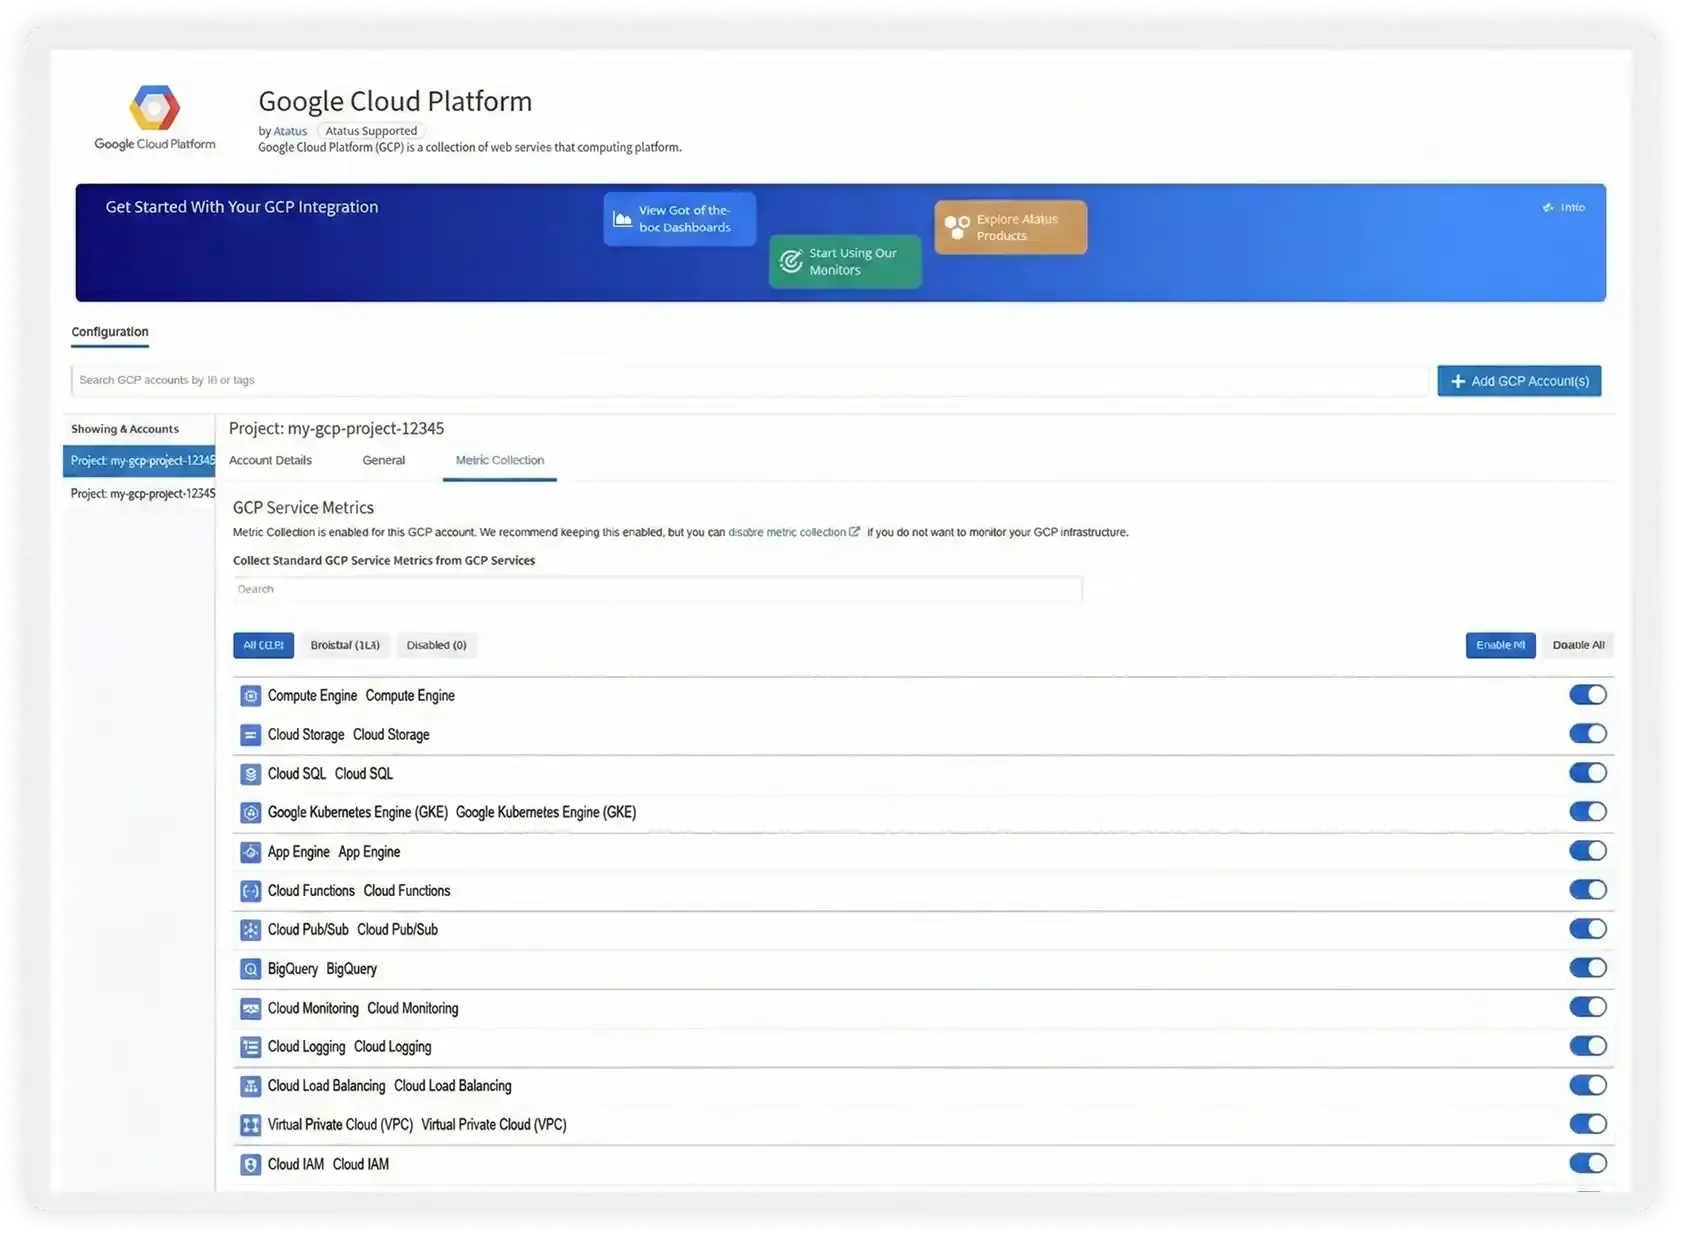
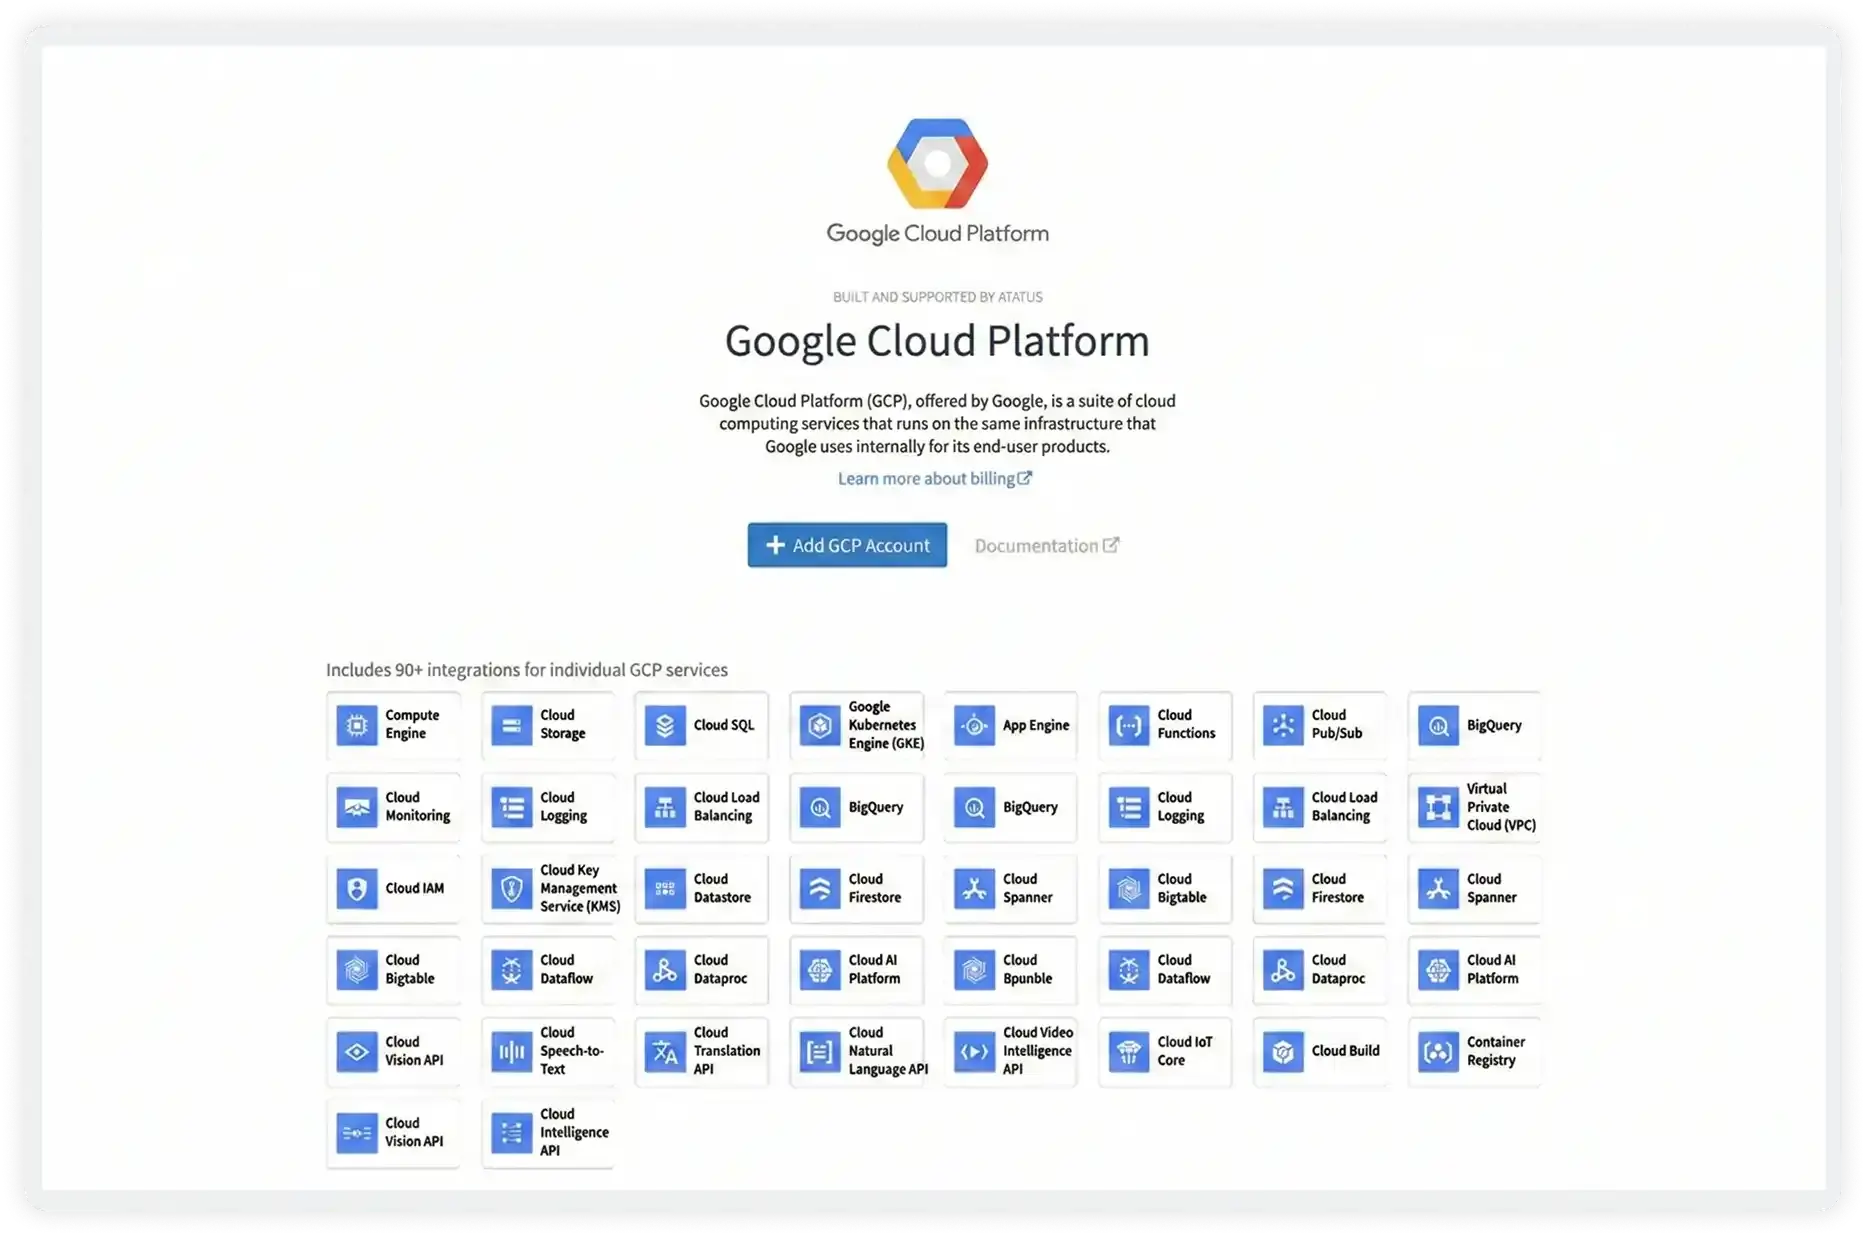
- Monitor core Google Cloud services including Compute Engine, Cloud Storage, GKE, Cloud SQL, Cloud APIs, and other managed services from a single platform.
- Centralize performance, availability, and health metrics across GCP services to eliminate monitoring silos.
- Visualize real-time metrics through customizable dashboards aligned to your GCP architecture and workloads.
- Configure service-specific metric collection to track uptime, performance, and reliability across cloud resources.
Operational Insights
- Correlate metrics, logs, and traces to identify performance bottlenecks across distributed GCP workloads.
- Track infrastructure resource usage such as CPU, memory, disk, and network I/O alongside application-level signals.
- Gain visibility into request flows, dependencies, and latency contributors across microservices and cloud components.
- Use actionable insights to improve reliability, reduce MTTR, and optimize day-to-day cloud operations.
Seamless GCP Integration
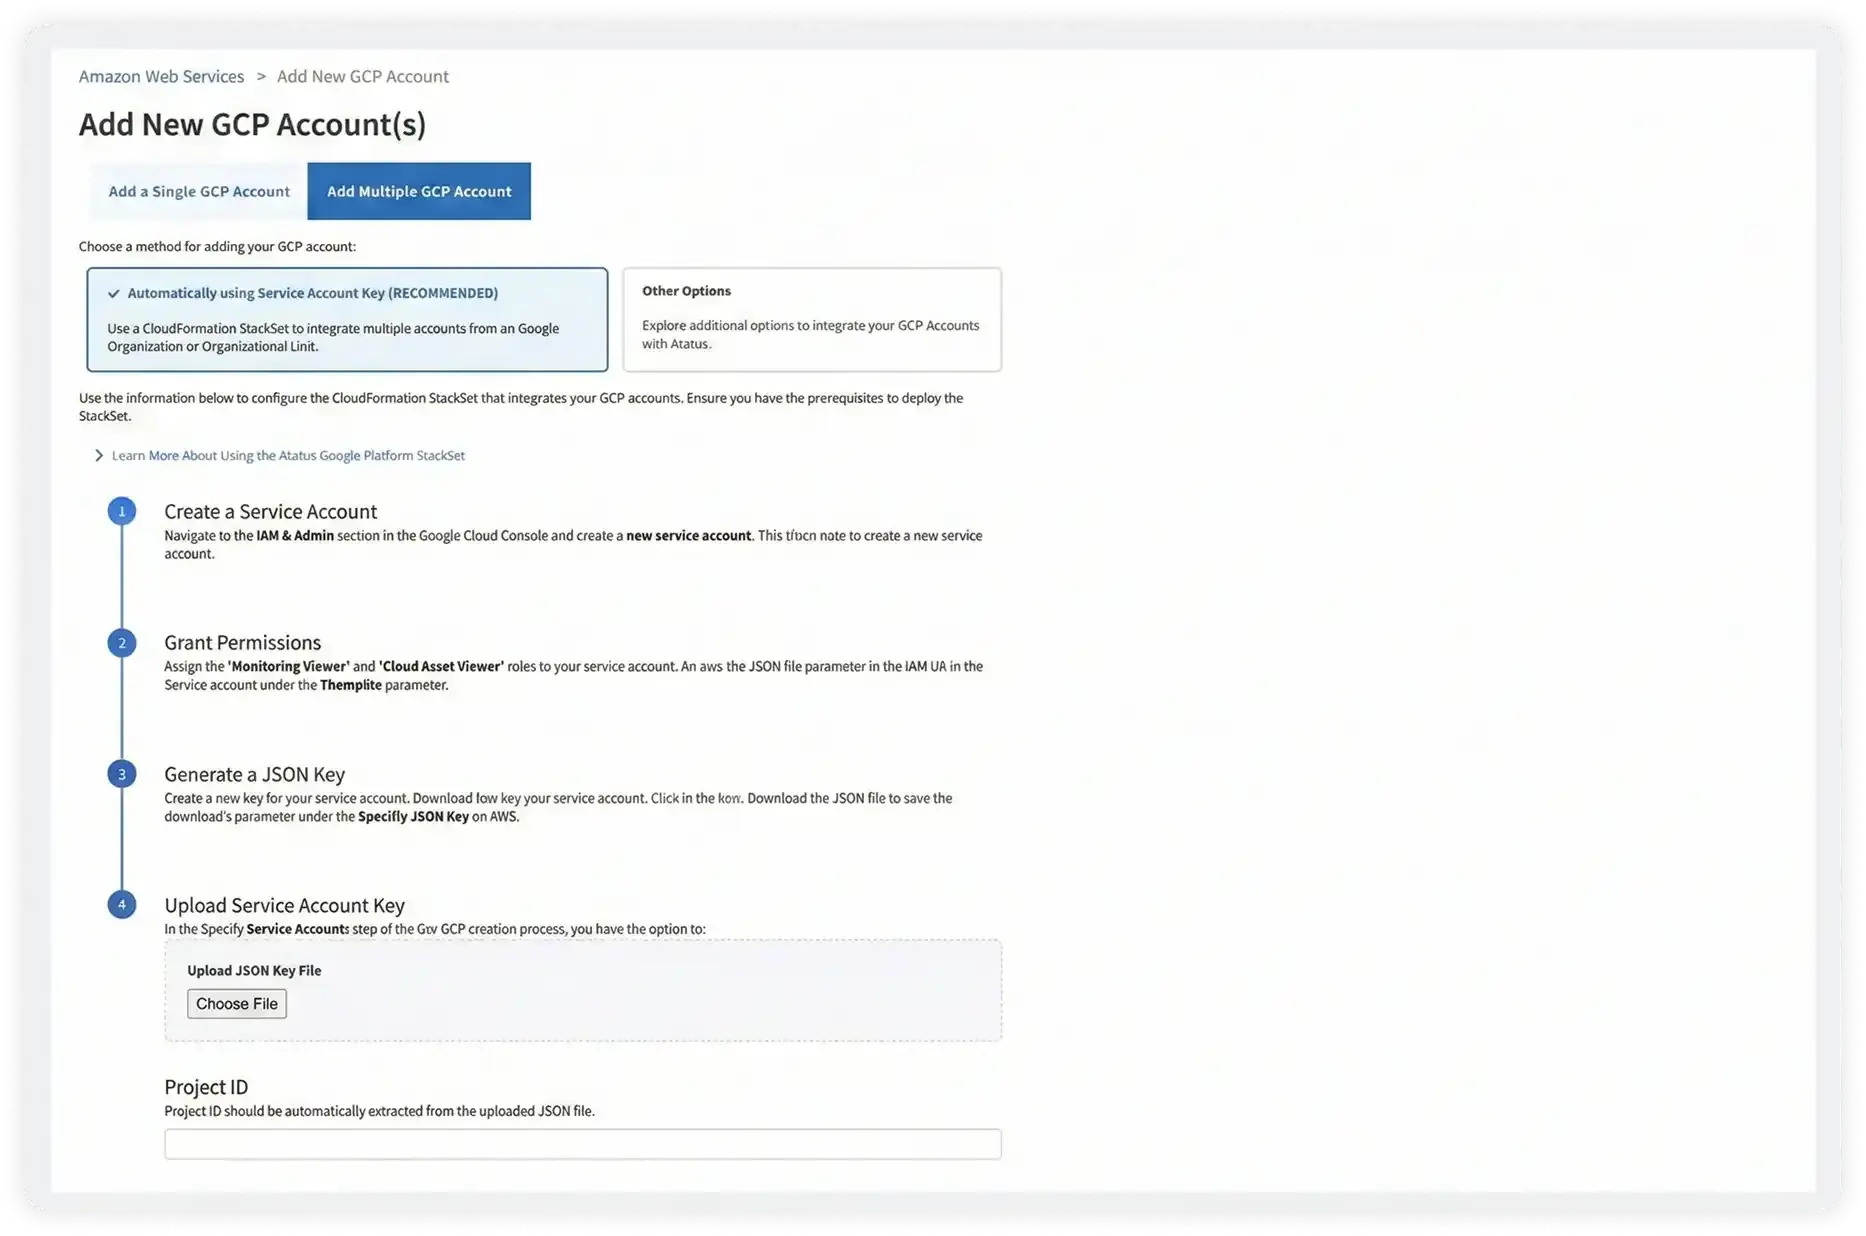
- Securely connect to Google Cloud Platform using IAM roles and service account impersonation for automated telemetry collection.
- Enable monitoring across multiple GCP projects to support large-scale, multi-environment deployments.
- Scale observability consistently as new projects, regions, and services are added without manual reconfiguration.
- Maintain strong access control, governance, and security while collecting metrics, logs, and traces from GCP resources.
Why teams choose Atatus for GCP?
Teams running on GCP choose Atatus to maintain clear production visibility across managed services, containers, and serverless workloads.
Designed for GCP architectures
Atatus aligns with how GCP services interact across compute, networking, and managed platforms.
Fast production understanding
Engineers can reason about live system behavior without stitching data across multiple tools.
Works with ephemeral workloads
Visibility remains intact even when containers and serverless instances scale rapidly.
Clear cross-service context
Production issues are understood in terms of service interactions, not isolated signals.
Low adoption friction
Teams onboard quickly without restructuring existing GCP environments.
Built for engineering teams
Platform, SRE, and backend teams share a common operational view of production.
Unified Observability for Every Engineering Team
Atatus adapts to how engineering teams work across development, operations, and reliability.
Developers
Trace requests, debug errors, and identify performance issues at the code level with clear context.
DevOps
Track deployments, monitor infrastructure impact, and understand how releases affect application stability.
Release Engineer
Measure service health, latency, and error rates to maintain reliability and reduce production risk.
Powering better performance
for modern teams
Feedback from teams improving monitoring and debugging workflows
"Solid Product even better support", The integration path is incredibly simple/easy and the overall interface is very intuitive. That said, I had a handful of odd use cases that the support team was incredibly responsive in helping me work through.

Wes D
Site Reliability Engineer