Request Throughput
Measures the number of API requests handled by Kong over time. Helps you understand usage patterns, identify traffic spikes, and scale infrastructure accordingly.
Monitor and analyze APIs passing through Kong Gateway with Atatus. Get real-time insights into API traffic, request-response data, latency, and error rates to ensure high performance and reliability.
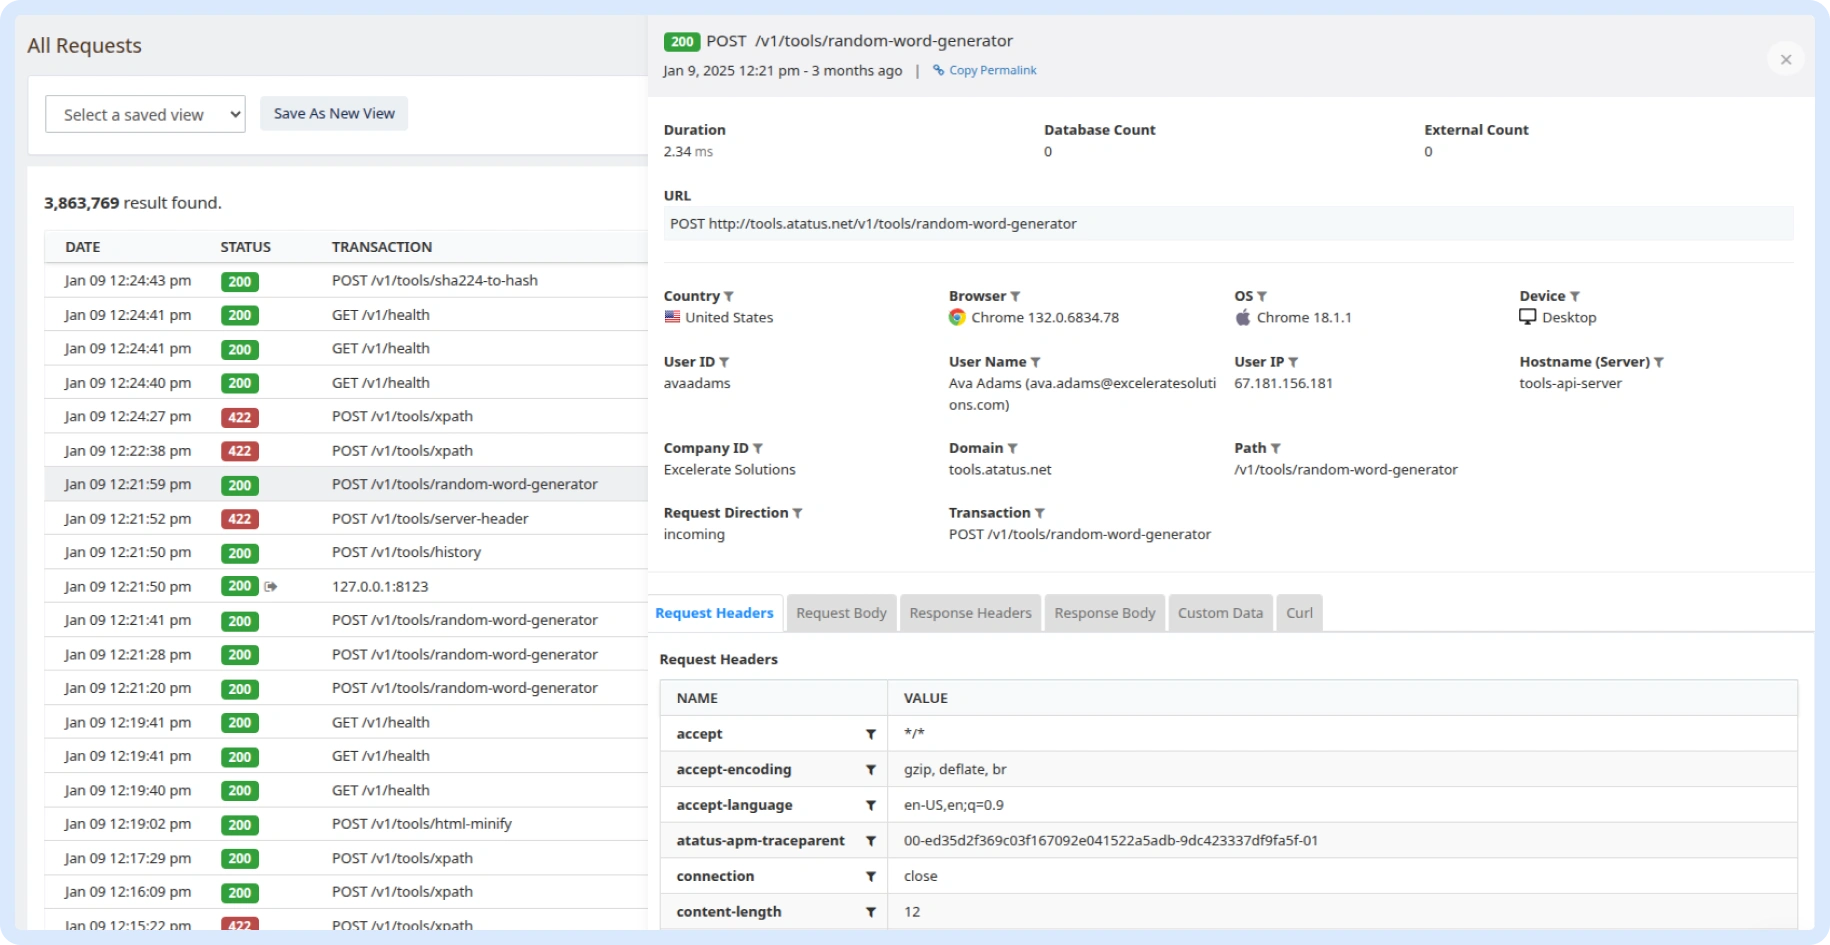
Measures the number of API requests handled by Kong over time. Helps you understand usage patterns, identify traffic spikes, and scale infrastructure accordingly.
Provides visibility into API usage by individual consumers or clients. Useful for tracking API adoption, enforcing rate limits, and understanding user behavior.
Monitors the availability and status codes returned by upstream services connected to Kong. Detects service downtime, degraded endpoints, and supports automatic failover decisions.
Atatus adapts to how engineering teams work across development, operations, and reliability.
Debug errors and slow paths with the full context of what happened.
Atatus for developersTrack deployments and see how each release affects stability.
Atatus for DevOpsWatch latency and error rates to ship with less production risk.
Atatus for release engineersMonitor API throughput, response timing, latency distribution, and usage trends from Kong Gateway to understand how your APIs perform in production.
Without throughput metrics, spikes or drops in API usage remain hidden, obscuring real demand on your services.
Overall averages mask response-time distribution, and viewing latency percentiles highlights when APIs start lagging under load.
Individual routes can slow down even if overall performance looks normal, and route-level timing shows which endpoints contribute most to latency.
Without segmented insights, it is difficult to see which clients or consumers generate the most traffic over time.
Historic throughput and timing trends reveal gradual regressions that may not trigger immediate alerts but can affect reliability.
Pricing, deployment, data and the agent. If something is missing, a person will answer it on a demo call.
Kong API monitoring refers to tracking the performance and usage of APIs managed through Kong Gateway. It helps teams detect issues early, measure latency, and understand usage patterns through Kong API analytics. Monitoring is essential to ensure high availability, performance, and security across your APIs. Without it, bottlenecks, failures, or anomalies could go unnoticed, impacting both end users and backend systems.
Atatus API Analytics provides deep insights into API traffic by capturing API calls, user behavior, and trends across your Kong Gateway. It enables tracking of API usage by individual users or companies, monitors errors, and supports advanced filtering and segmentation for debugging and analytics. Atatus also offers real-time alerts, API monetization insights, and retention tracking, helping you optimize your API strategies effectively.
Some of the best Kong observability tools include:
Each tool offers unique strengths in visualizing Kong API Gateway metrics and traffic.
Key Kong API Gateway metrics you should track include:
These API monitoring metrics ensure reliable performance, scalability, and security of your APIs.
Integrating Atatus with Kong Gateway is seamless and efficient. Here is a quick look at how it works and why it’s optimized for performance and flexibility:
1. Visibility into API Usage
2. Error and Anomaly Detection
3. Performance Monitoring
4. Business Insights
5. Data-Driven Decision Making
6. Security and Compliance
To monitor APIs in Kong Gateway, you can:
This setup gives you real-time visibility into your API behavior, helping with optimization and troubleshooting.