Celery Monitoring
Gain precise visibility into task execution and queue efficiency. Atatus helps you identify and resolve performance bottlenecks to keep your Celery tasks running smoothly.

Where Celery production clarity breaks
Task Execution Ambiguity
Tasks execute asynchronously across distributed workers, making it difficult to confirm when, where, and how tasks actually ran in production.
Fragmented Task Context
Failures surface without complete task state, input data, or execution history, forcing engineers to reconstruct behavior after the fact.
Slow Failure Attribution
Identifying whether issues originate in task logic, scheduling behavior, or downstream systems takes longer due to execution decoupling.
Retry Loop Blindness
Automatic retries silently alter execution paths, obscuring whether failures are transient, systemic, or logic-related.
Hidden Queue Backlogs
Queue depth grows gradually over time, remaining unnoticed until processing delays begin affecting dependent workflows.
Noisy Error Signals
Task failures trigger alerts without sufficient execution context, increasing noise during high-volume failure scenarios.
Scaling Worker Pressure
Increasing task volume stresses worker pools and concurrency limits in ways teams cannot clearly observe in real time.
Declining Operational Trust
Repeated blind task failures reduce confidence in background processing reliability during critical workflows.
Complete Performance Visibility for
Celery Workloads
Real-time observability for Celery that helps teams track task execution, manage queue performance, and maintain reliable background processing at scale.
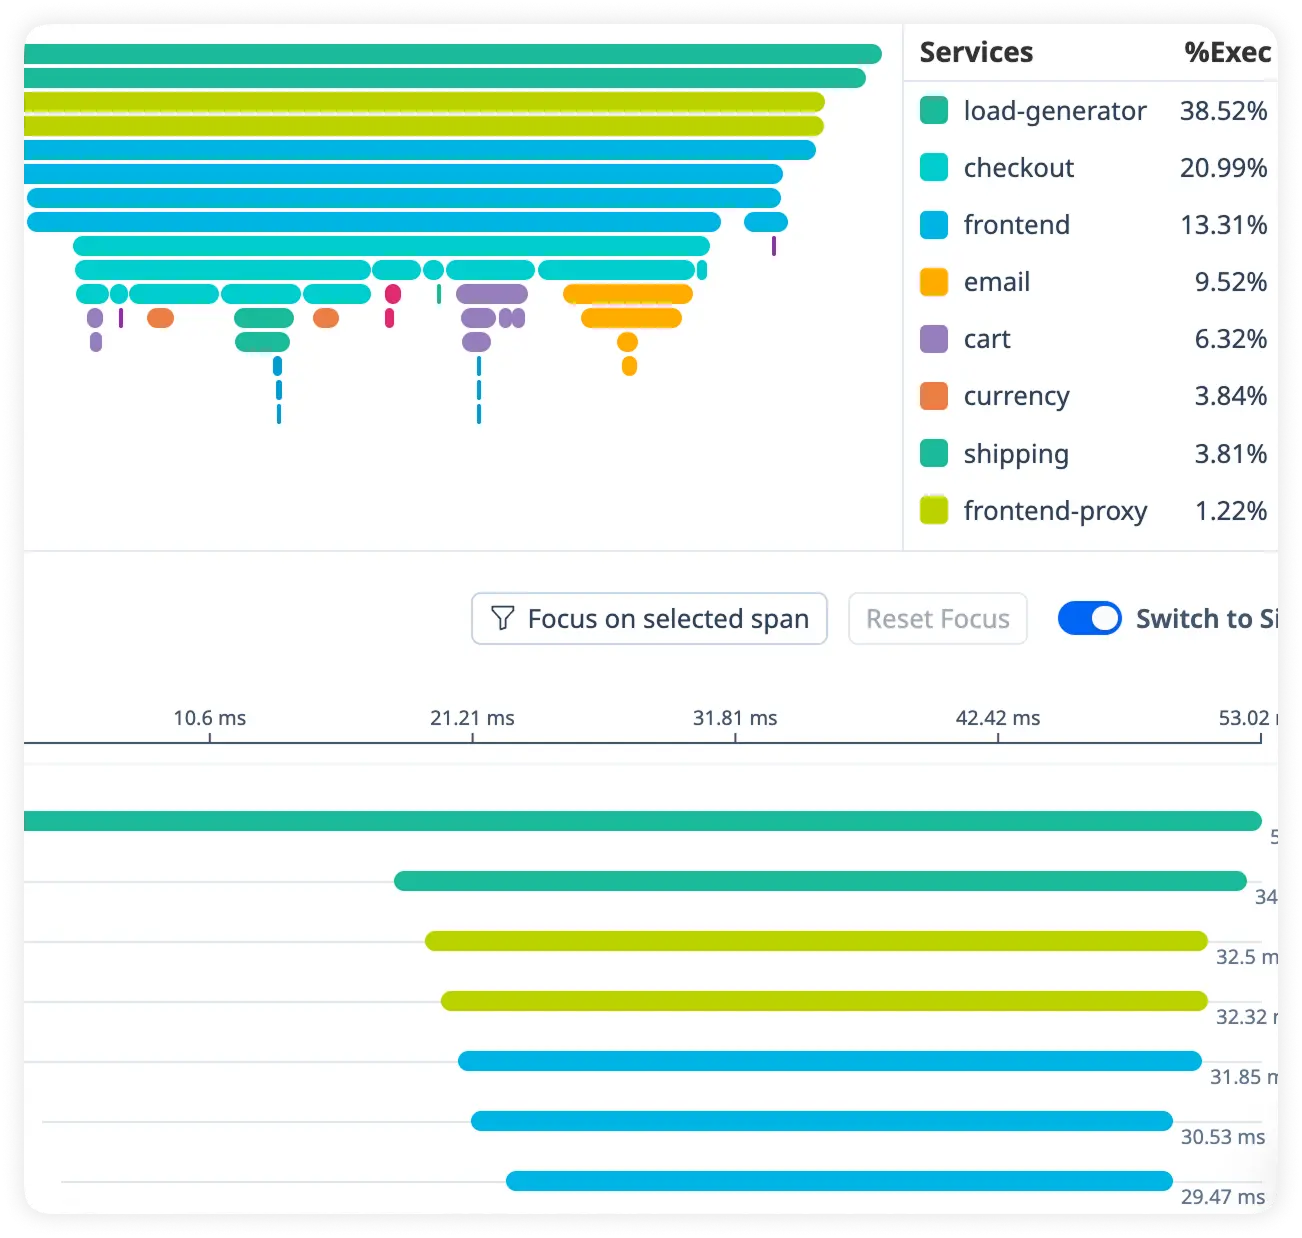
Trace Task Execution End-to-End
Follow tasks across queues and workers with full execution timelines to isolate slow processing and failures quickly.
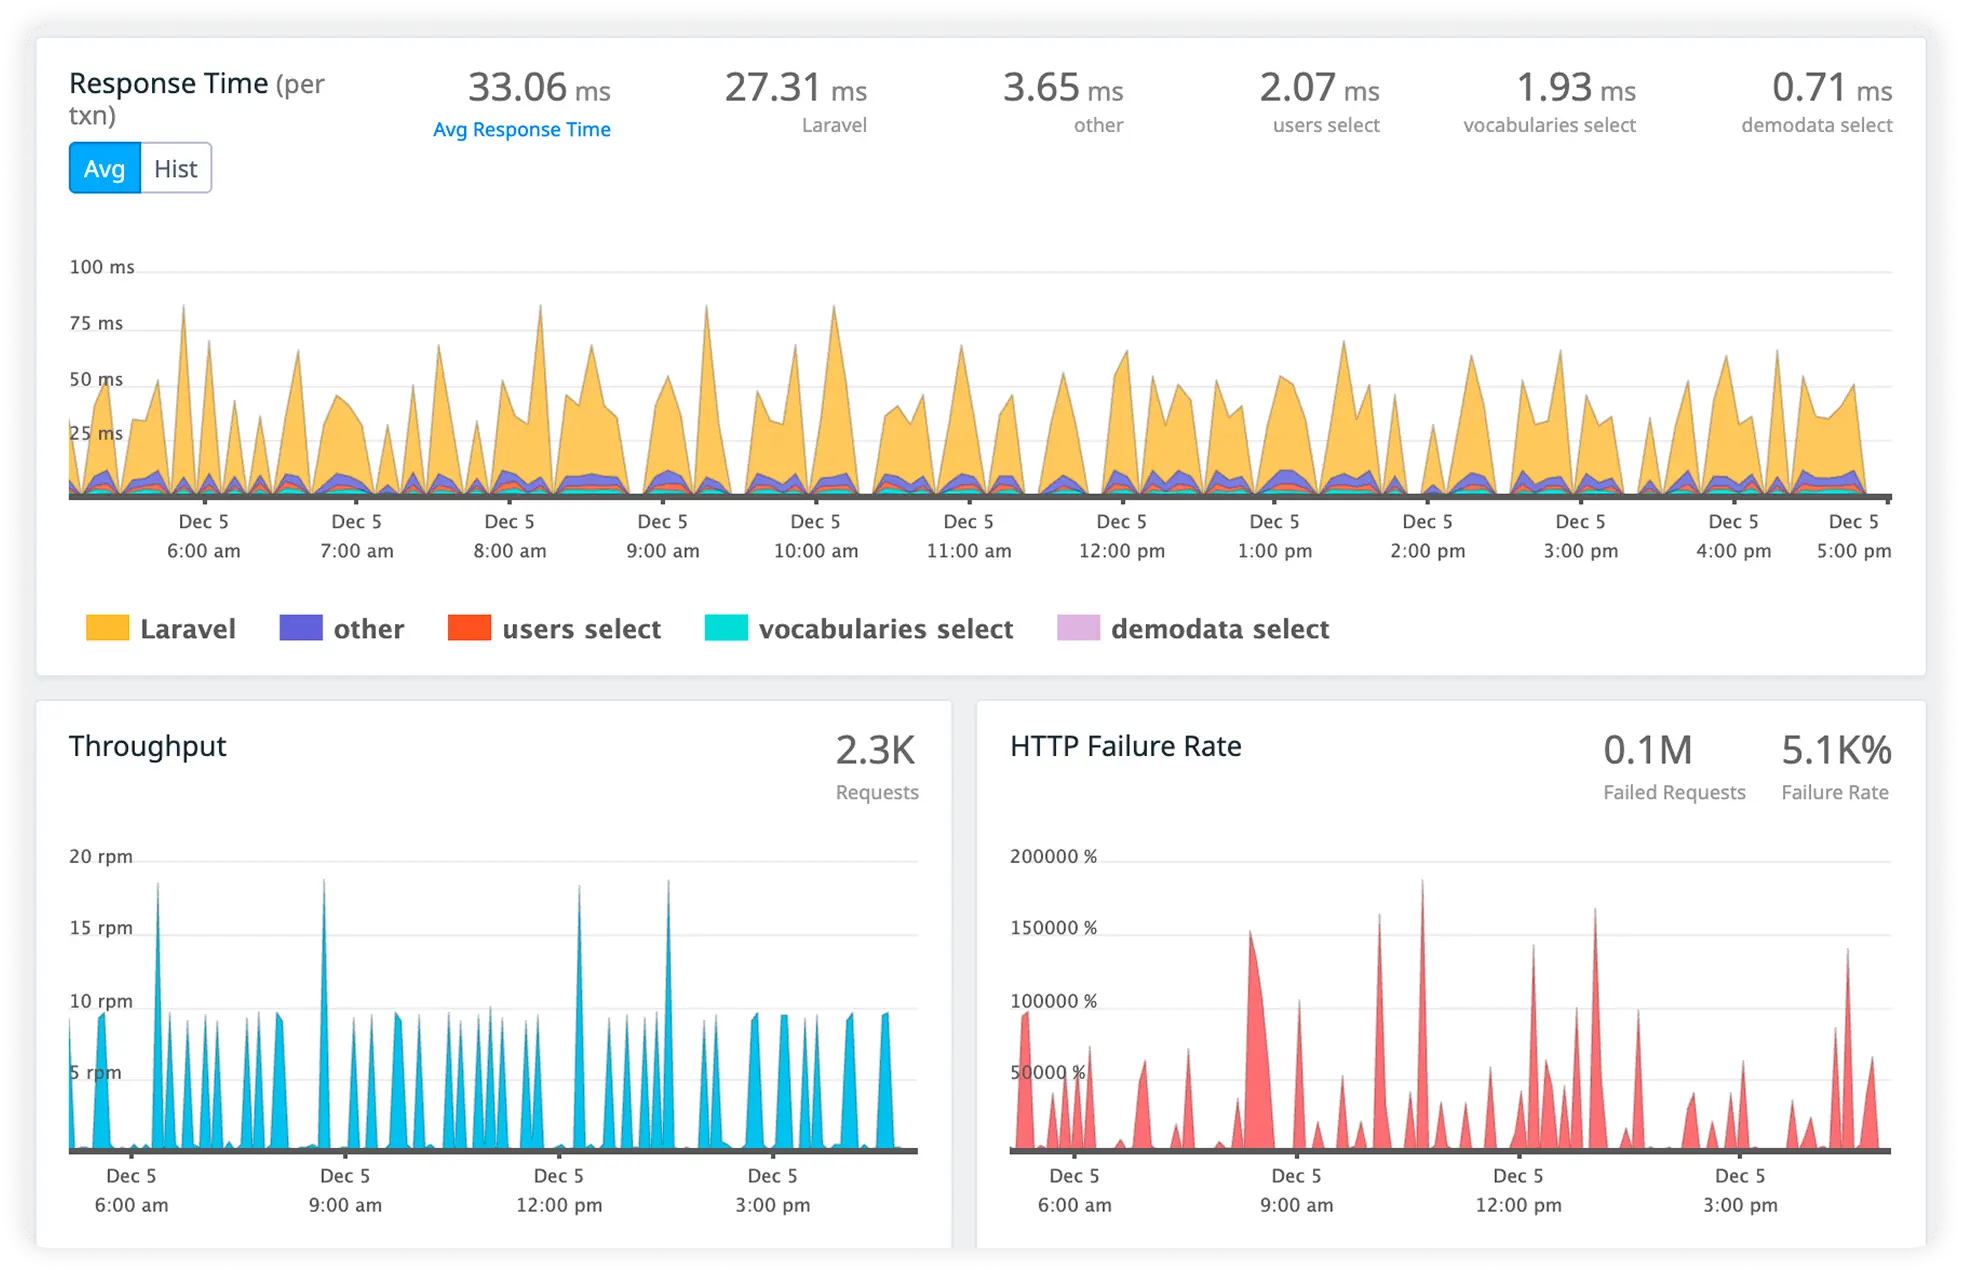
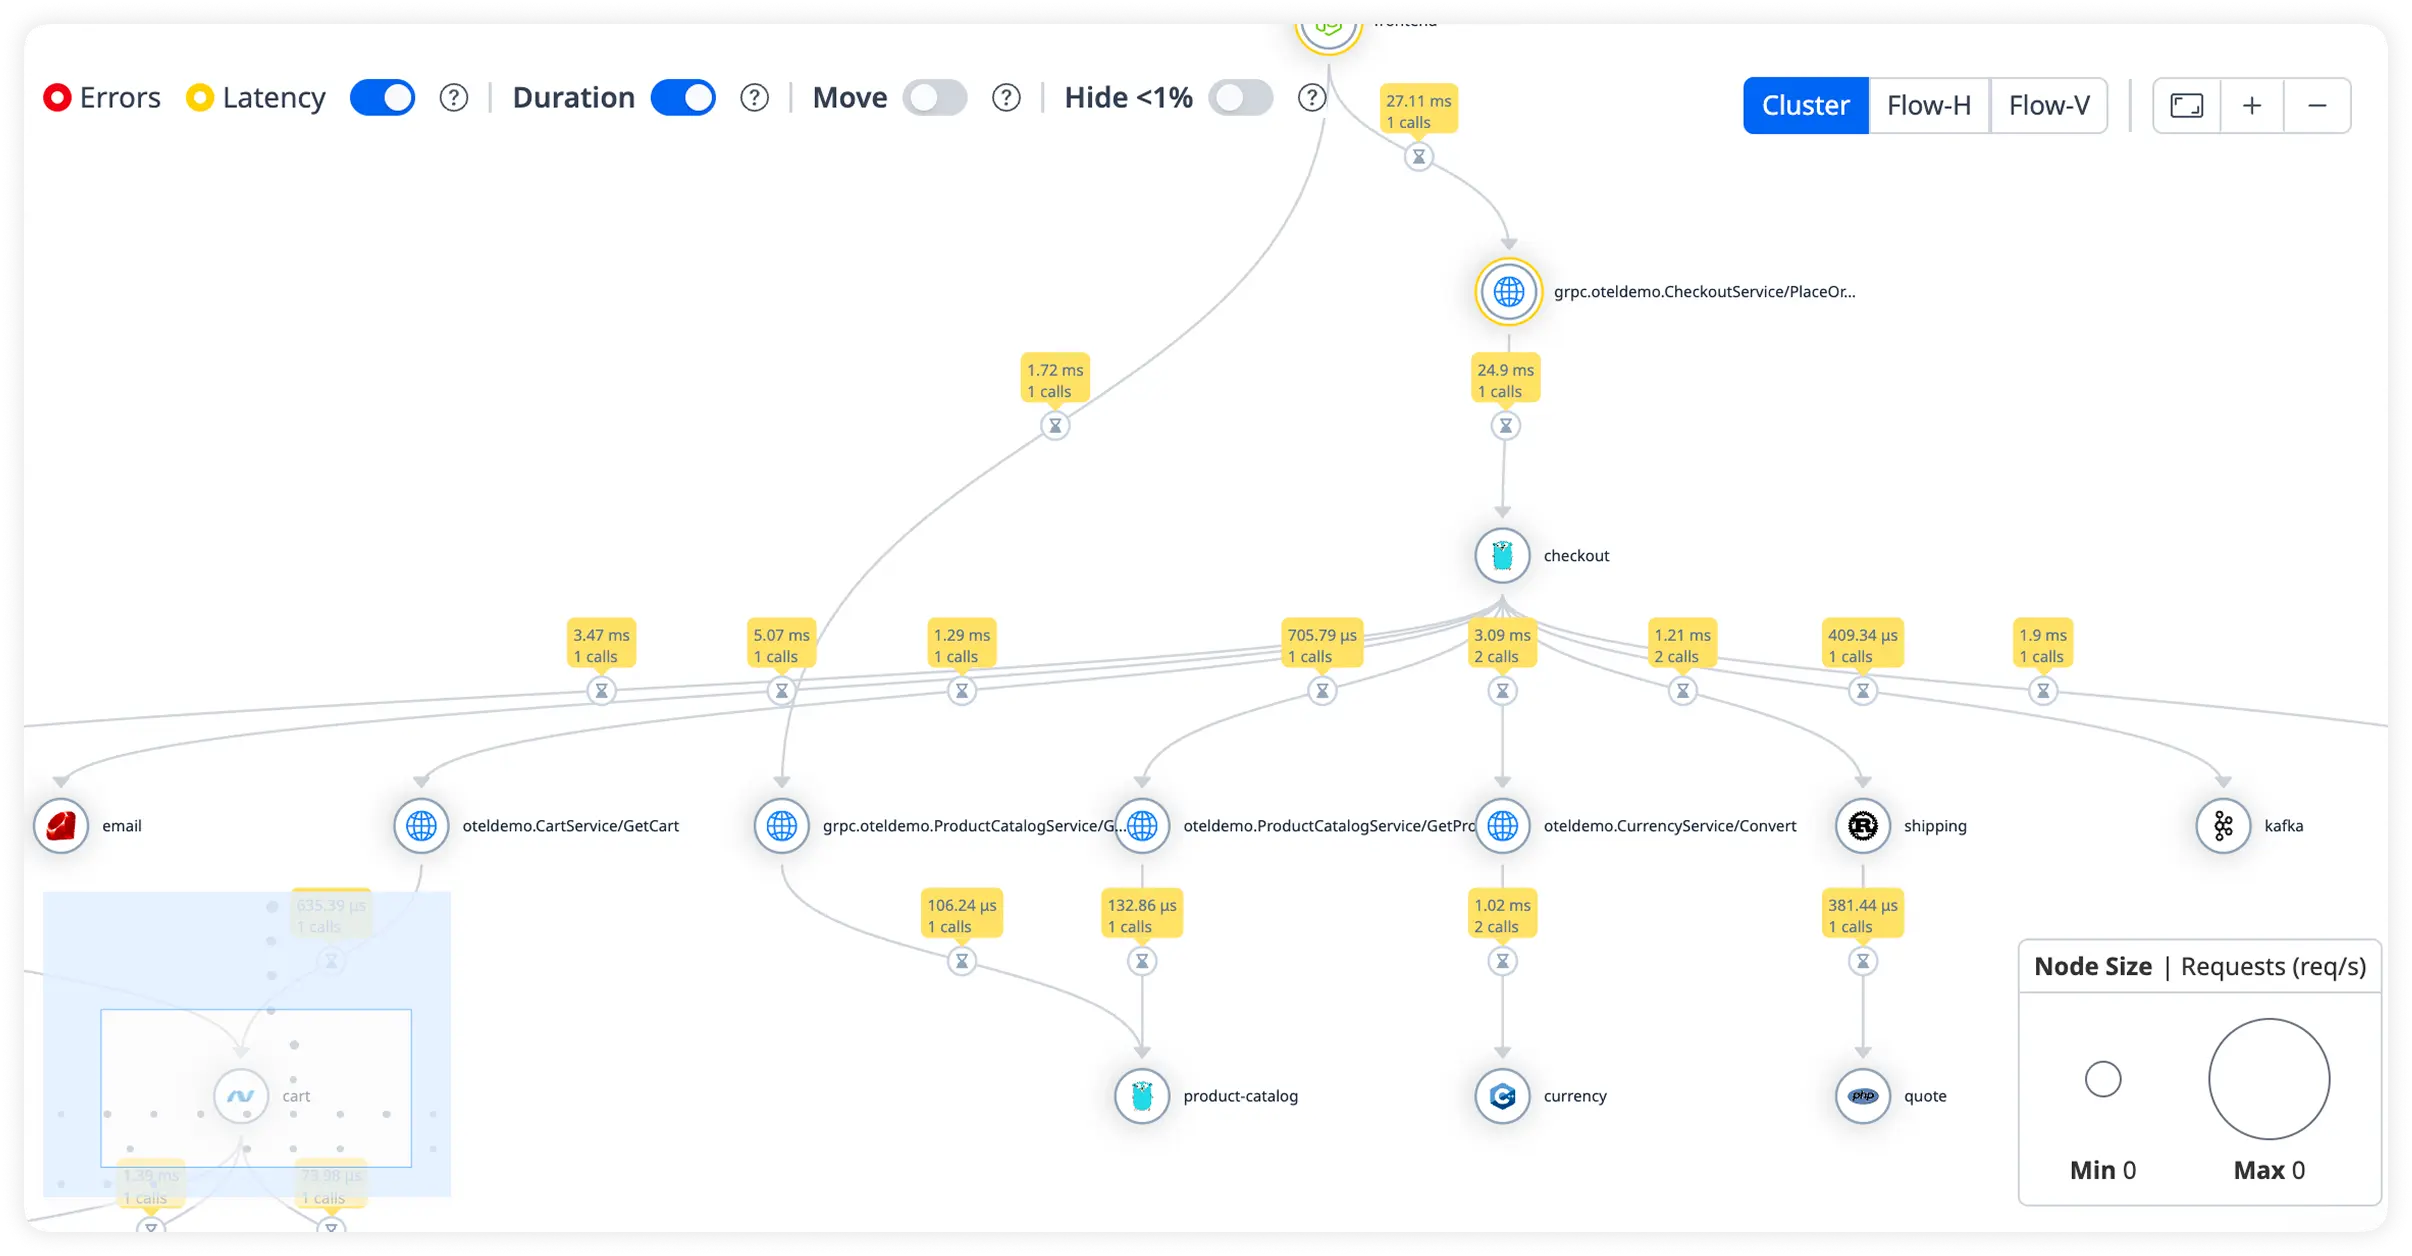
Visualize Worker Dependencies
Understand how workers interact with databases and external services using live performance metrics.
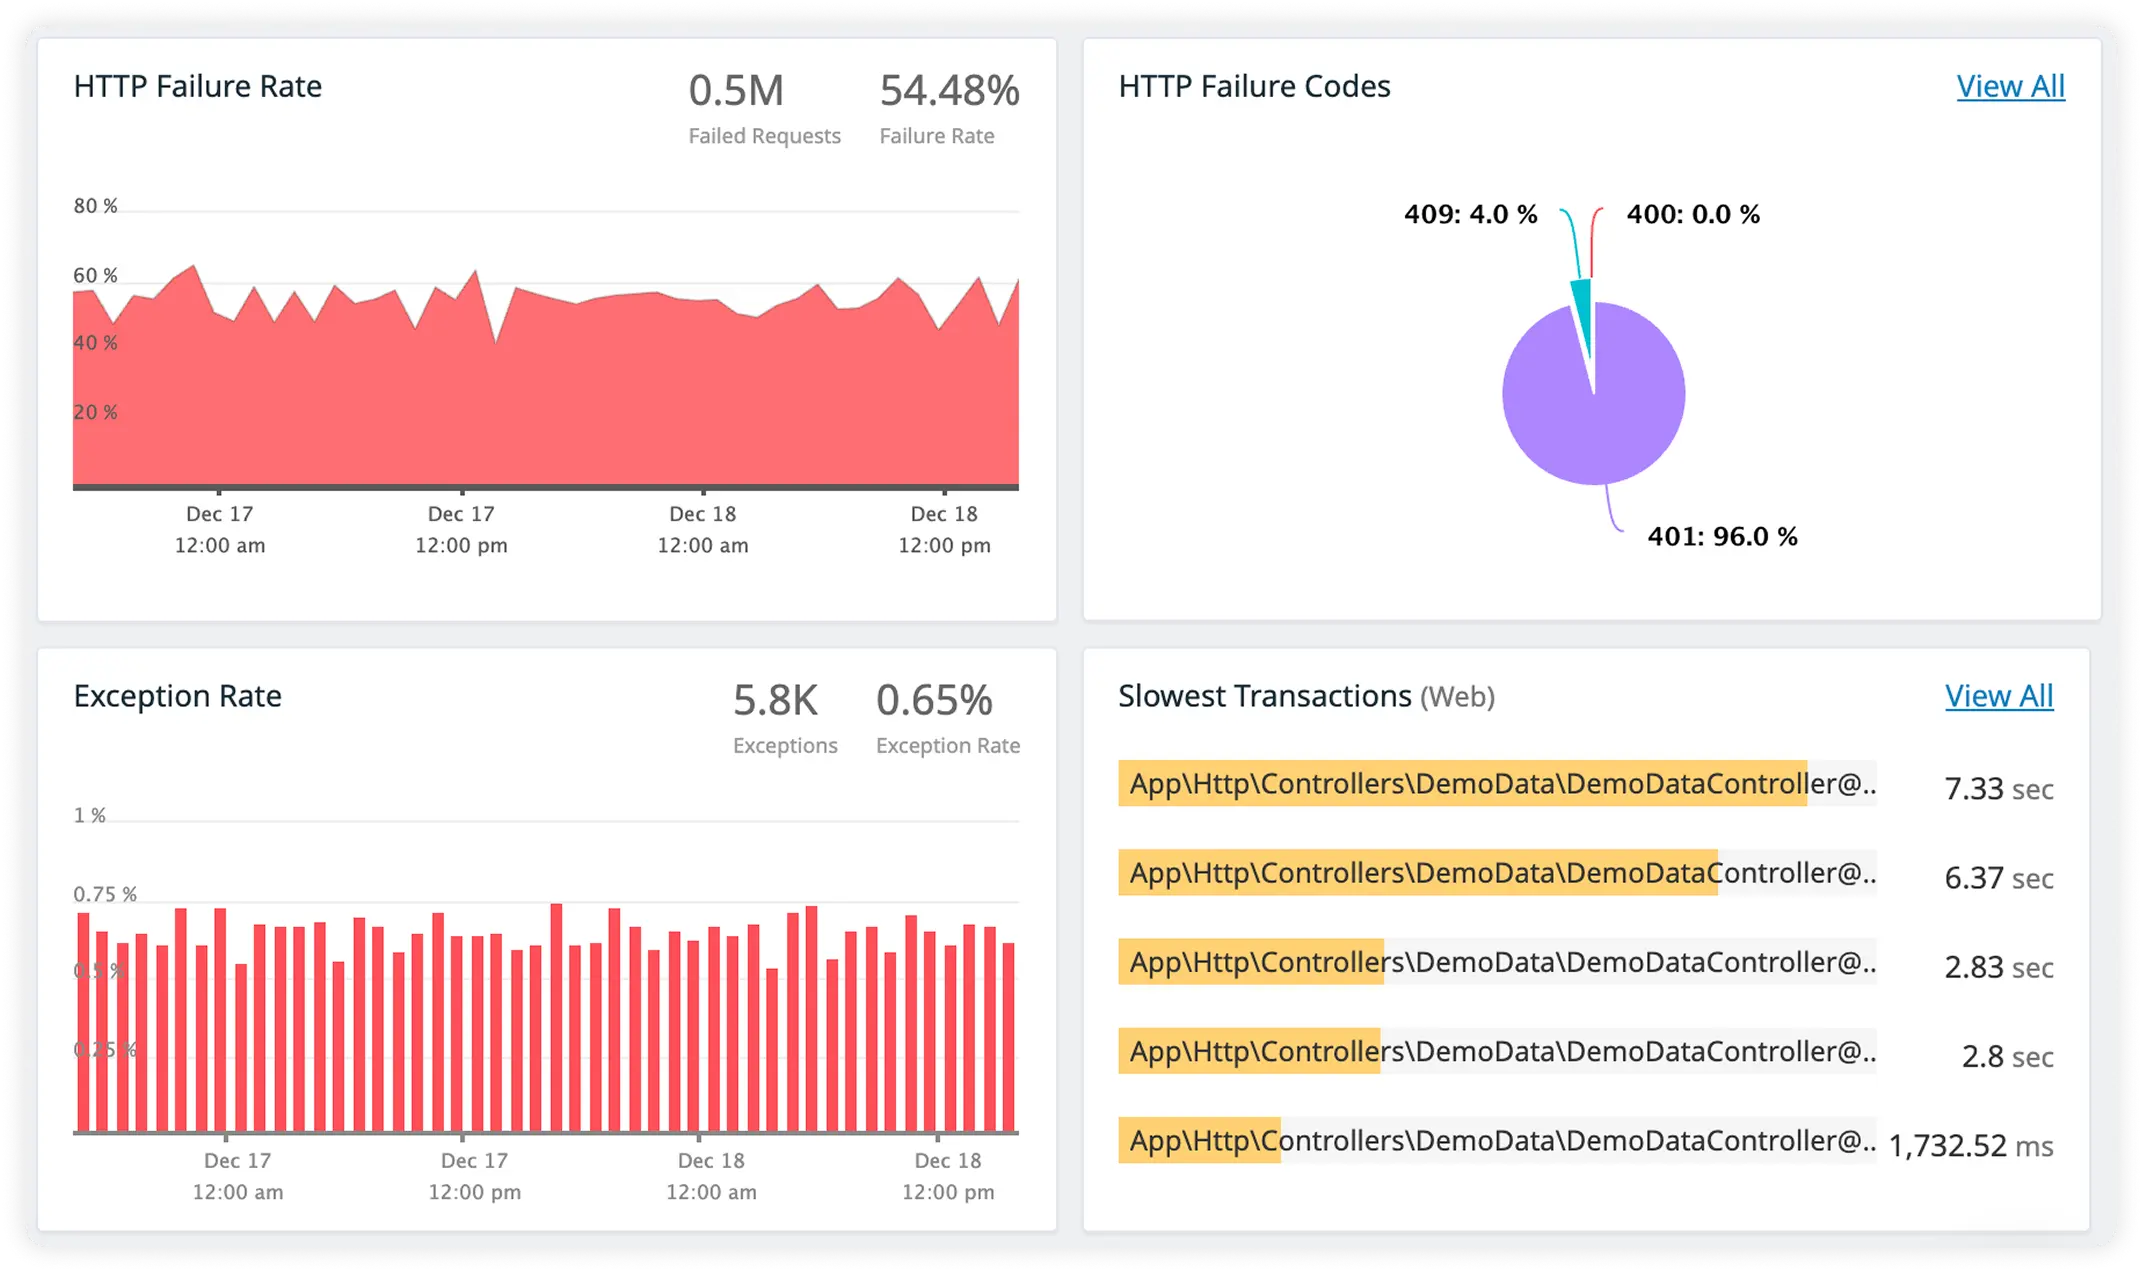
Monitor High-Impact Jobs
Track long-running tasks, retries, and throughput trends to keep background processing reliable.
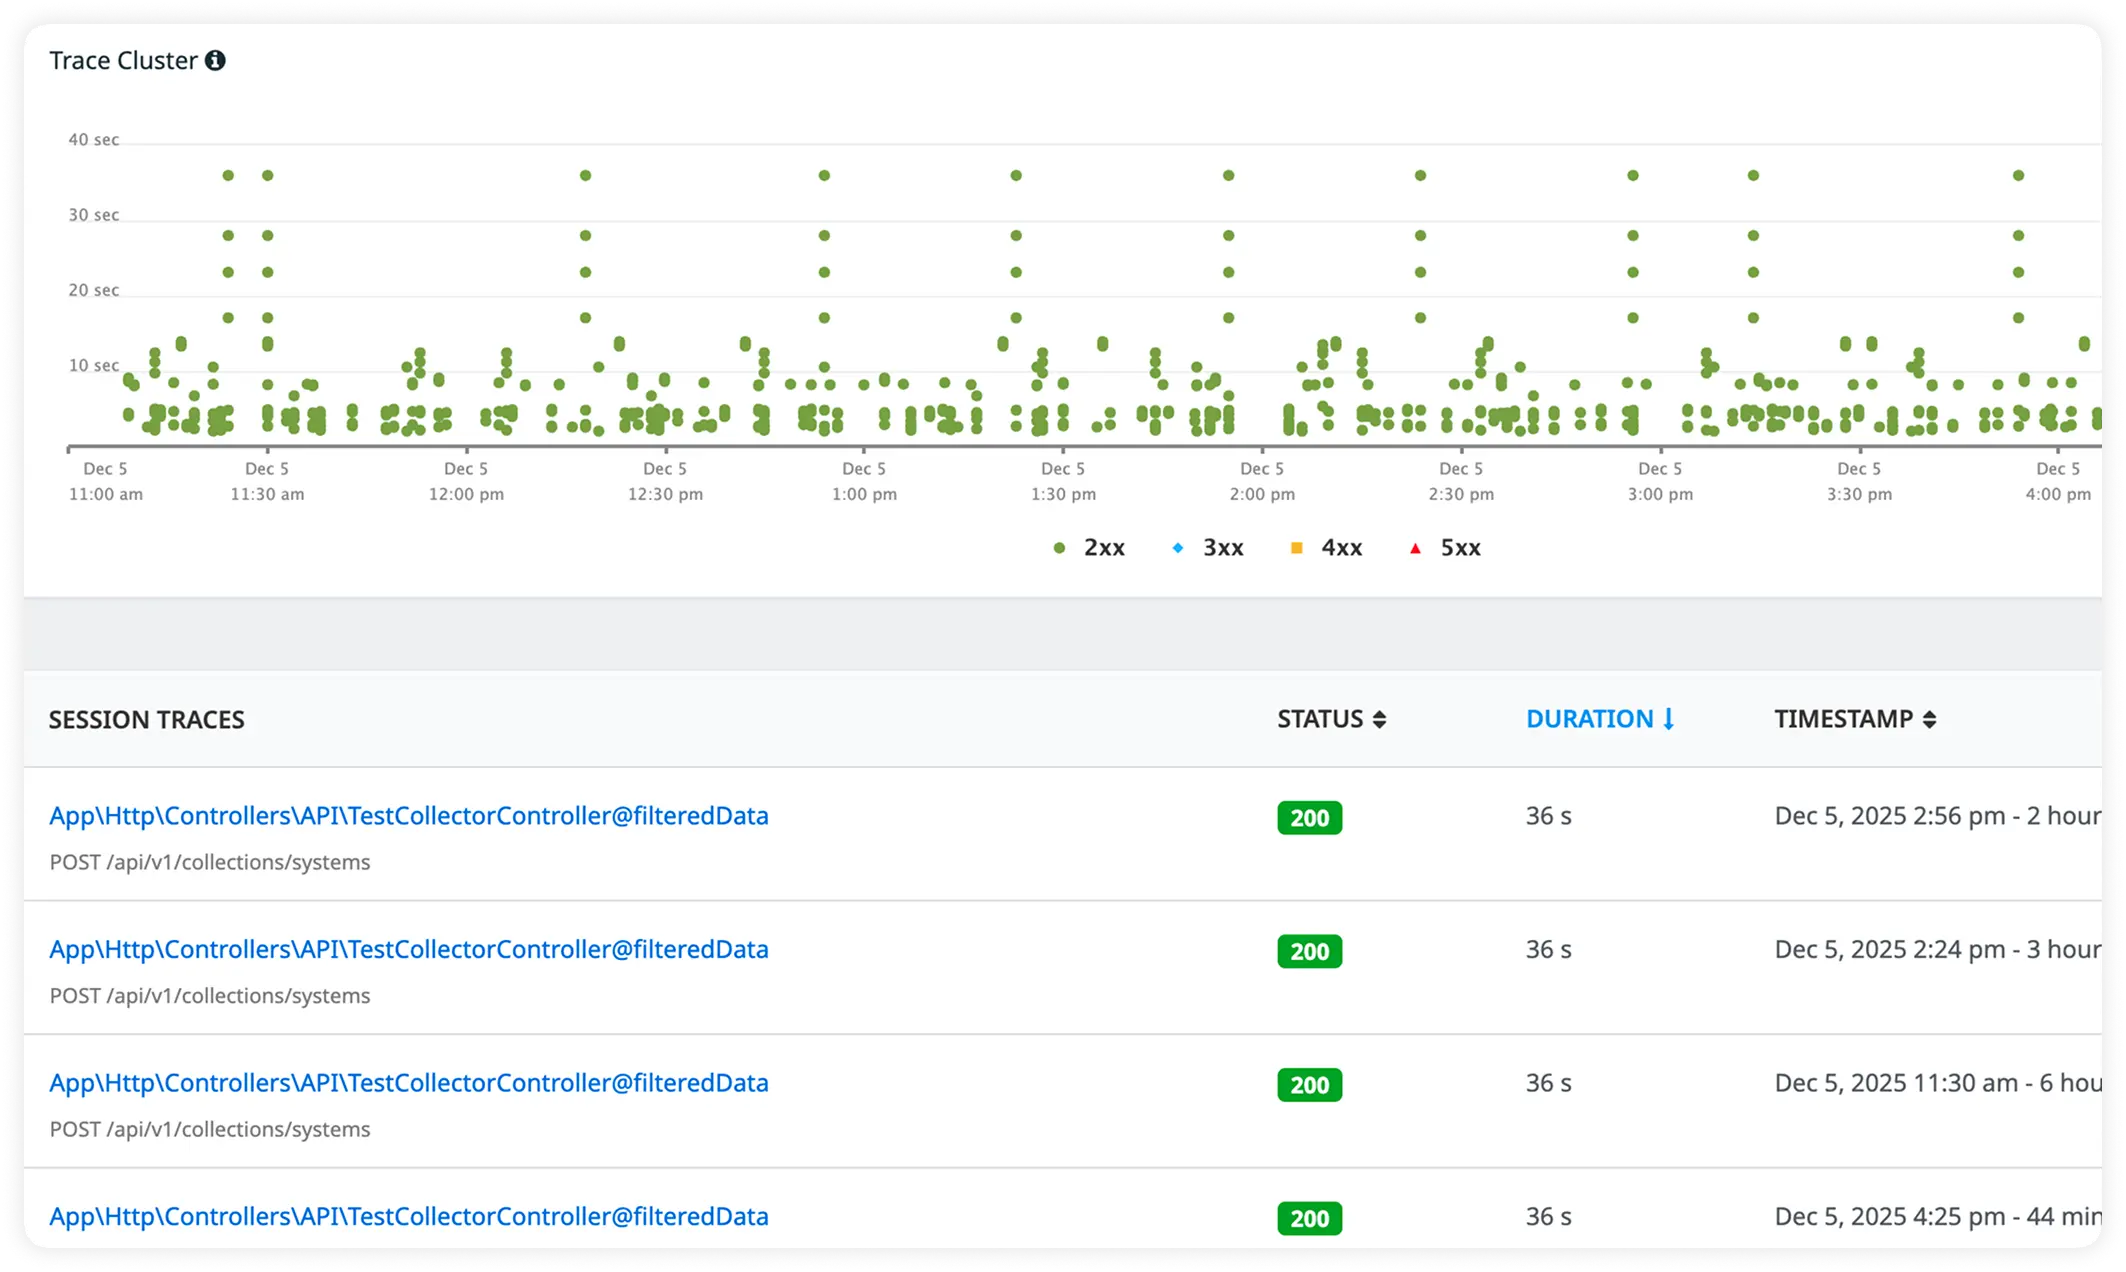
Track External Service Calls
Detect API latency and failures that impact background task performance in real time.
Why Celery teams standardize on Atatus
As background processing becomes central to business workflows, understanding distributed task execution under real load is critical. Teams standardize on Atatus to preserve execution clarity across workers, align engineers around the same runtime reality, and maintain confidence as task volume and system complexity grow.
Clear Task Execution
Engineers understand how tasks are scheduled, executed, and completed without manually tracing distributed logs.
Fast Incident Alignment
Platform, SRE, and backend teams reach shared understanding quickly during background processing incidents.
Immediate Signal Confidence
Runtime data is trusted early, enabling decisive action when asynchronous failures impact core workflows.
Lower Debug Complexity
Engineers spend less time correlating workers and queues and more time validating task-level failures.
Predictable Incident Handling
Incident response follows consistent analytical patterns despite distributed execution complexity.
Shared Operational Reality
Teams reference the same execution evidence during task failures and post-incident reviews.
Stable Under Load
Production understanding remains intact as task volume and concurrency increase.
Reduced On-Call Fatigue
Clear async visibility shortens incident duration and limits escalation during high-volume failures.
Long-Term Workflow Confidence
Teams continue scaling background workloads without fear of unseen execution breakdowns.
Unified Observability for Every Engineering Team
Atatus adapts to how engineering teams work across development, operations, and reliability.
Developers
Trace requests, debug errors, and identify performance issues at the code level with clear context.
DevOps
Track deployments, monitor infrastructure impact, and understand how releases affect application stability.
Release Engineer
Measure service health, latency, and error rates to maintain reliability and reduce production risk.