Gin Performance Monitoring
Get end-to-end visibility into your Gin performance with application monitoring tools. Gain insightful metrics on performance bottlenecks with Go monitoring to optimize your application.
What caused gin production visibility to break first?
Fragmented Request Context
Distributed Gin handlers lose request continuity across layers. Engineers debug symptoms without full execution context.
Blind Dependency Failures
External calls degrade silently. Teams see errors downstream but miss the triggering dependency behavior.
Database Latency Guesswork
Slow queries surface intermittently. Correlating database latency to specific request paths becomes manual and unreliable.
Environment Drift Confusion
Production behavior diverges from staging. Teams cannot trust pre-release signals once traffic patterns change.
Route Explosion Noise
Dynamic routing increases surface area. Identifying which routes actually matter under load becomes unclear.
Error Attribution Delays
Stack traces lack execution clarity. Engineers spend hours mapping failures to actual runtime conditions.
Scaling Blind Spots
Throughput increases mask saturation points. Systems fail gradually with no clear early indicators.
Debugging Without Confidence
Observations lack validation. Teams second-guess conclusions due to partial or delayed signals.
High-Performance Observability for
Gin Applications
Real-time observability for Gin workloads that helps teams analyze request flow, optimize execution speed, and maintain reliable production performance.
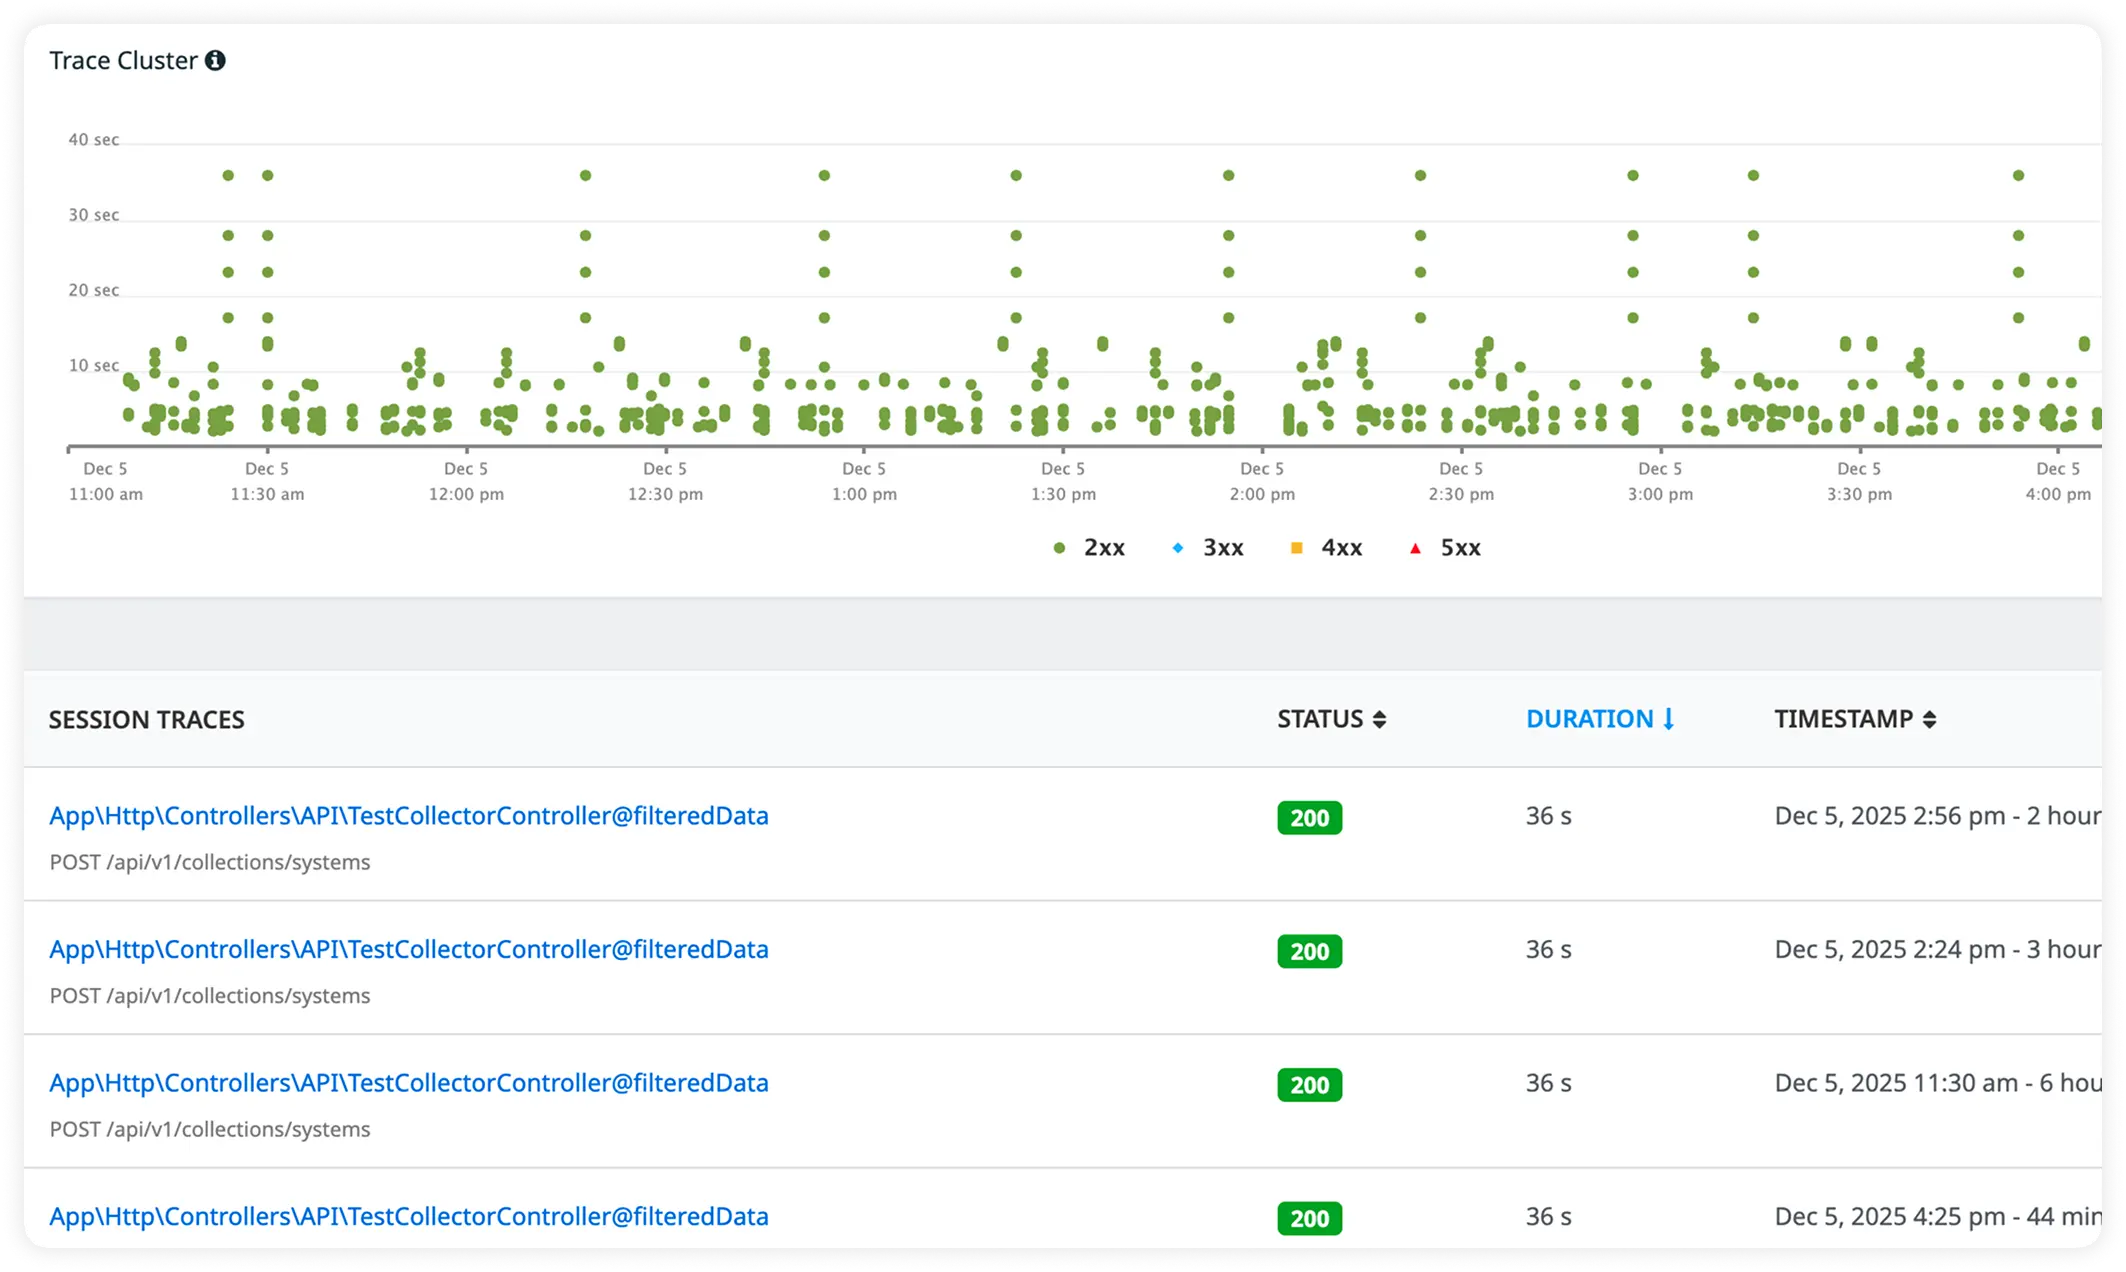
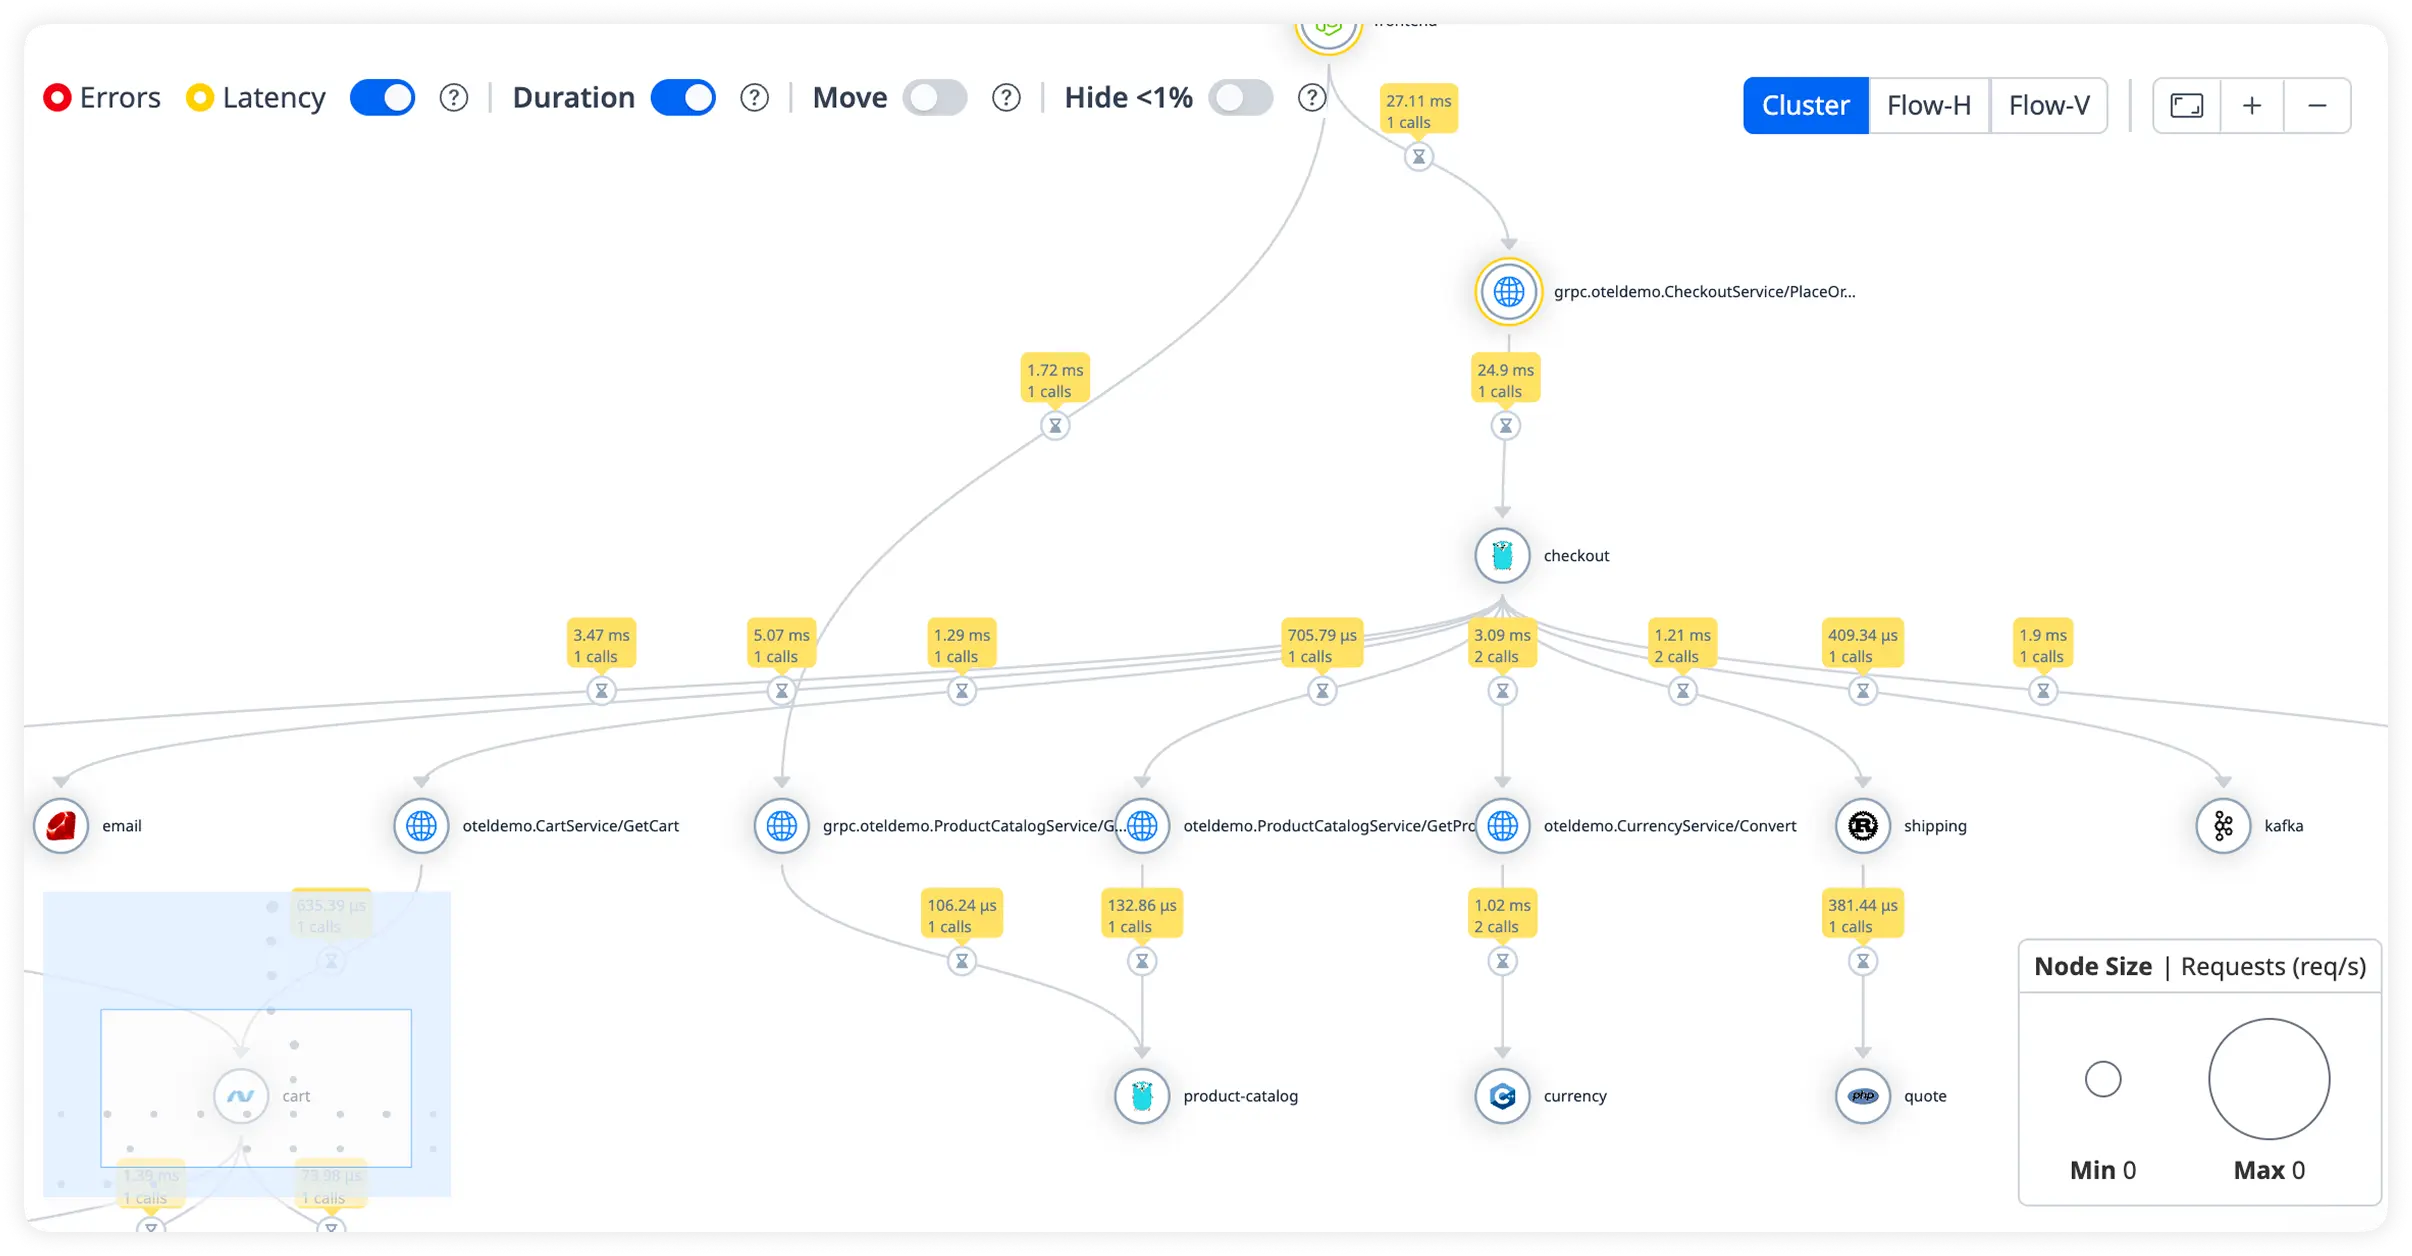
Detailed Request Duration Breakdown
Track how long each request takes from entry to response. Quickly uncover slow execution paths affecting application responsiveness.
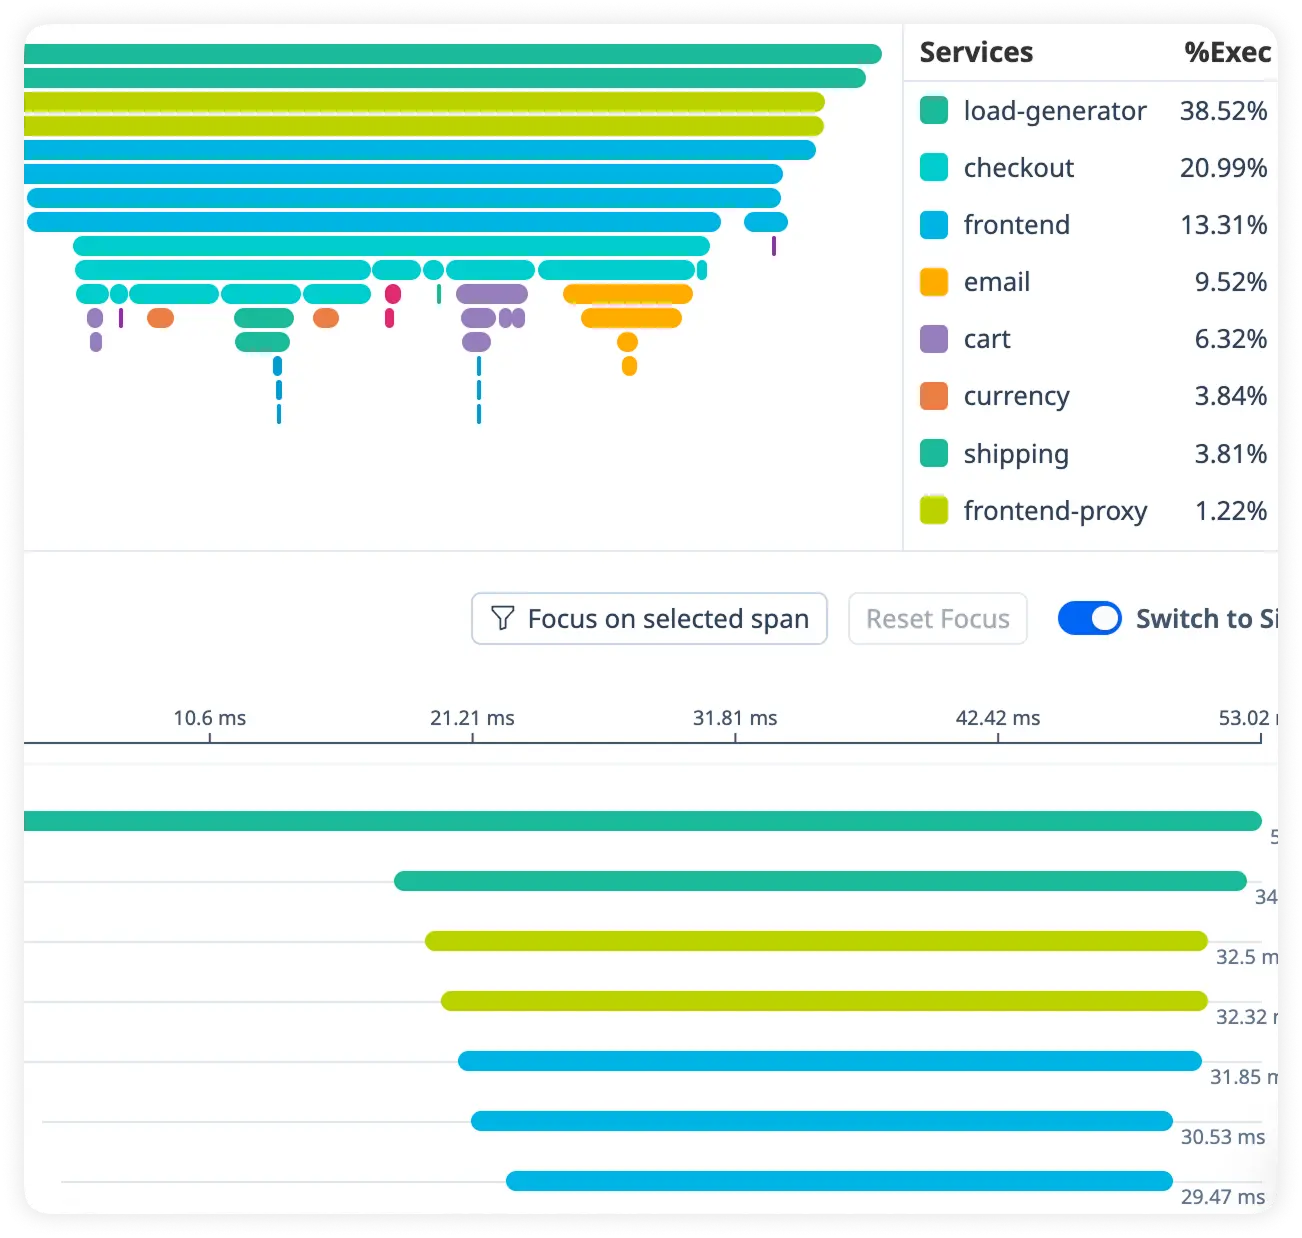
Handler Execution Timing
Measure how individual handlers and middleware contribute to overall request latency. Pinpoint slow processing steps across your Gin application.
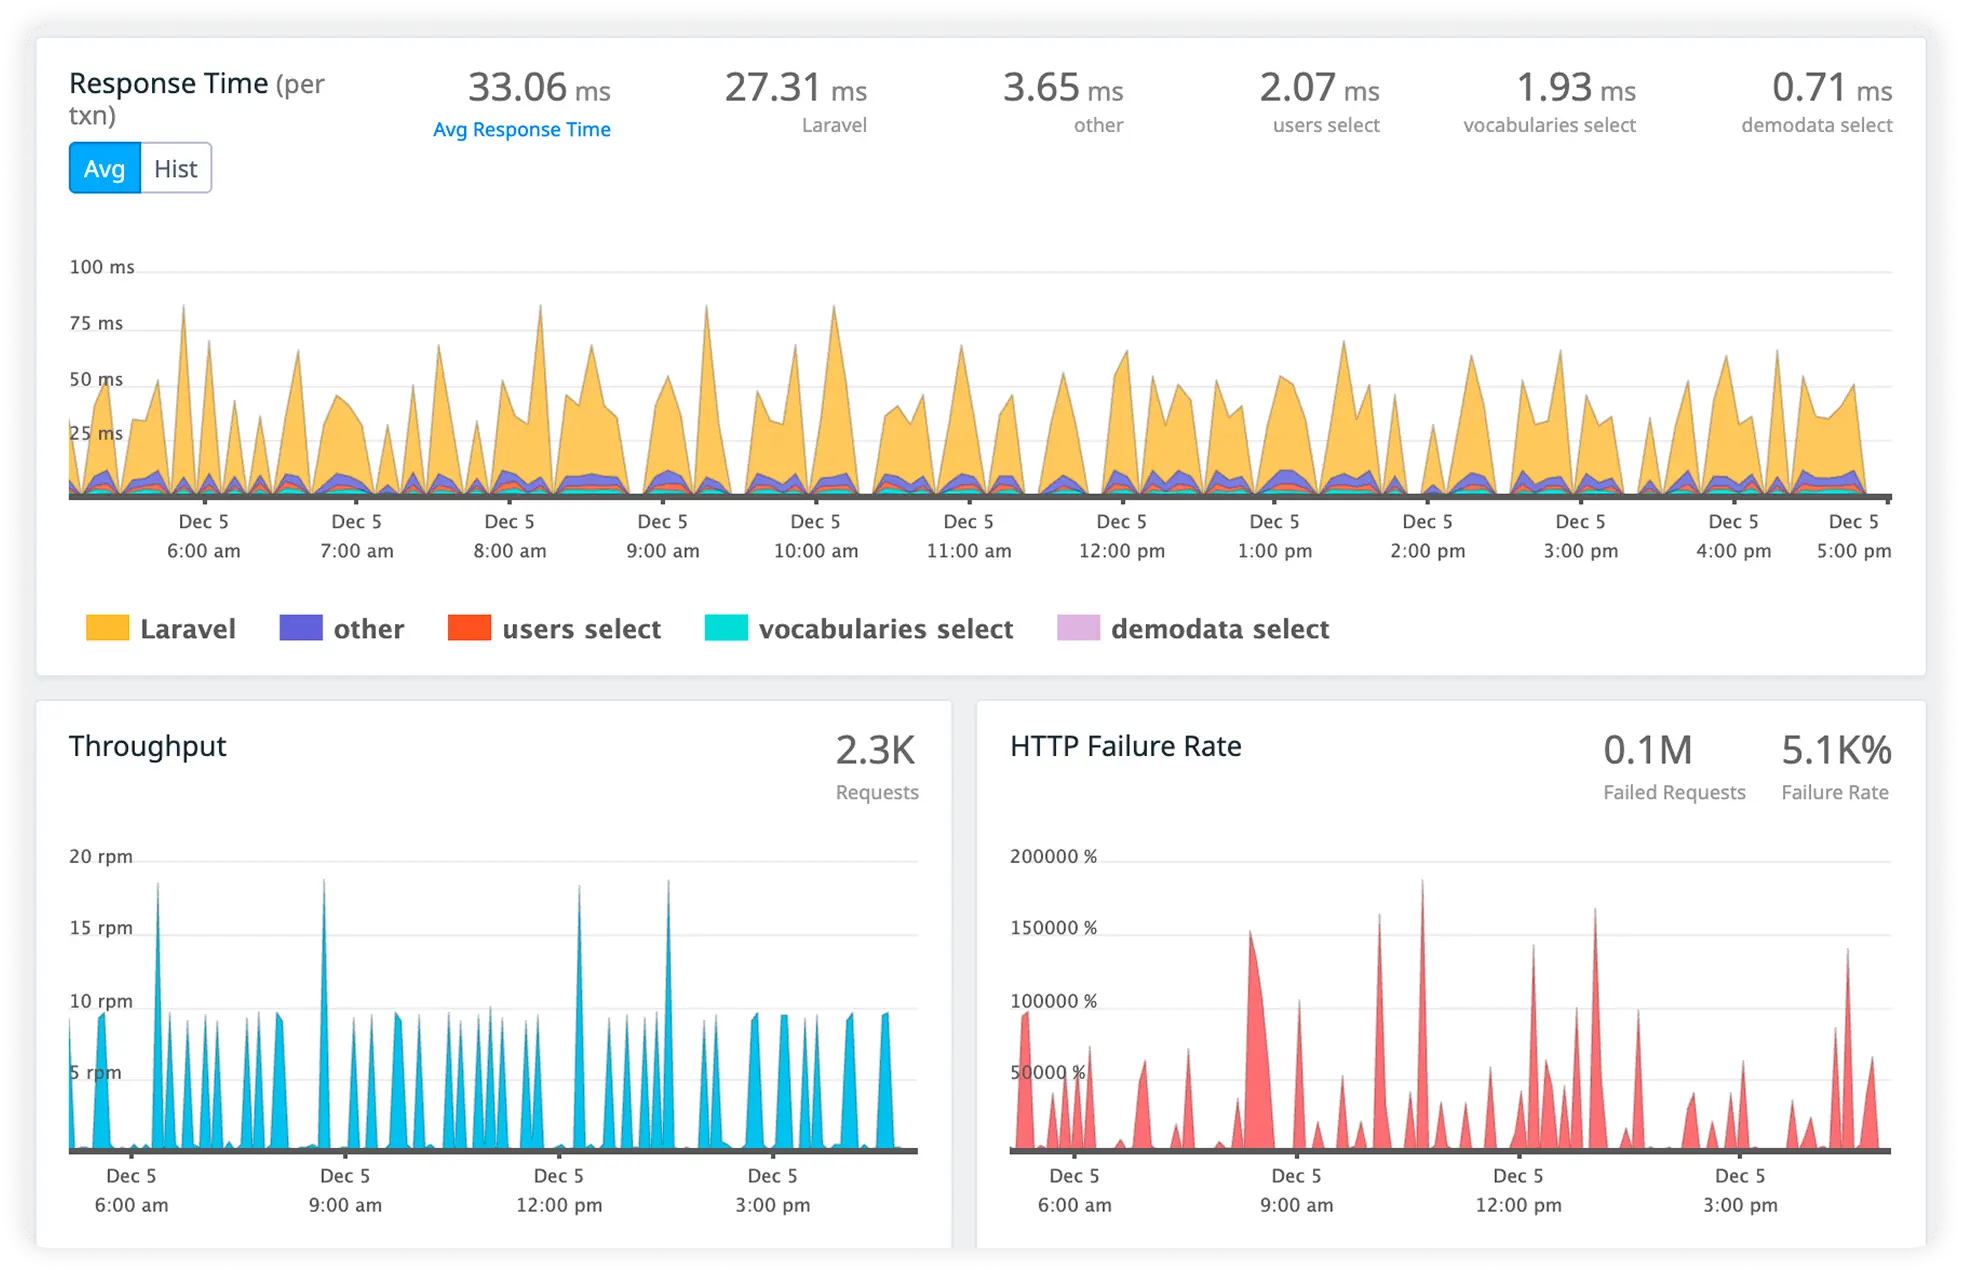
Actionable DB Query Insight
Monitor database query execution time and performance in real time. Eliminate inefficient queries slowing your application.
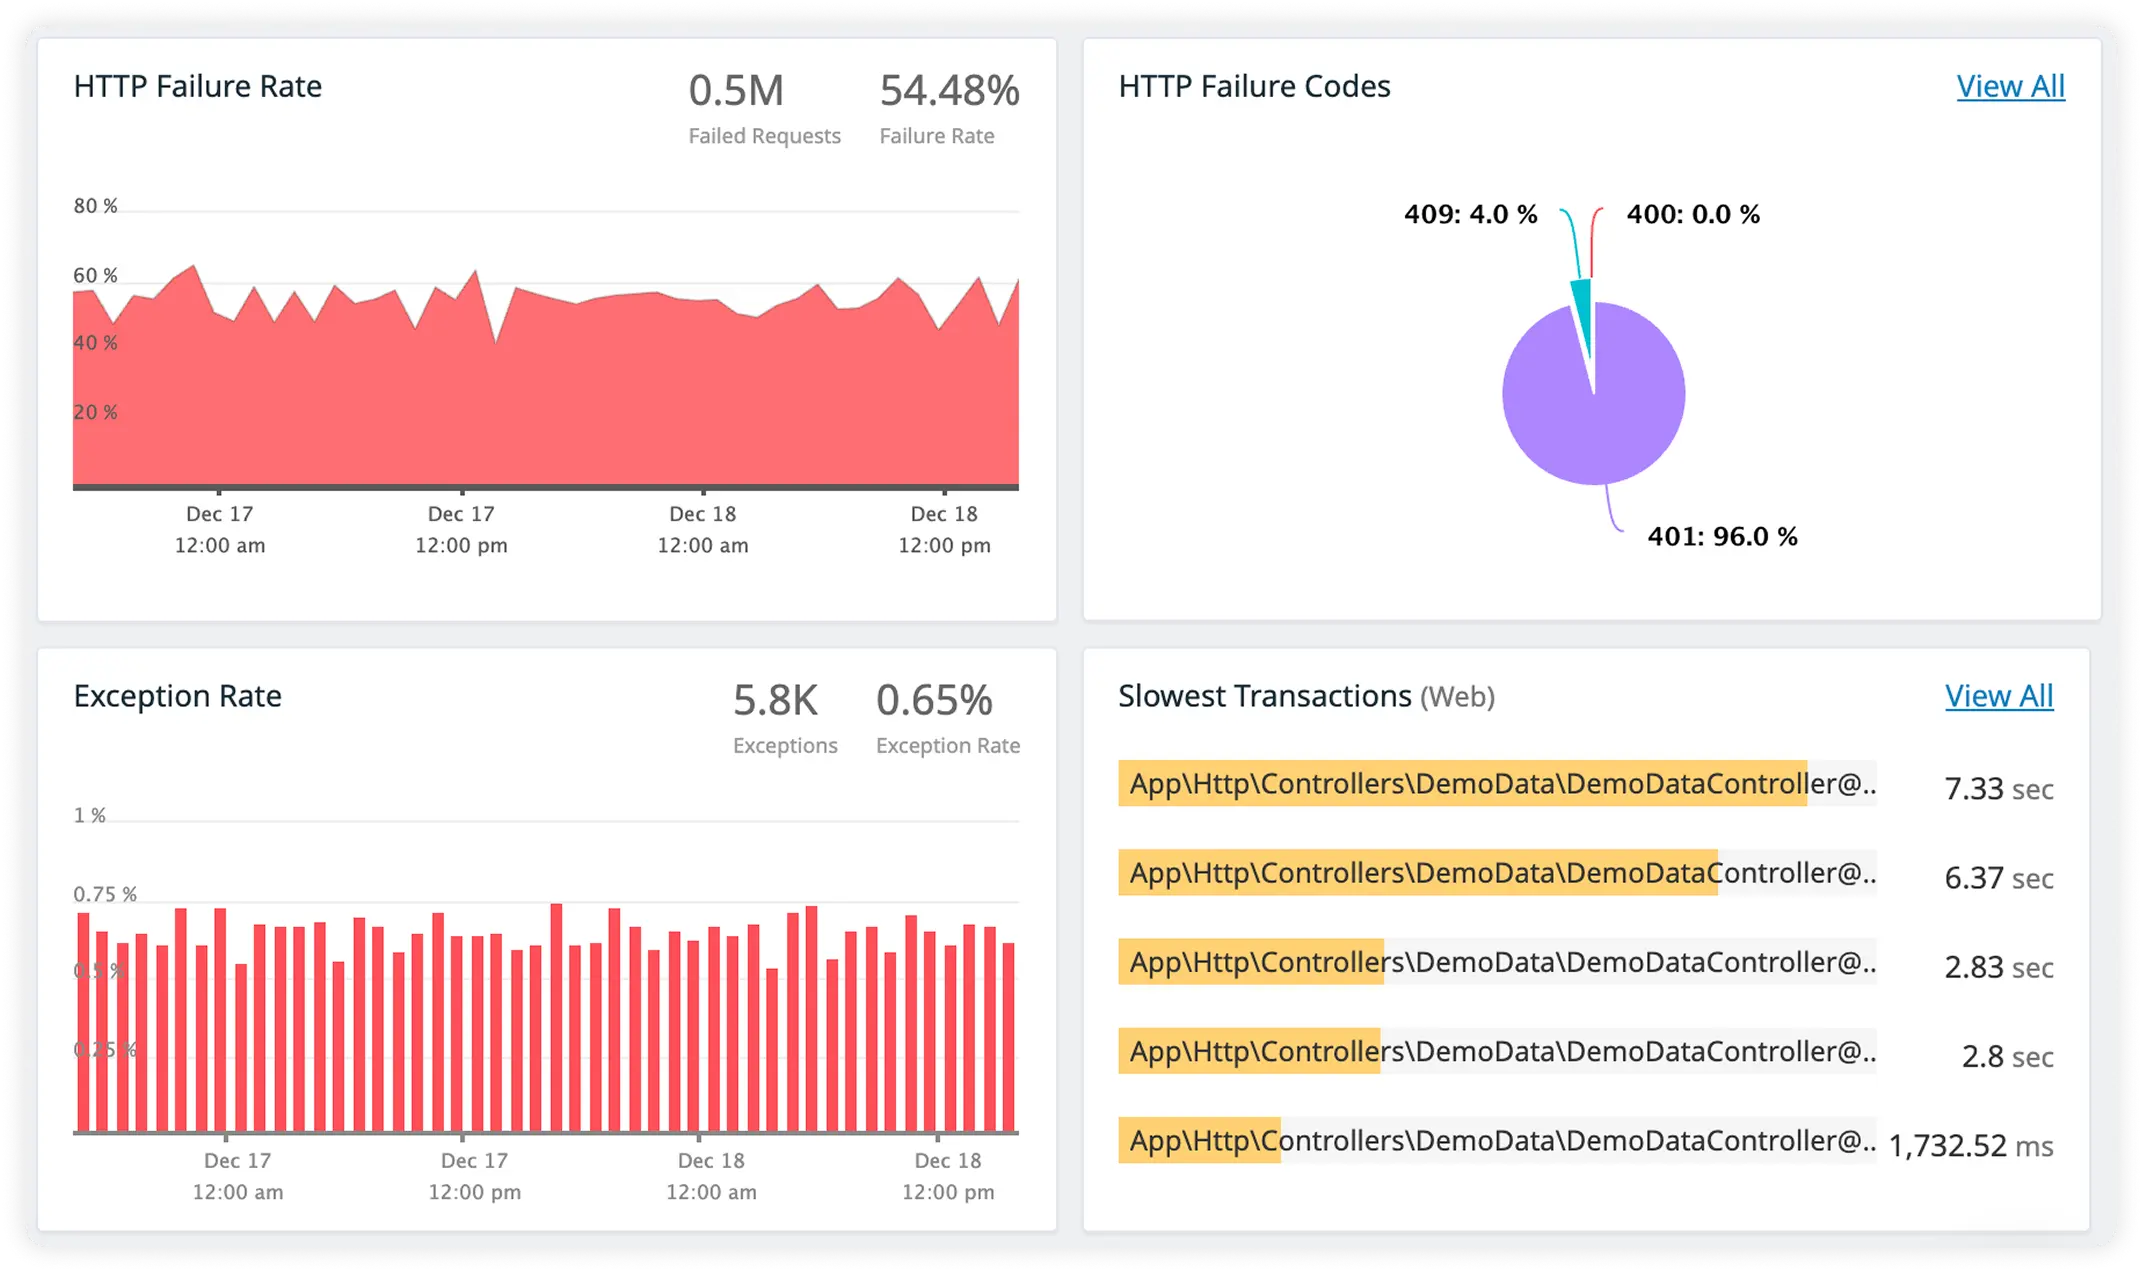
Cache Impact Visibility with External Call Timing
Measure cache performance alongside response times for third-party services. Understand how caching layers and external dependencies affect overall request speed.
Why Teams Choose Atatus?
When production complexity increases, teams converge on systems that reduce ambiguity, accelerate decisions, and hold up under pressure.
Deterministic Observability
Telemetry reflects actual execution paths, not inferred behavior or delayed aggregates.
Faster Engineering Buy-In
Engineers trust what they see early, reducing resistance to instrumentation changes.
Shared Operational Language
Platform, backend, and SRE teams reason about incidents using the same runtime evidence.
Lower Cognitive Load
Engineers spend less time interpreting data and more time acting on it.
Incident Readiness
Production signals remain reliable during traffic spikes and failure conditions.
Predictable Debug Workflows
Engineers move from signal to cause using repeatable analysis paths, reducing variance in how incidents are debugged across teams and shifts.
Reduced Escalation Cycles
Issues are identified and validated at the first touchpoint, preventing unnecessary escalations between backend, platform, and SRE teams.
Stable At Scale
Telemetry quality does not degrade under higher load, allowing teams to reason confidently about system behavior even during peak usage.
Long-Term Confidence
As architectures, traffic patterns, and ownership change, teams retain continuity in how production systems are understood and operated.
Unified Observability for Every Engineering Team
Atatus adapts to how engineering teams work across development, operations, and reliability.
Developers
Trace requests, debug errors, and identify performance issues at the code level with clear context.
DevOps
Track deployments, monitor infrastructure impact, and understand how releases affect application stability.
Release Engineer
Measure service health, latency, and error rates to maintain reliability and reduce production risk.