Laravel Octane Monitoring
Monitor your Laravel application served by Octane to gain real-time insights into its performance and behavior, allowing you to actively observe the application's behavior and performance on the Octane server.
How Octane Failures Hide in Production?
Cold State Assumptions
Long-lived workers break assumptions built around request isolation. State leaks survive between requests, making production behavior diverge from staging in ways logs rarely explain.
Hidden Worker Saturation
Under sustained load, workers appear healthy while queues silently back up. Teams see latency rise without clear signals pointing to worker exhaustion or imbalance.
Async Execution Blindness
Concurrent tasks complete out of order. When something slows down, correlating async execution paths to a single request becomes guesswork.
Memory Drift Over Time
Memory usage grows gradually across worker lifecycles. The absence of per-worker visibility makes it hard to tell whether growth is expected or a leak.
Inconsistent Request Timing
The same endpoint behaves differently depending on worker age and load. Teams struggle to explain why identical requests show unpredictable latency.
Deployment State Residue
Code deploys do not fully reset runtime state. Subtle leftovers from previous versions surface as edge-case bugs hours later.
Scale Breaks Debugging
As traffic scales, traditional request-based inspection collapses. Signal-to-noise drops and meaningful patterns disappear in volume.
Incident Context Gaps
When incidents happen, engineers lack historical execution context. Postmortems rely on assumptions instead of concrete runtime evidence.
High-Performance Monitoring for
Laravel Octane Applications
Real-time observability built for long-running Laravel Octane workloads to help teams maintain speed, stability, and predictable performance under heavy traffic.
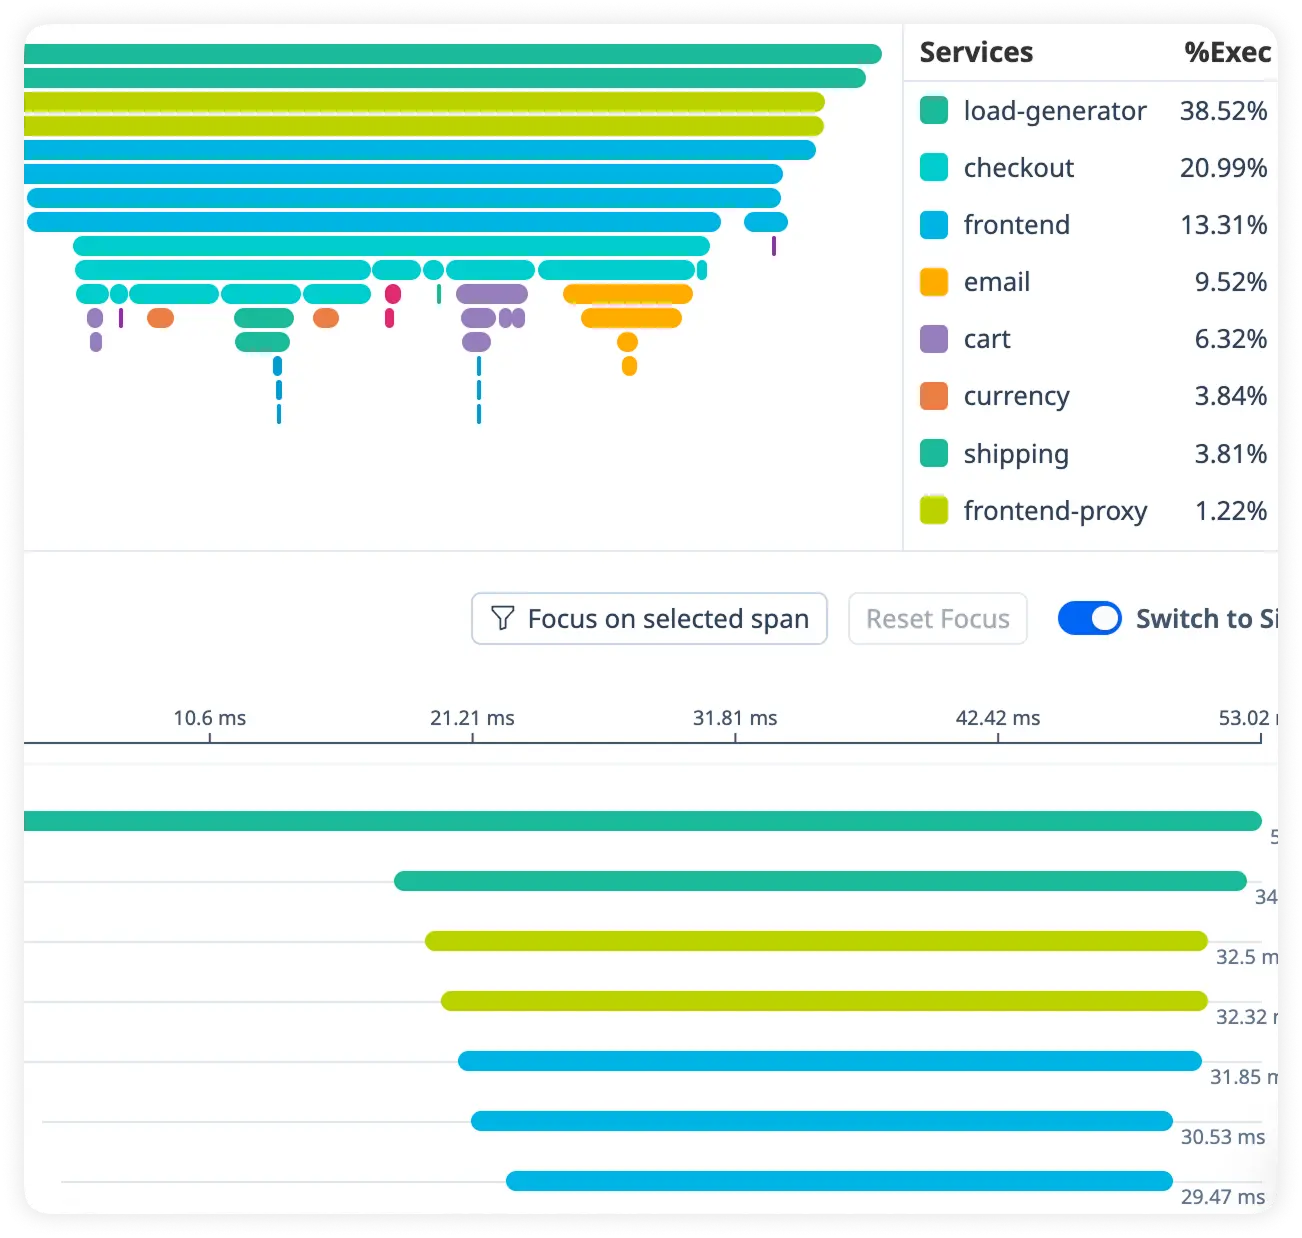
Break Down the Slowest Requests
Identify which requests consume the most processing time across your Octane-powered application. Quickly uncover performance hotspots affecting throughput and response speed.
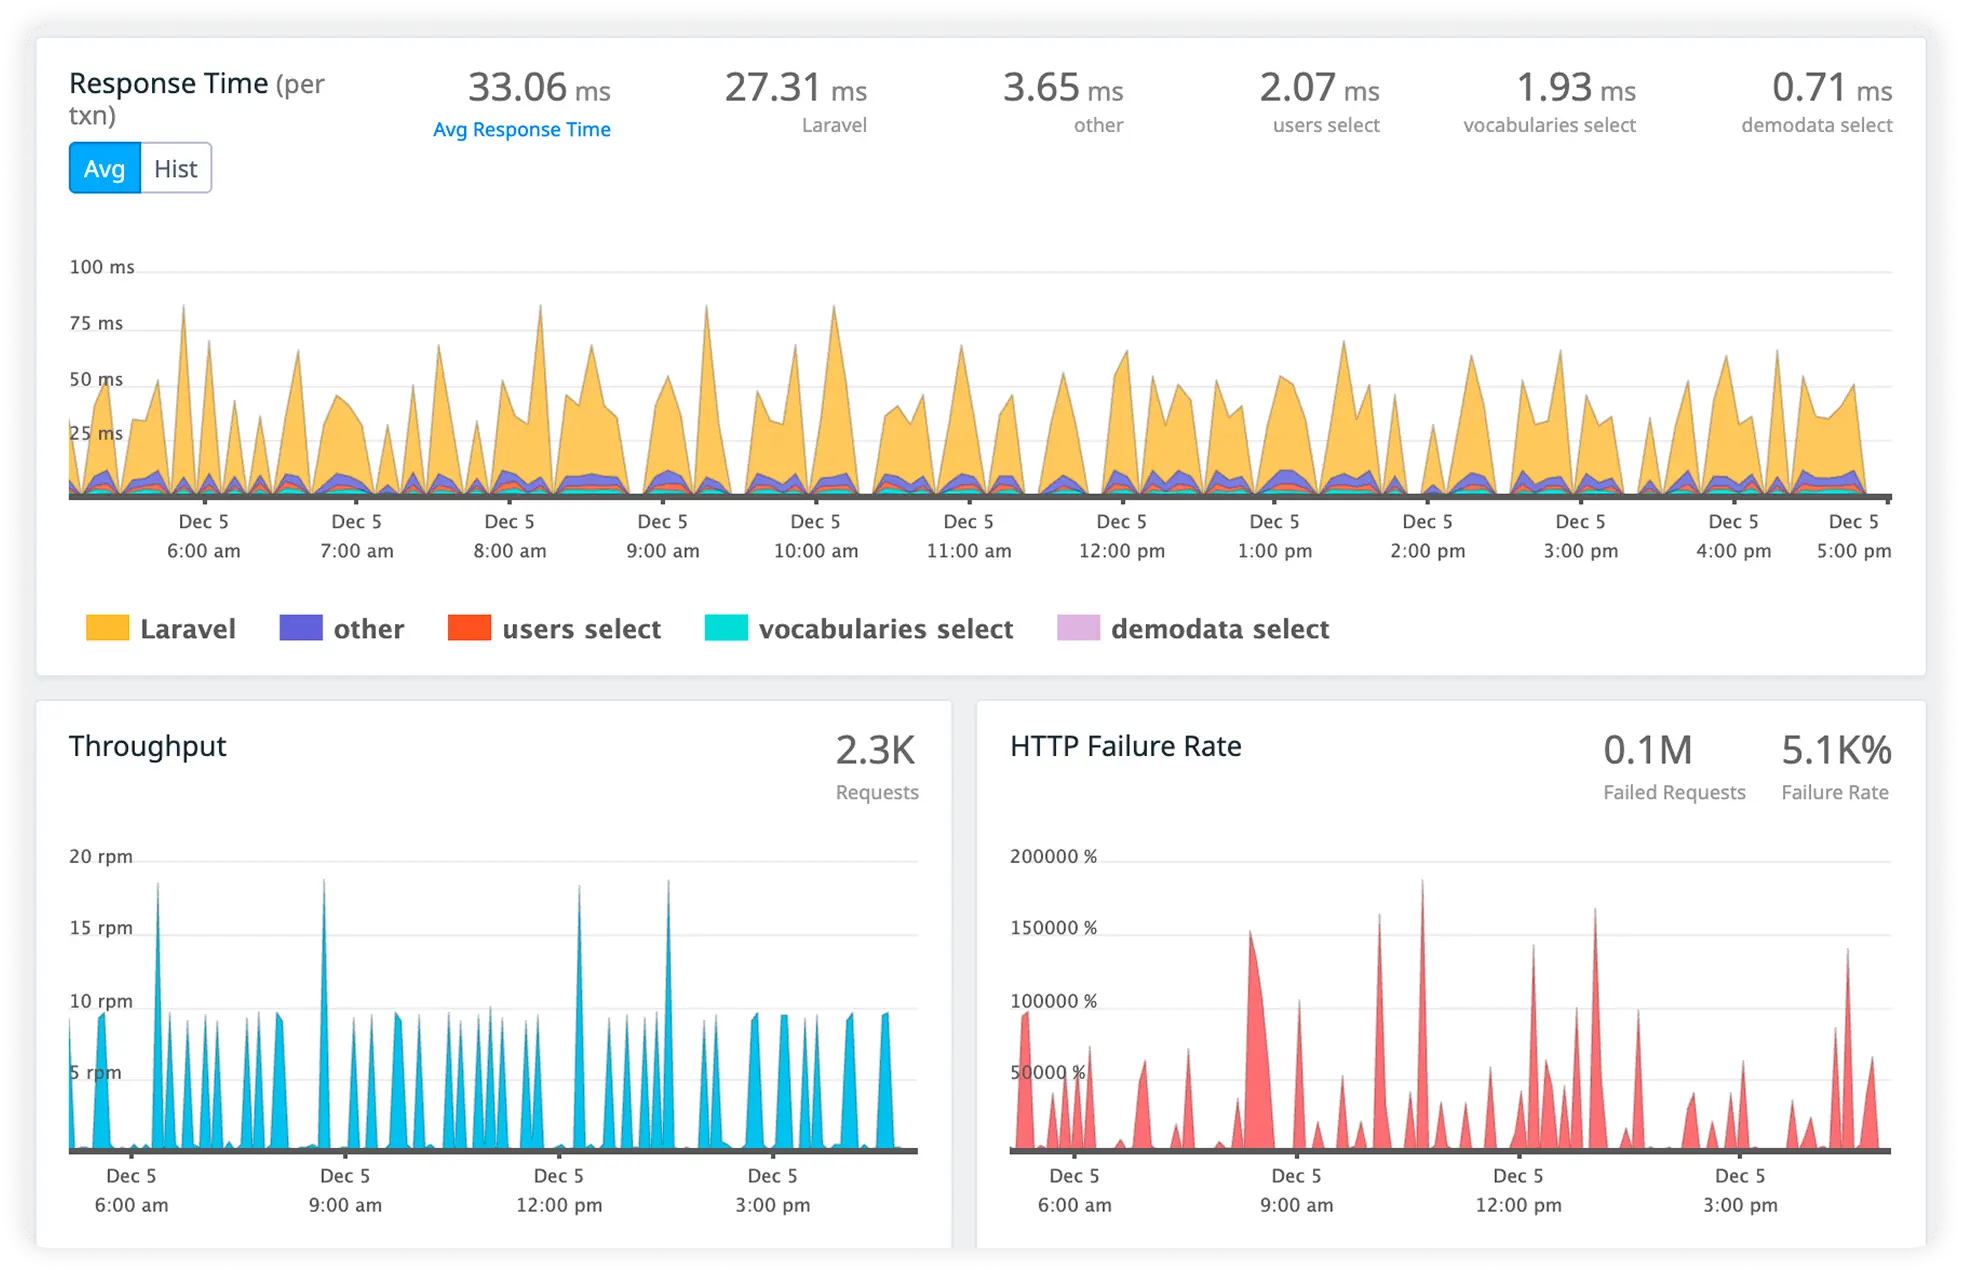
Deep Database Query Insight
Monitor slow queries, execution time, and database load in real time. Optimize data access patterns that impact high-performance workloads.
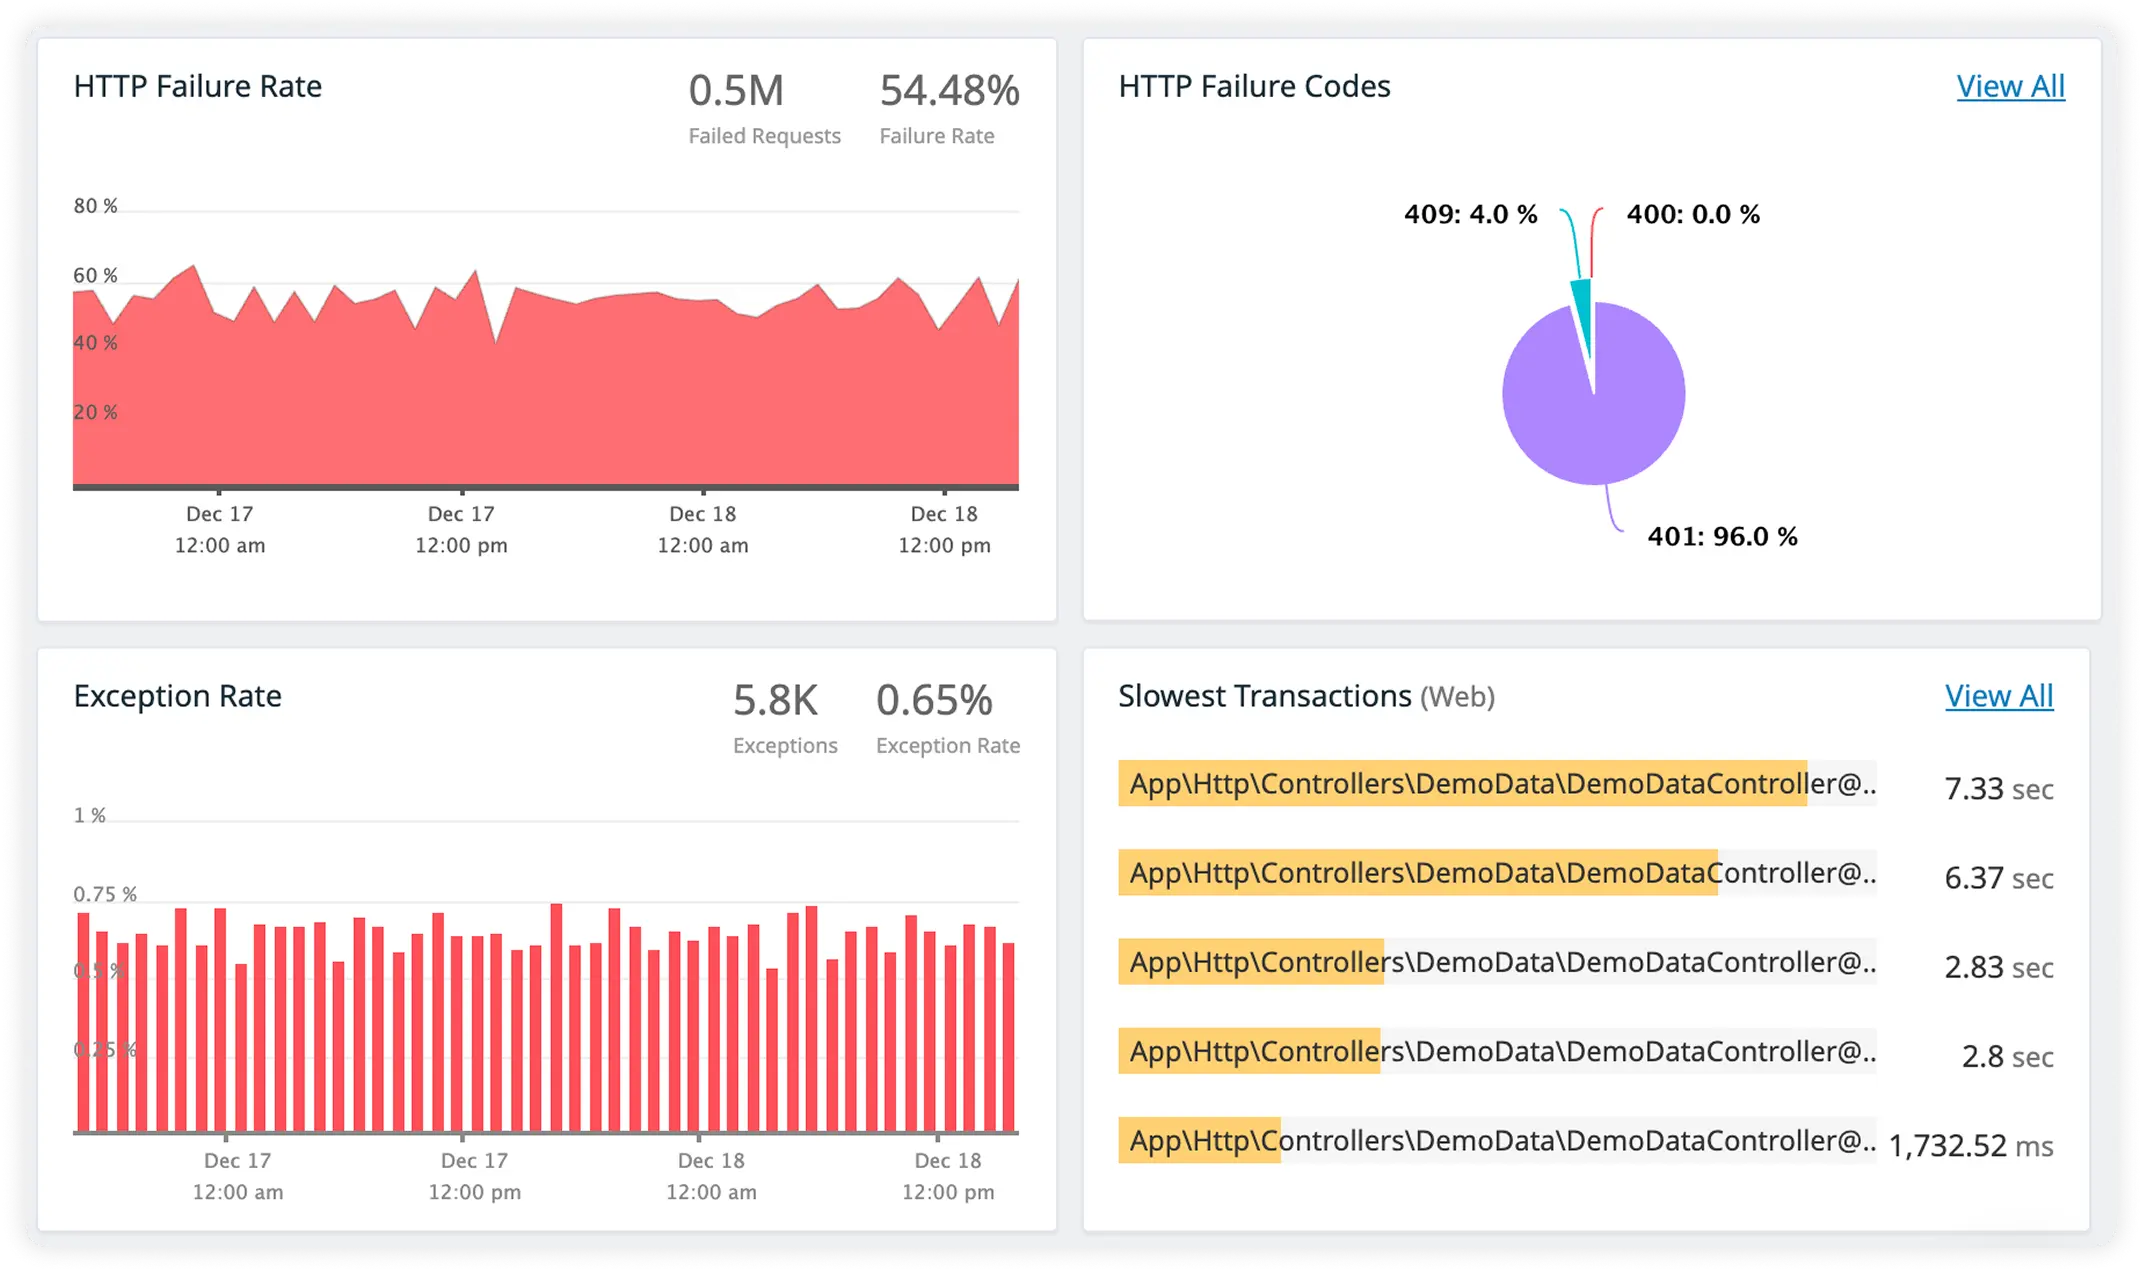
Remote Call Delay Visibility
Track response times for third-party APIs and external services. Detect remote latency issues before they degrade application performance.
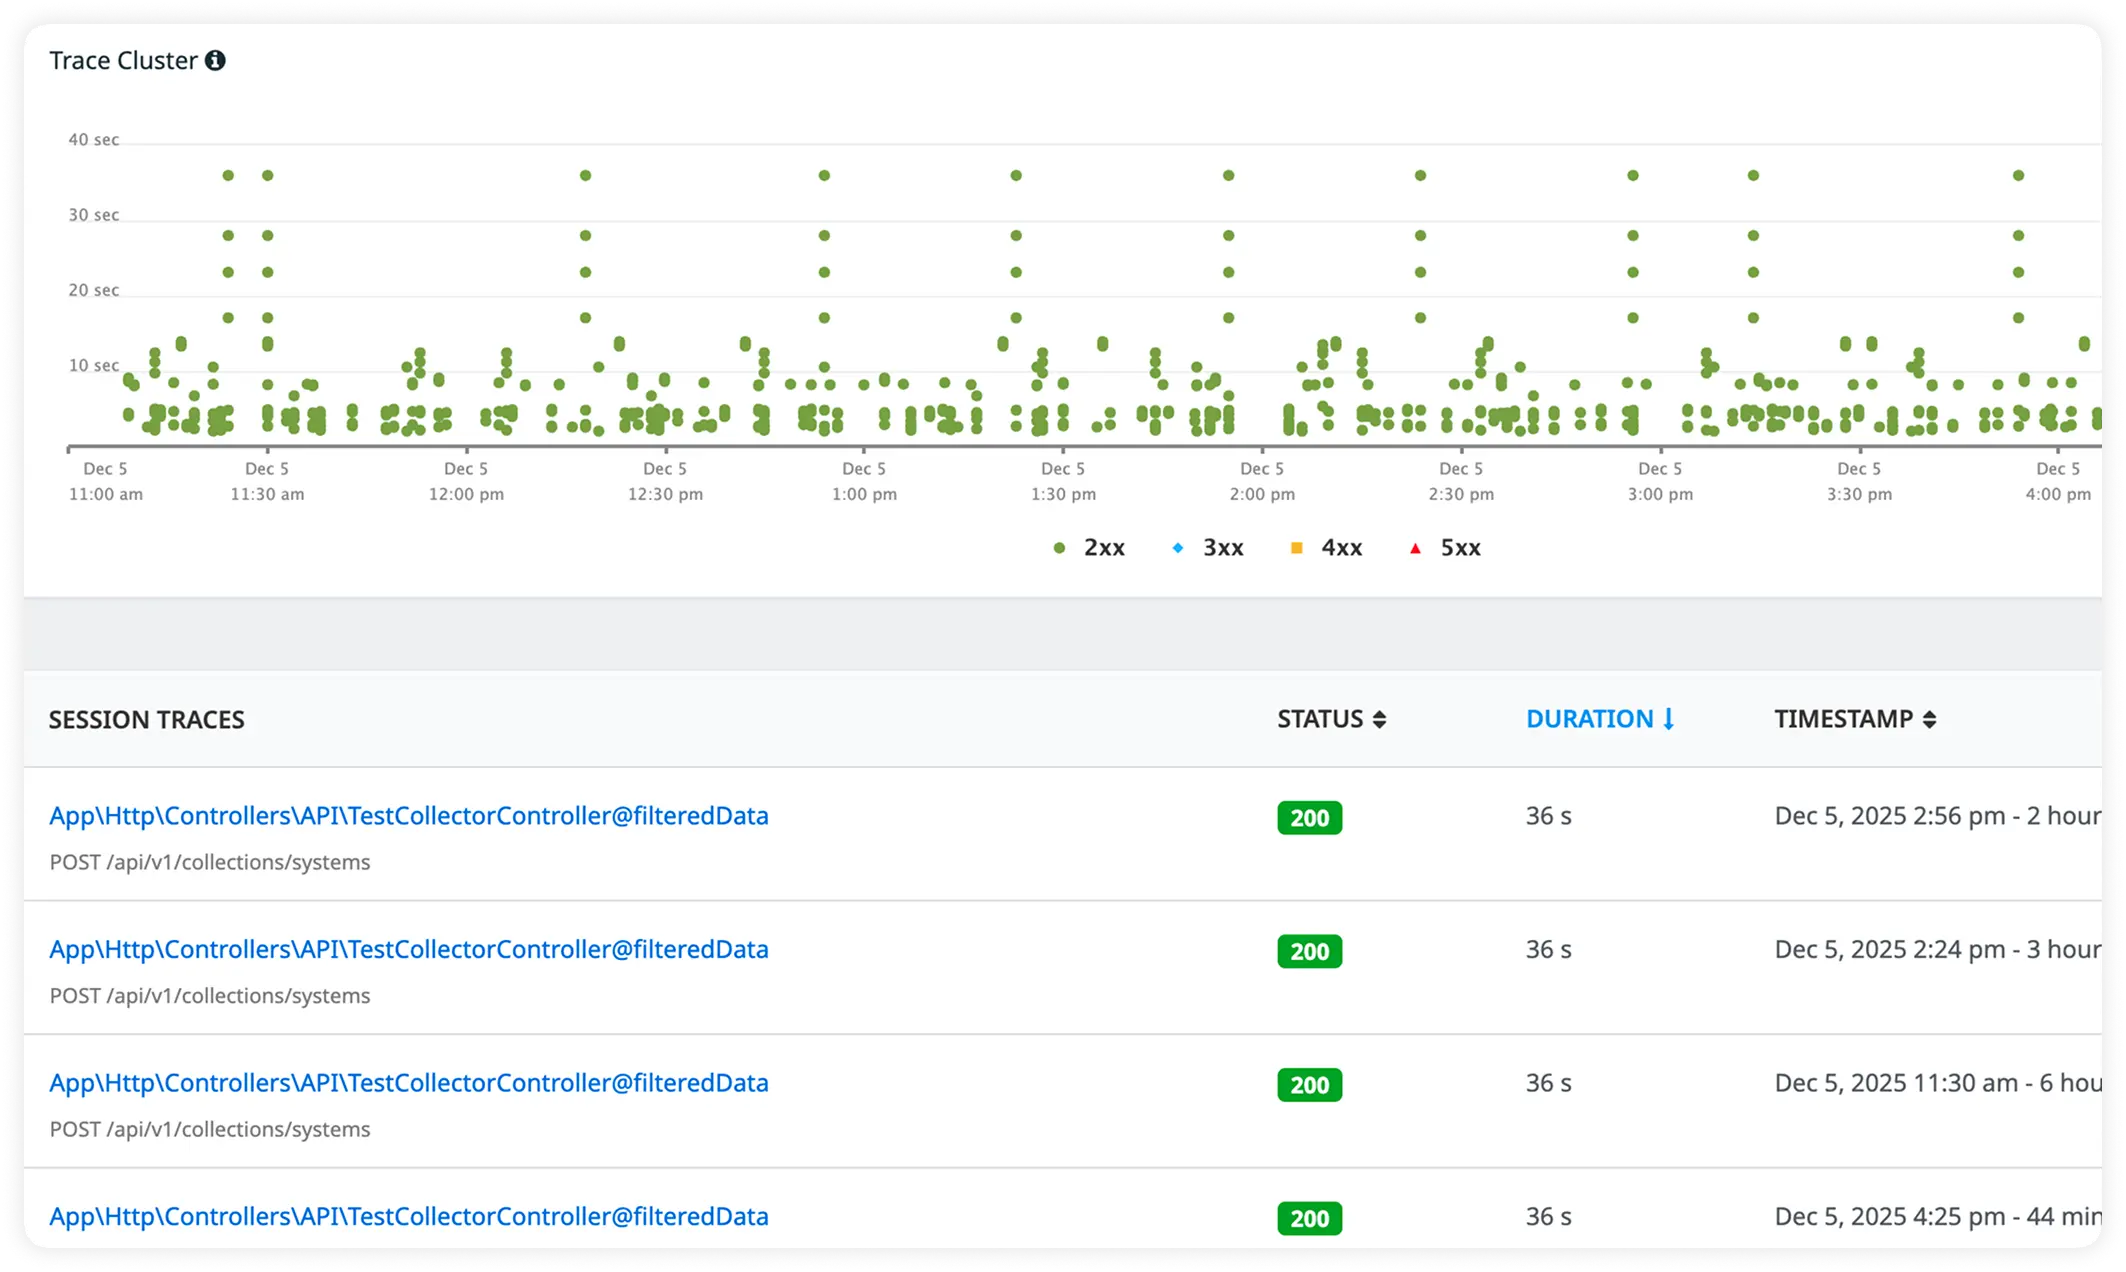
Full Error Traces in Real Time
Capture complete stack traces and rich contextual error data for every failure. Resolve production issues faster with precise root-cause visibility.
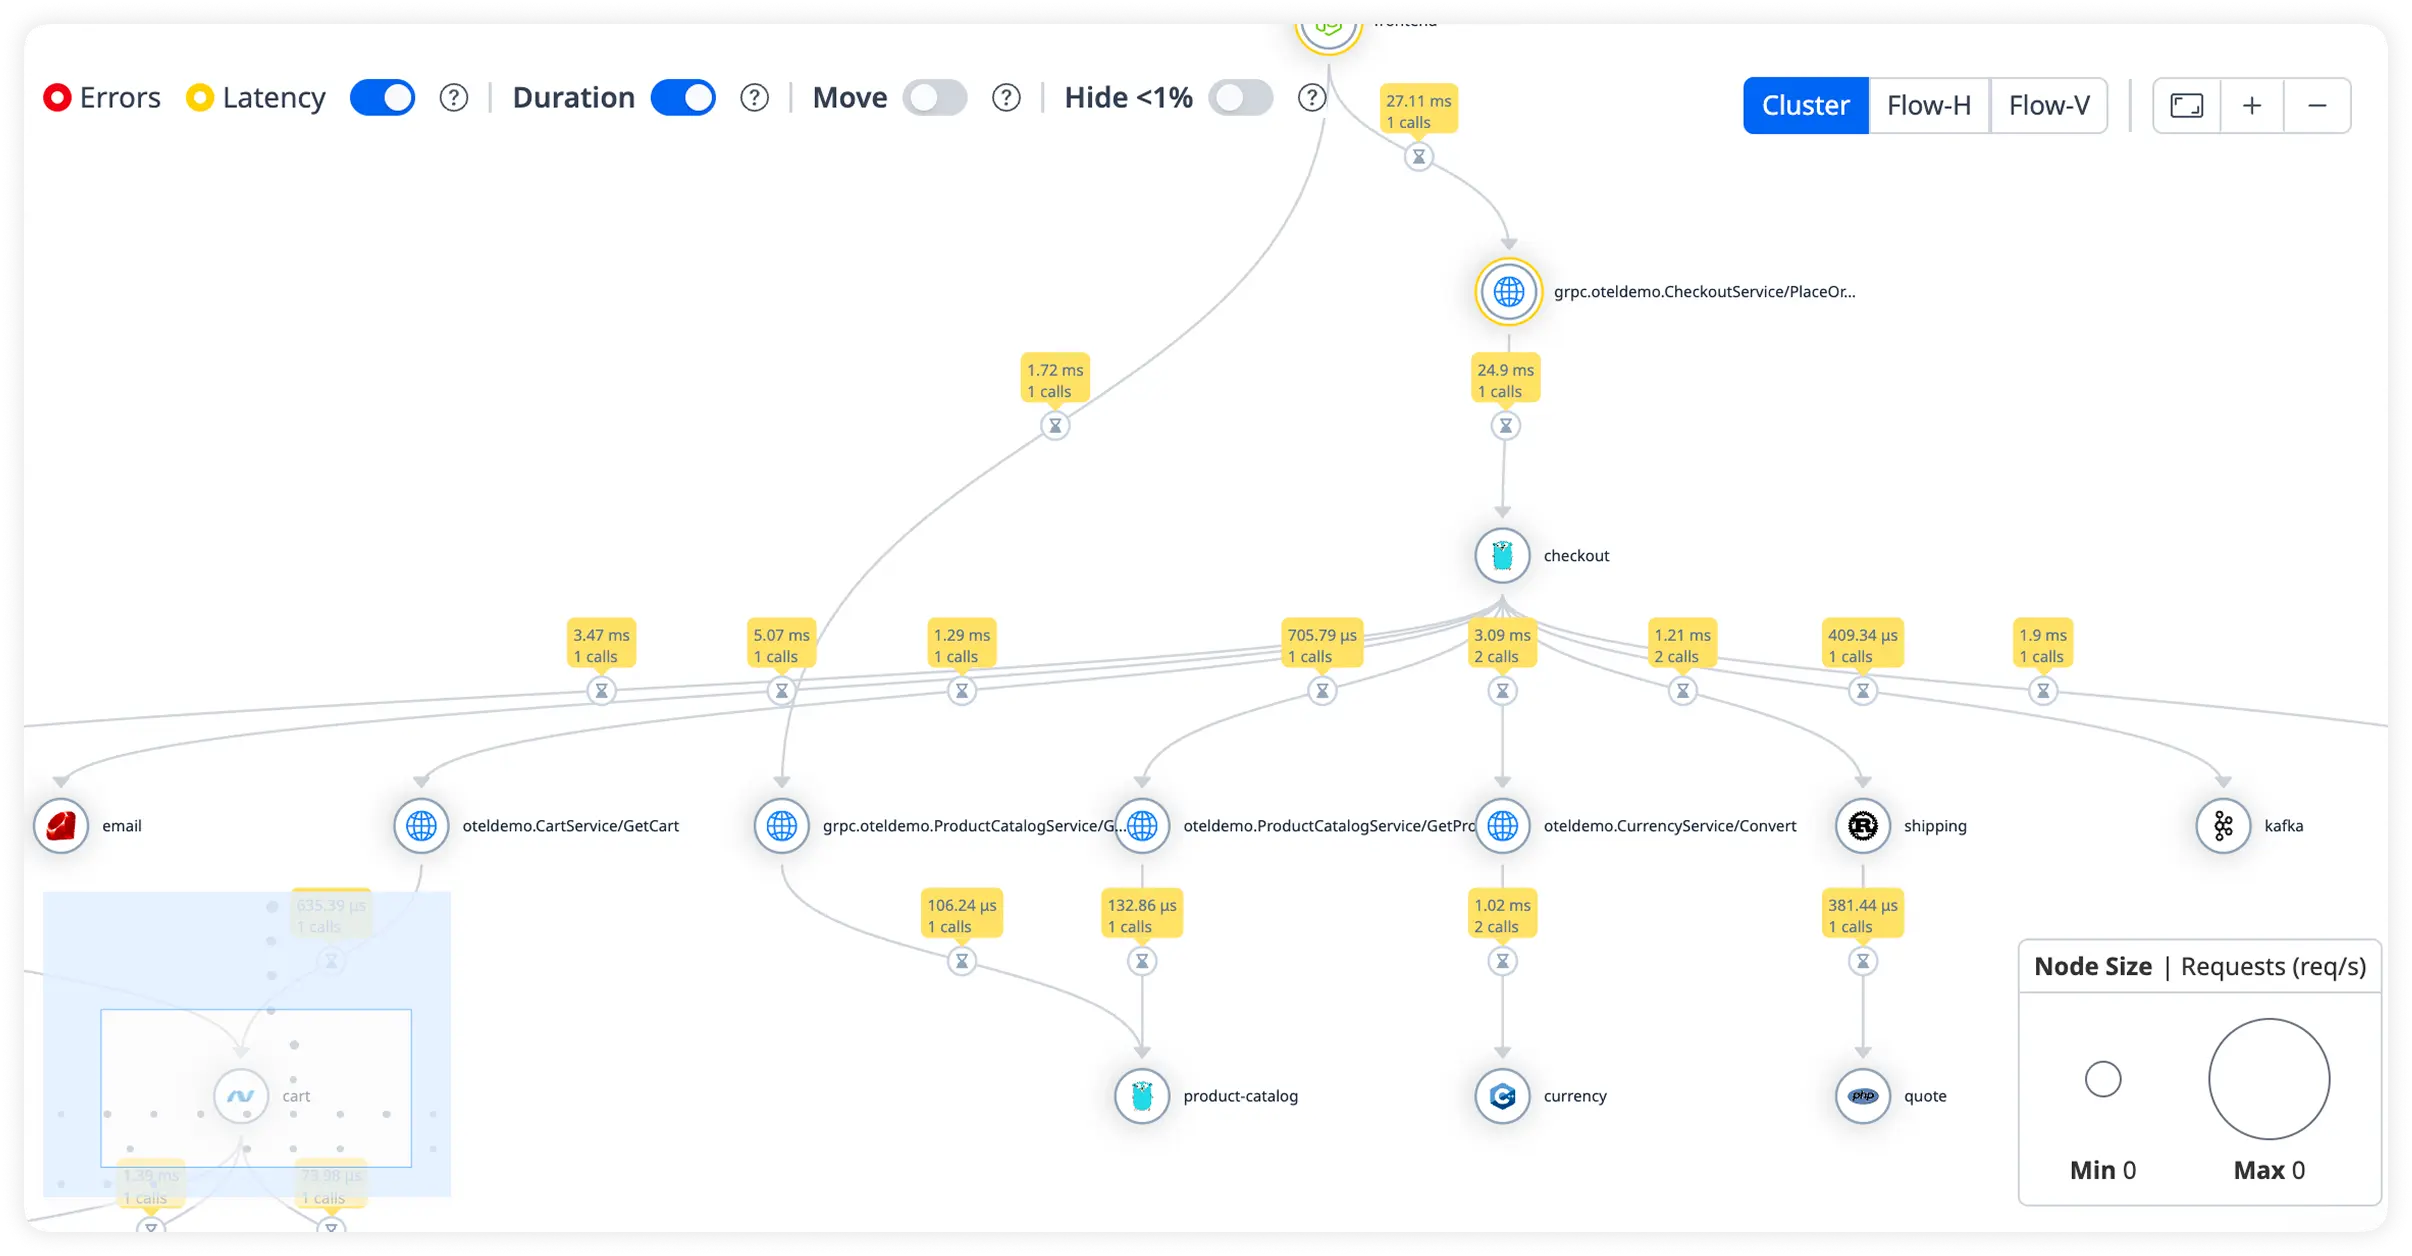
Why Teams Choose Atatus for laravel-octane Performance Optimization?
Teams running Laravel Octane work close to the runtime. Atatus mirrors real concurrent PHP behavior in production, giving engineers confidence when systems are under load.
Octane-Native Semantics
Designed around persistent workers, shared memory, and async execution. The data matches Octane’s runtime model instead of fighting it.
Deterministic Observability
Execution data stays consistent across load, deploys, and traffic spikes. Engineers see stable signals even when behavior is non-linear.
Low Cognitive Load
Telemetry is immediately readable by backend and SRE teams. No translation layer between what the runtime does and what engineers see.
Production-Safe Instrumentation
Built to run continuously in high-throughput environments. No sampling surprises or behavior changes under stress.
Incident-Ready Context
During failures, engineers get execution context that survives concurrency and async boundaries. Debugging stays grounded in facts.
Zero Workflow Disruption
Fits into existing deploy and run pipelines. Teams gain visibility without reshaping how services are built or shipped.
Runtime Truthfulness
Observations come from actual execution paths, not inferred aggregates. Engineers trust the data during critical decisions.
Scales With Concurrency
Signal quality improves as parallelism increases. Visibility does not degrade when worker counts or traffic grow.
Engineer-Controlled Insight
Backend and platform teams stay in control of interpretation. No opaque scoring or black-box abstractions.
Unified Observability for Every Engineering Team
Atatus adapts to how engineering teams work across development, operations, and reliability.
Developers
Trace requests, debug errors, and identify performance issues at the code level with clear context.
DevOps
Track deployments, monitor infrastructure impact, and understand how releases affect application stability.
Release Engineer
Measure service health, latency, and error rates to maintain reliability and reduce production risk.