NestJS Performance Monitoring
Get end-to-end visibility into your NestJS performance with application monitoring tools. Gain insightful metrics on performance bottlenecks with Node.js monitoring to optimize your application.
Where NestJS production clarity breaks
Execution Flow Ambiguity
Decorators, guards, pipes, and layered handlers obscure the actual execution path taken by a request in live production traffic.
Fragmented Runtime Context
Errors surface without sufficient execution state, forcing engineers to infer lifecycle stages, timing, and request conditions.
Slow Root Isolation
Requests traverse multiple abstraction layers before failing, increasing the time required to locate the originating fault.
Hidden Dependency Delays
Internal services and external APIs introduce latency that remains undetected until user-facing impact becomes visible.
Async Boundary Gaps
Promises, event loops, and background tasks break execution continuity, making failure timelines difficult to reconstruct.
Noisy Failure Signals
Alerts trigger on symptoms rather than execution causes, extending investigation cycles during incidents.
Unclear Scaling Effects
Increased concurrency alters runtime behavior in subtle ways teams cannot clearly observe or reason about.
Eroding Production Trust
Repeated blind debugging reduces confidence in production data, slowing decision-making under pressure.
Complete Performance Visibility for
NestJS Applications
Real-time observability for NestJS workloads that helps teams trace request performance, optimize controller execution, and resolve production issues faster.
Trace-Level Visibility Across NestJS Services
Follow requests across controllers, services, databases, and APIs with complete execution insight for faster debugging and performance optimization.
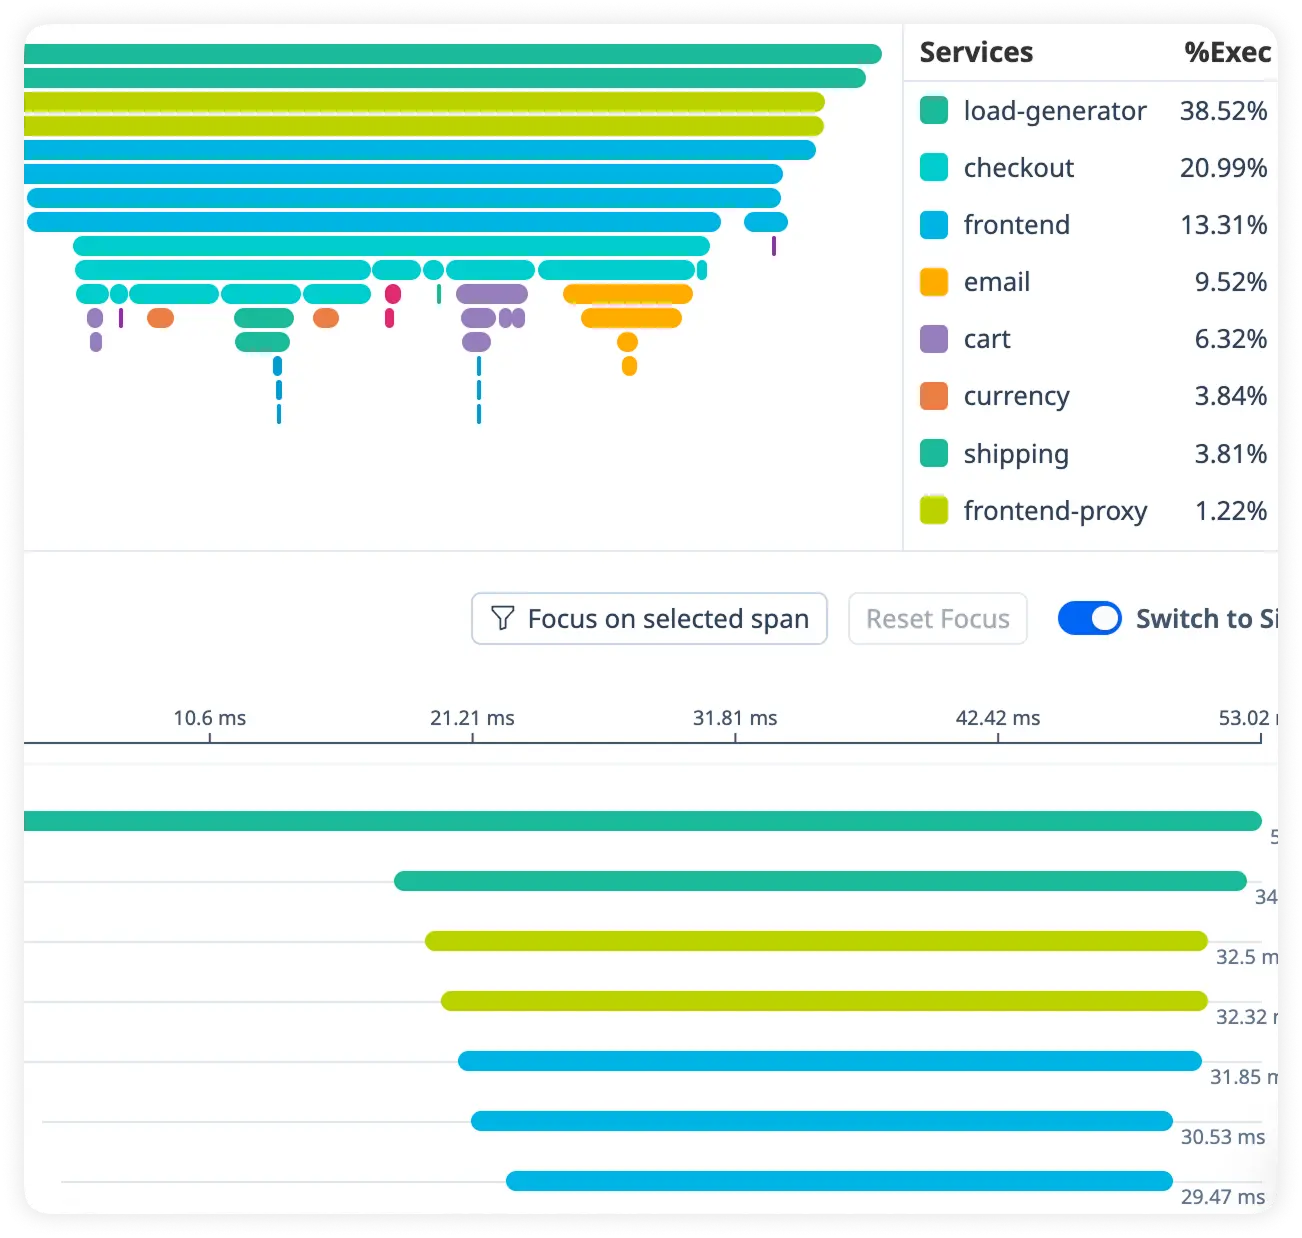
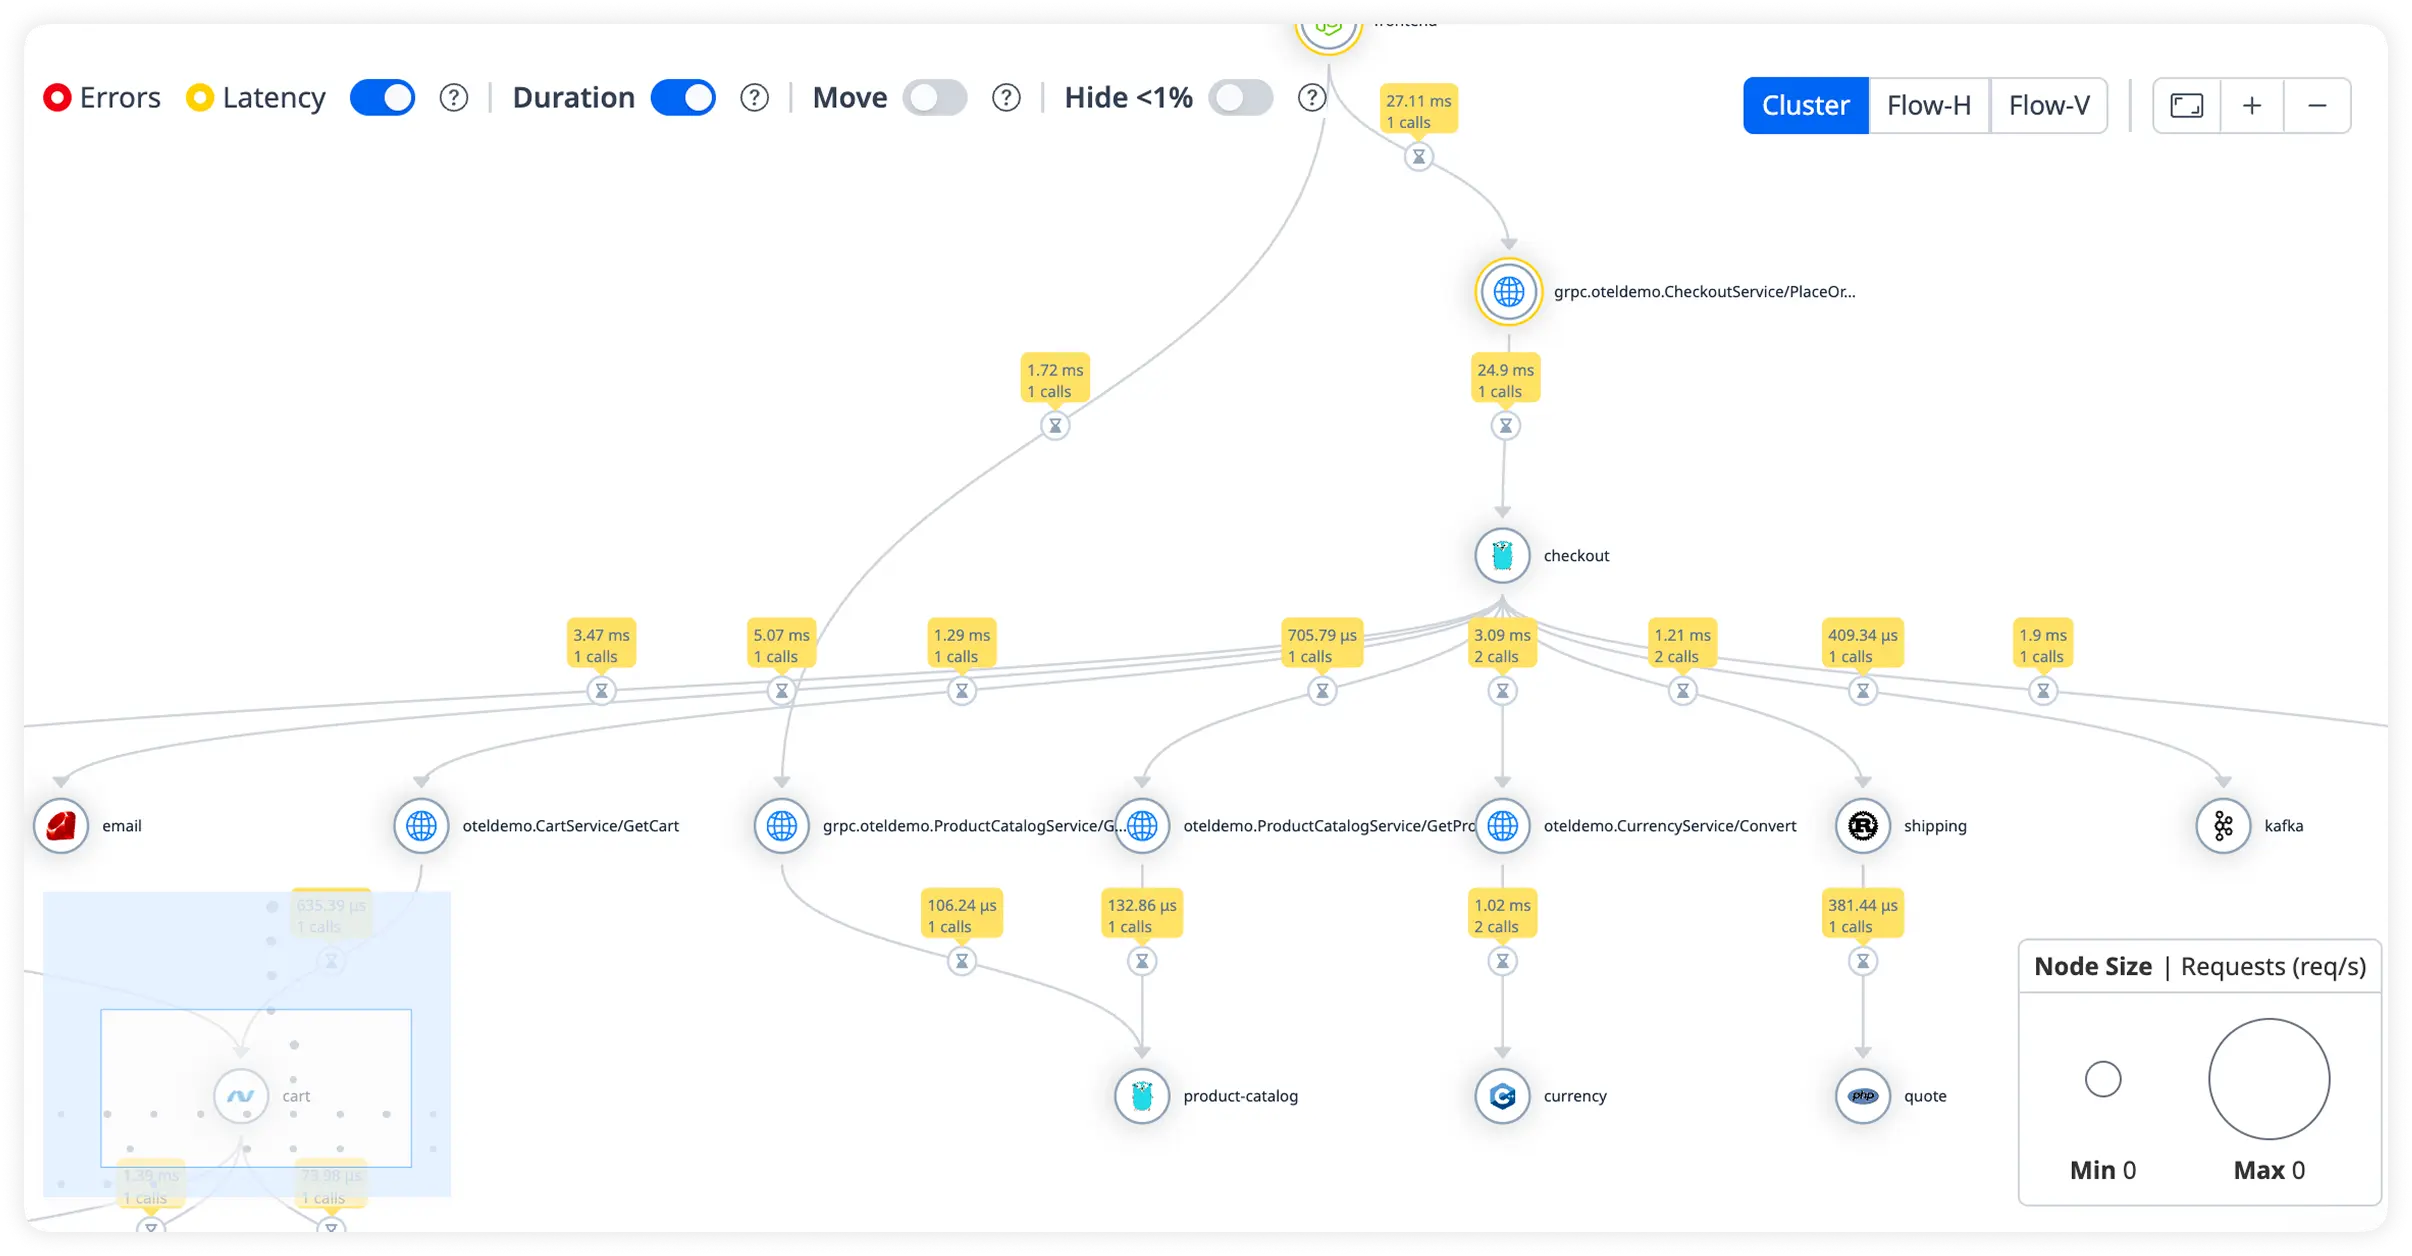
Visualize Microservice Dependencies
Map service interactions with real-time latency, throughput, and error metrics to uncover bottlenecks across distributed architectures.
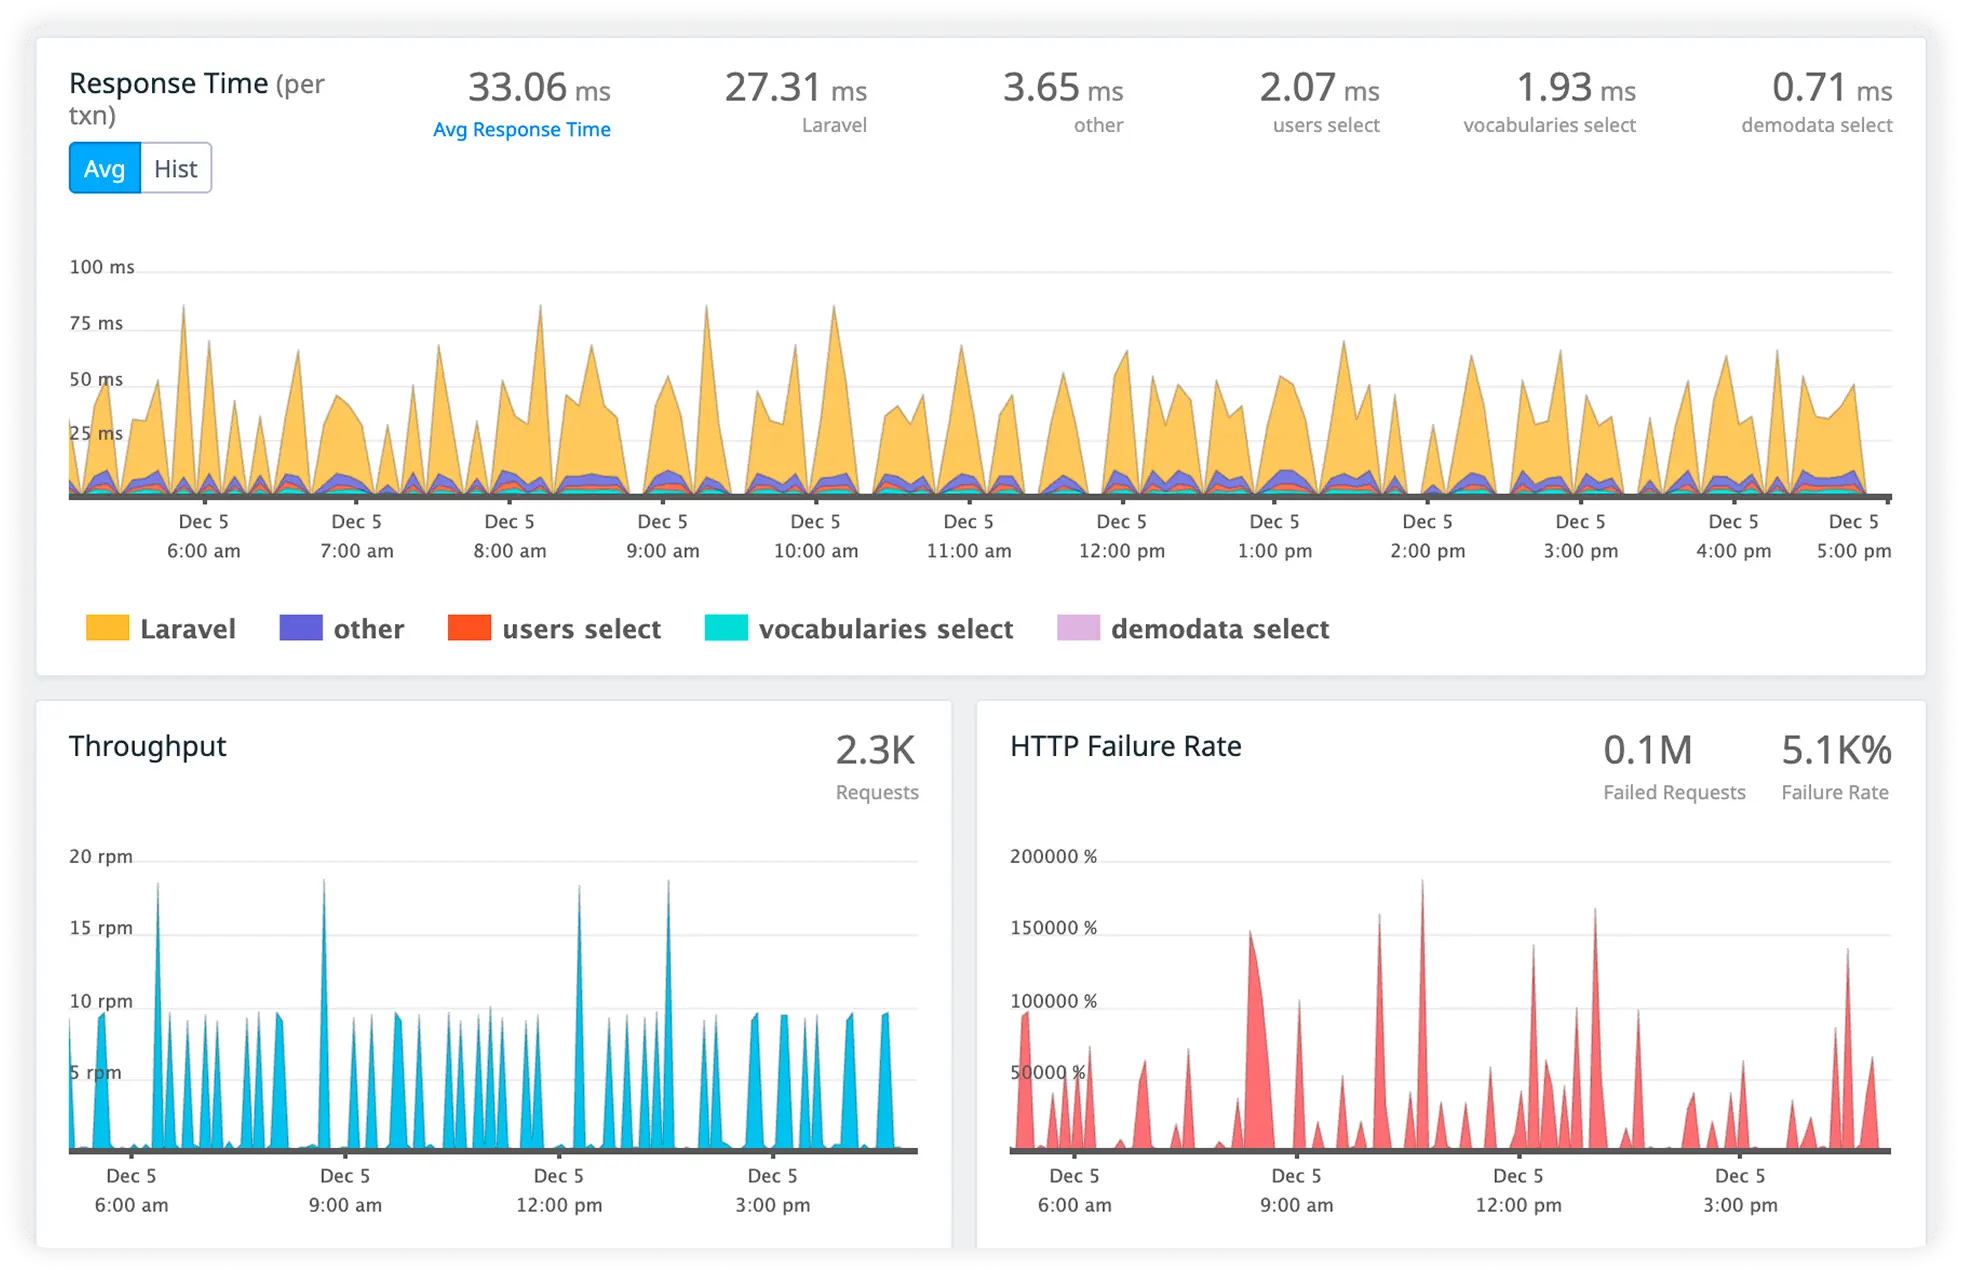
Monitor Business-Critical APIs
Track response times, failures, and throughput for high-value workflows that directly impact users and business outcomes.
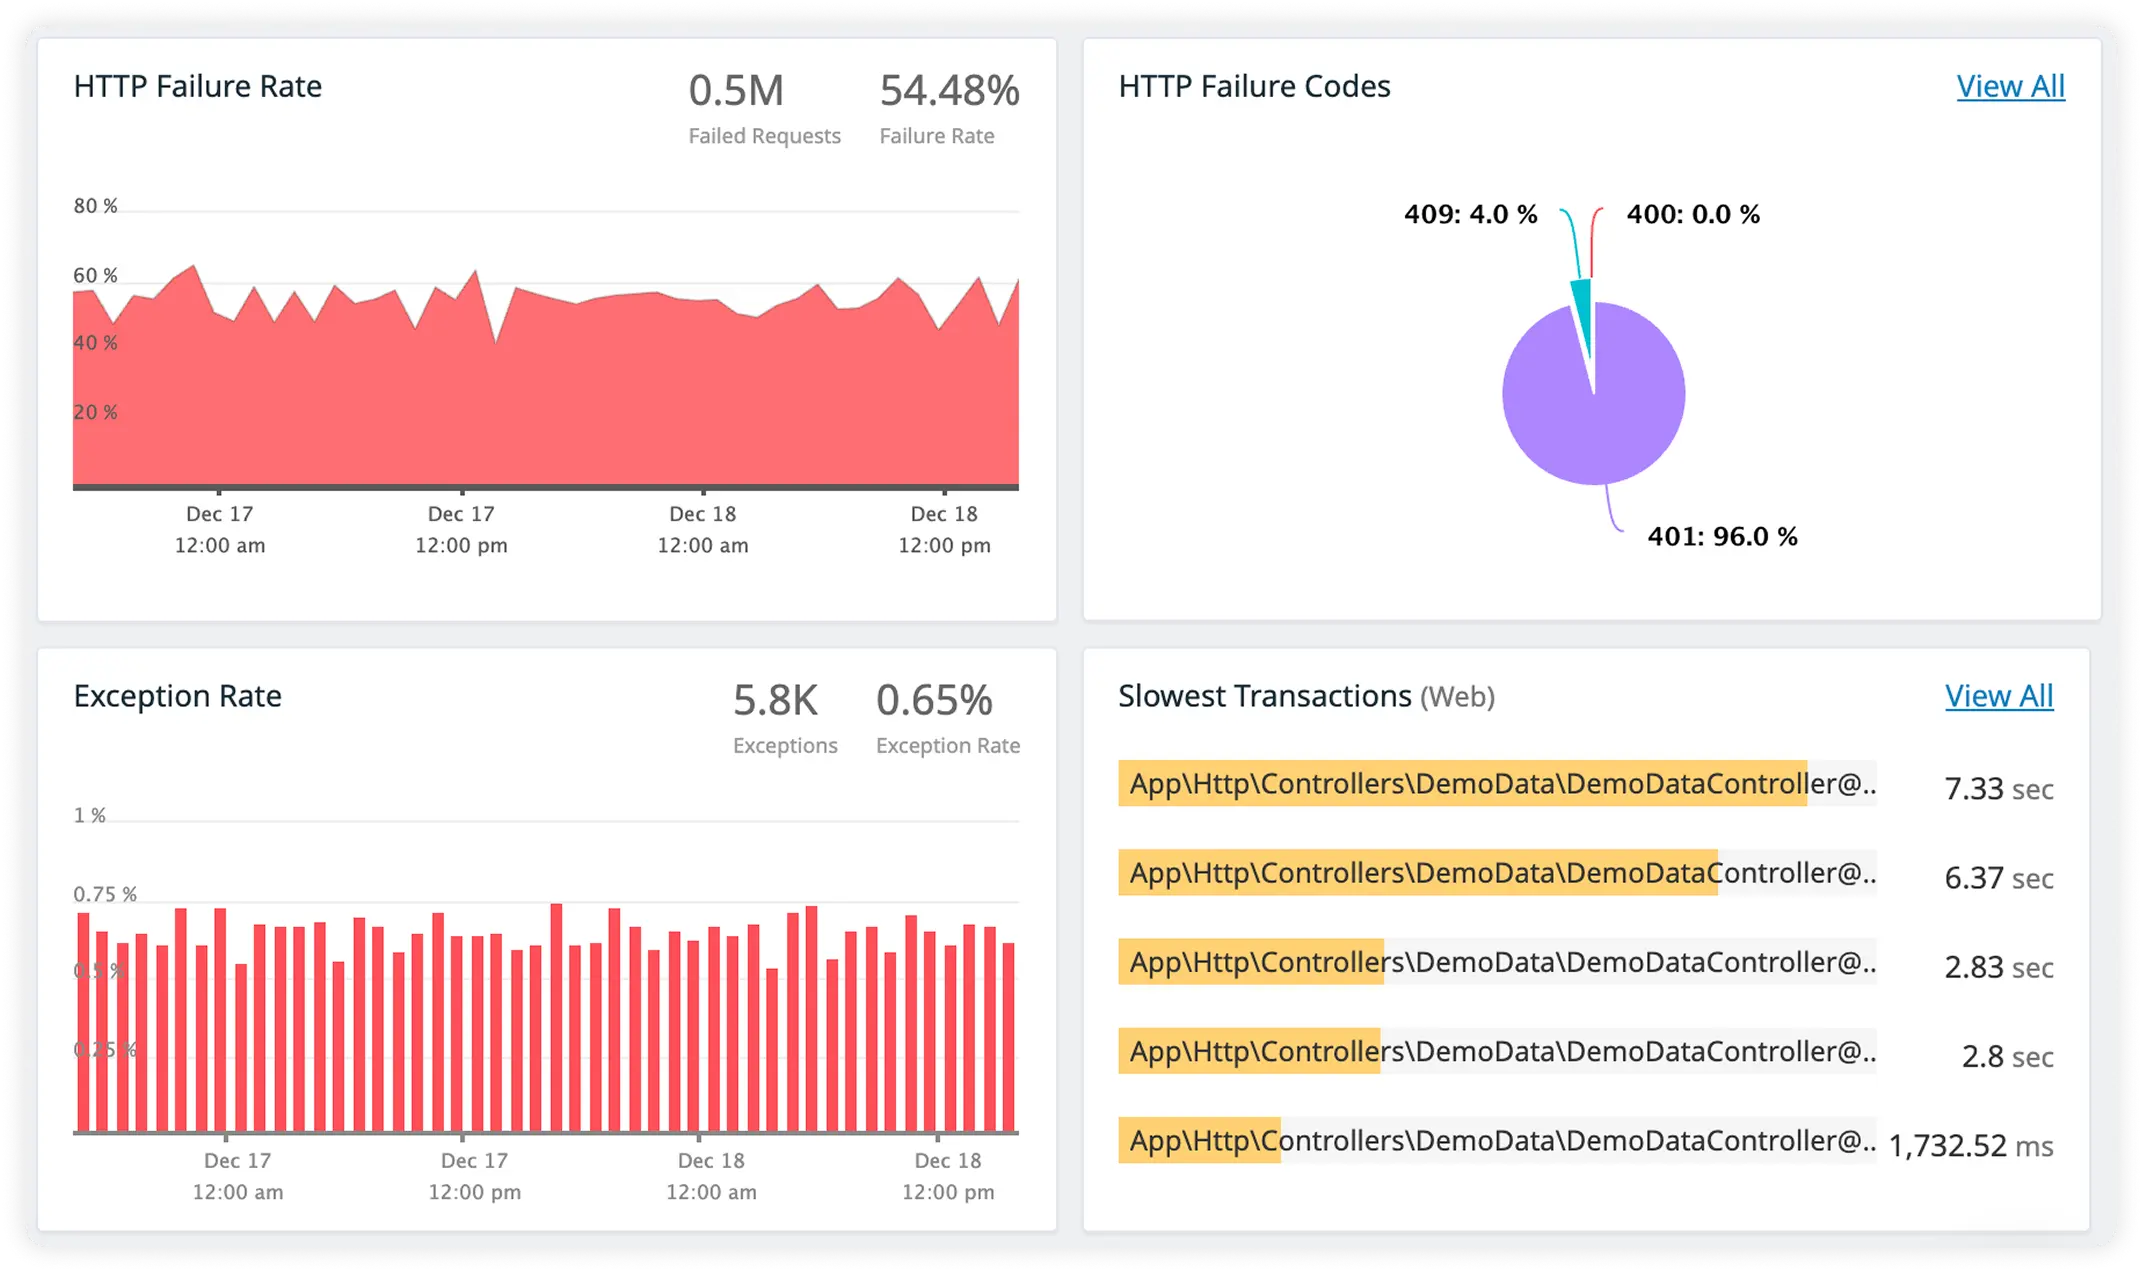
Track External Service Health
Detect slowdowns, errors, and outages across third-party integrations before users experience disruptions.
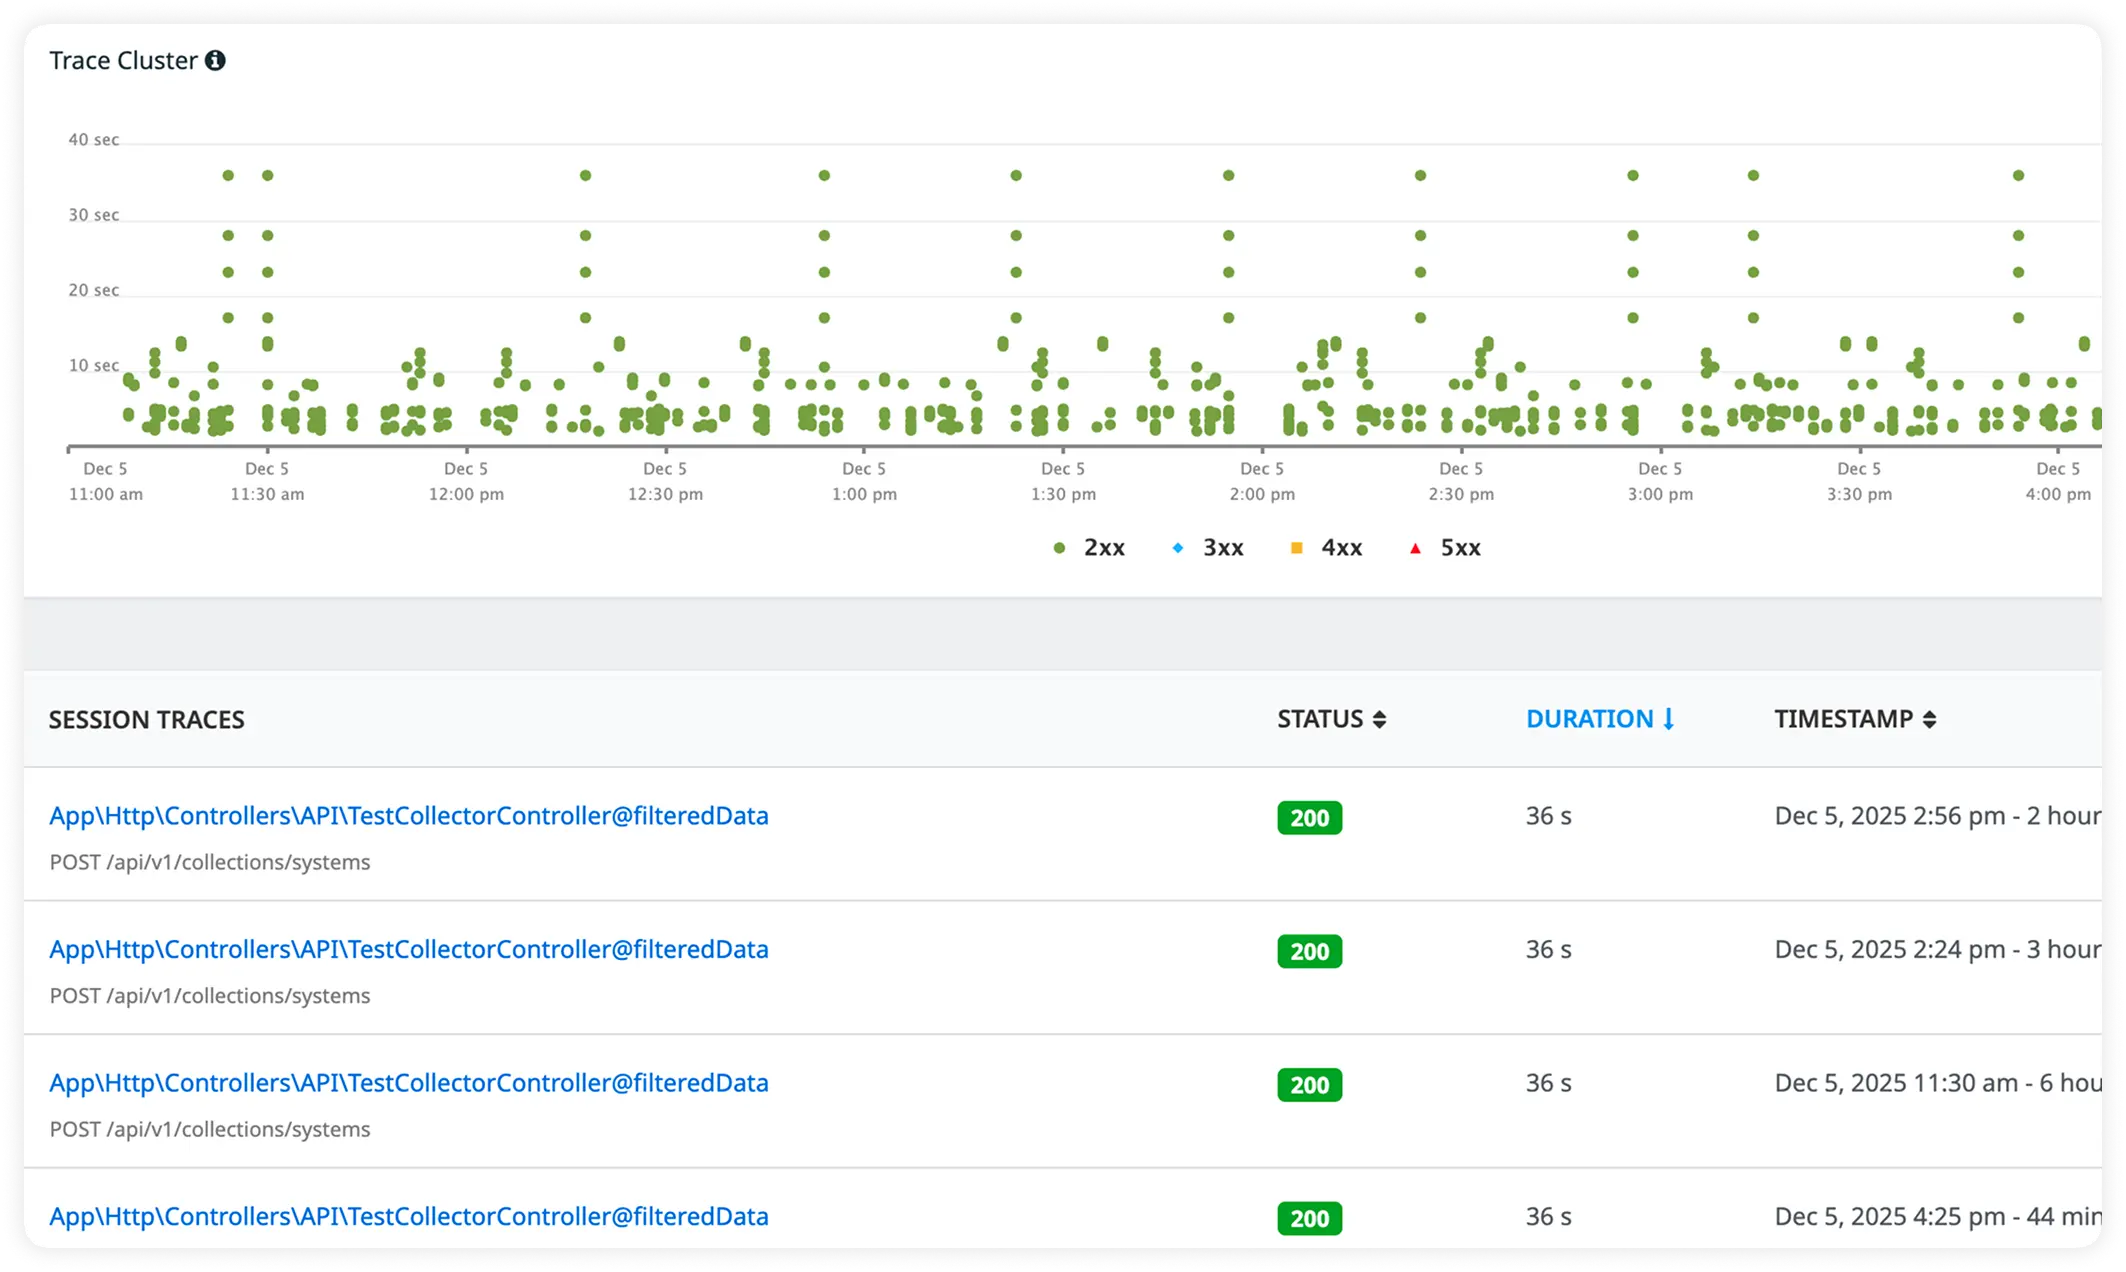
Why NestJS teams standardize on Atatus
As NestJS systems mature, maintaining a reliable understanding of layered runtime behavior becomes harder than writing new code. Teams standardize on Atatus to eliminate execution ambiguity, align engineers around the same production reality, and preserve confidence as abstractions and scale increase.
Consistent Execution Clarity
Teams retain a clear understanding of how requests traverse layered execution stages in production without reconstructing framework behavior.
Fast Production Alignment
Engineers align quickly on runtime behavior, reducing dependence on tribal knowledge or senior-only context during incidents.
Immediate Data Trust
Production signals are trusted from the start of an investigation, enabling decisive action without validation delays.
Reduced Cognitive Load
Engineers reason about failures without mentally stitching together lifecycle phases, lowering investigation complexity.
Predictable Debug Discipline
Incident response follows consistent analytical patterns instead of improvisation under pressure.
Shared Operational Language
Platform, SRE, and backend teams reference the same runtime evidence during production incidents.
Stable Insight Under Scale
Production understanding remains intact as concurrency, traffic, and service boundaries expand.
Lower On-Call Exhaustion
Clear execution insight shortens incident cycles and reduces escalation fatigue for on-call engineers.
Durable Engineering Confidence
Teams continue shipping, refactoring, and scaling services without fear of unseen production behavior.
Unified Observability for Every Engineering Team
Atatus adapts to how engineering teams work across development, operations, and reliability.
Developers
Trace requests, debug errors, and identify performance issues at the code level with clear context.
DevOps
Track deployments, monitor infrastructure impact, and understand how releases affect application stability.
Release Engineer
Measure service health, latency, and error rates to maintain reliability and reduce production risk.