Infrastructure Monitoring
Get complete visibility of your infrastructure to diagnose and resolve performance issues that impact your business. Make better business decisions by correlating application metrics, logs and traces to troubleshoot problems faster.
Infrastructure Management Challenges
Without proper infrastructure monitoring, teams face these critical operational issues:
Unexpected Server Outages
Servers crashing without warning, causing downtime and lost revenue. No proactive alerts to prevent outages before they happen.
"As a sysadmin, our servers crash at 3 AM and I only find out when the on-call alerts wake me up. We need predictive monitoring."
Cloud Cost Overruns
Cloud infrastructure bills spiraling out of control without visibility into which resources are driving costs or being underutilized.
"As a CFO, our AWS bill tripled last month and we have no idea which resources are responsible for the cost increase."
Container & K8s Complexity
Managing hundreds of containers and pods without centralized monitoring makes it impossible to track resource usage and performance.
"As a DevOps engineer, we run 500+ containers across multiple Kubernetes clusters, and I can't keep track of resource usage or spot issues."
Resource Bottlenecks
Applications slowing down due to CPU, memory, or disk bottlenecks, but no way to identify which servers need scaling.
"As a platform engineer, our apps are slow during peak hours, but I don't know which servers are maxed out or need additional resources."
Multi-Cloud Visibility Gap
Infrastructure spread across AWS, Azure, and GCP with no unified view, making management and troubleshooting extremely difficult.
"As a cloud architect, we use multiple cloud providers but monitoring each separately is a nightmare. We need unified visibility."
Alert Fatigue from False Positives
Getting bombarded with hundreds of alerts daily, most being false positives, making it impossible to identify real issues.
"As an on-call engineer, I receive 200+ alerts per day and 90% are false positives. I'm missing critical issues in the noise."
Optimize Your Infrastructure
in Real-Time
Get real business value across your server landscape by monitoring the health and performance of your services, hosts, containers and resources.
Host Monitoring
Get an enhanced overview of your servers and containers, with a summary of CPU, memory, disk, network utilization in a single view.
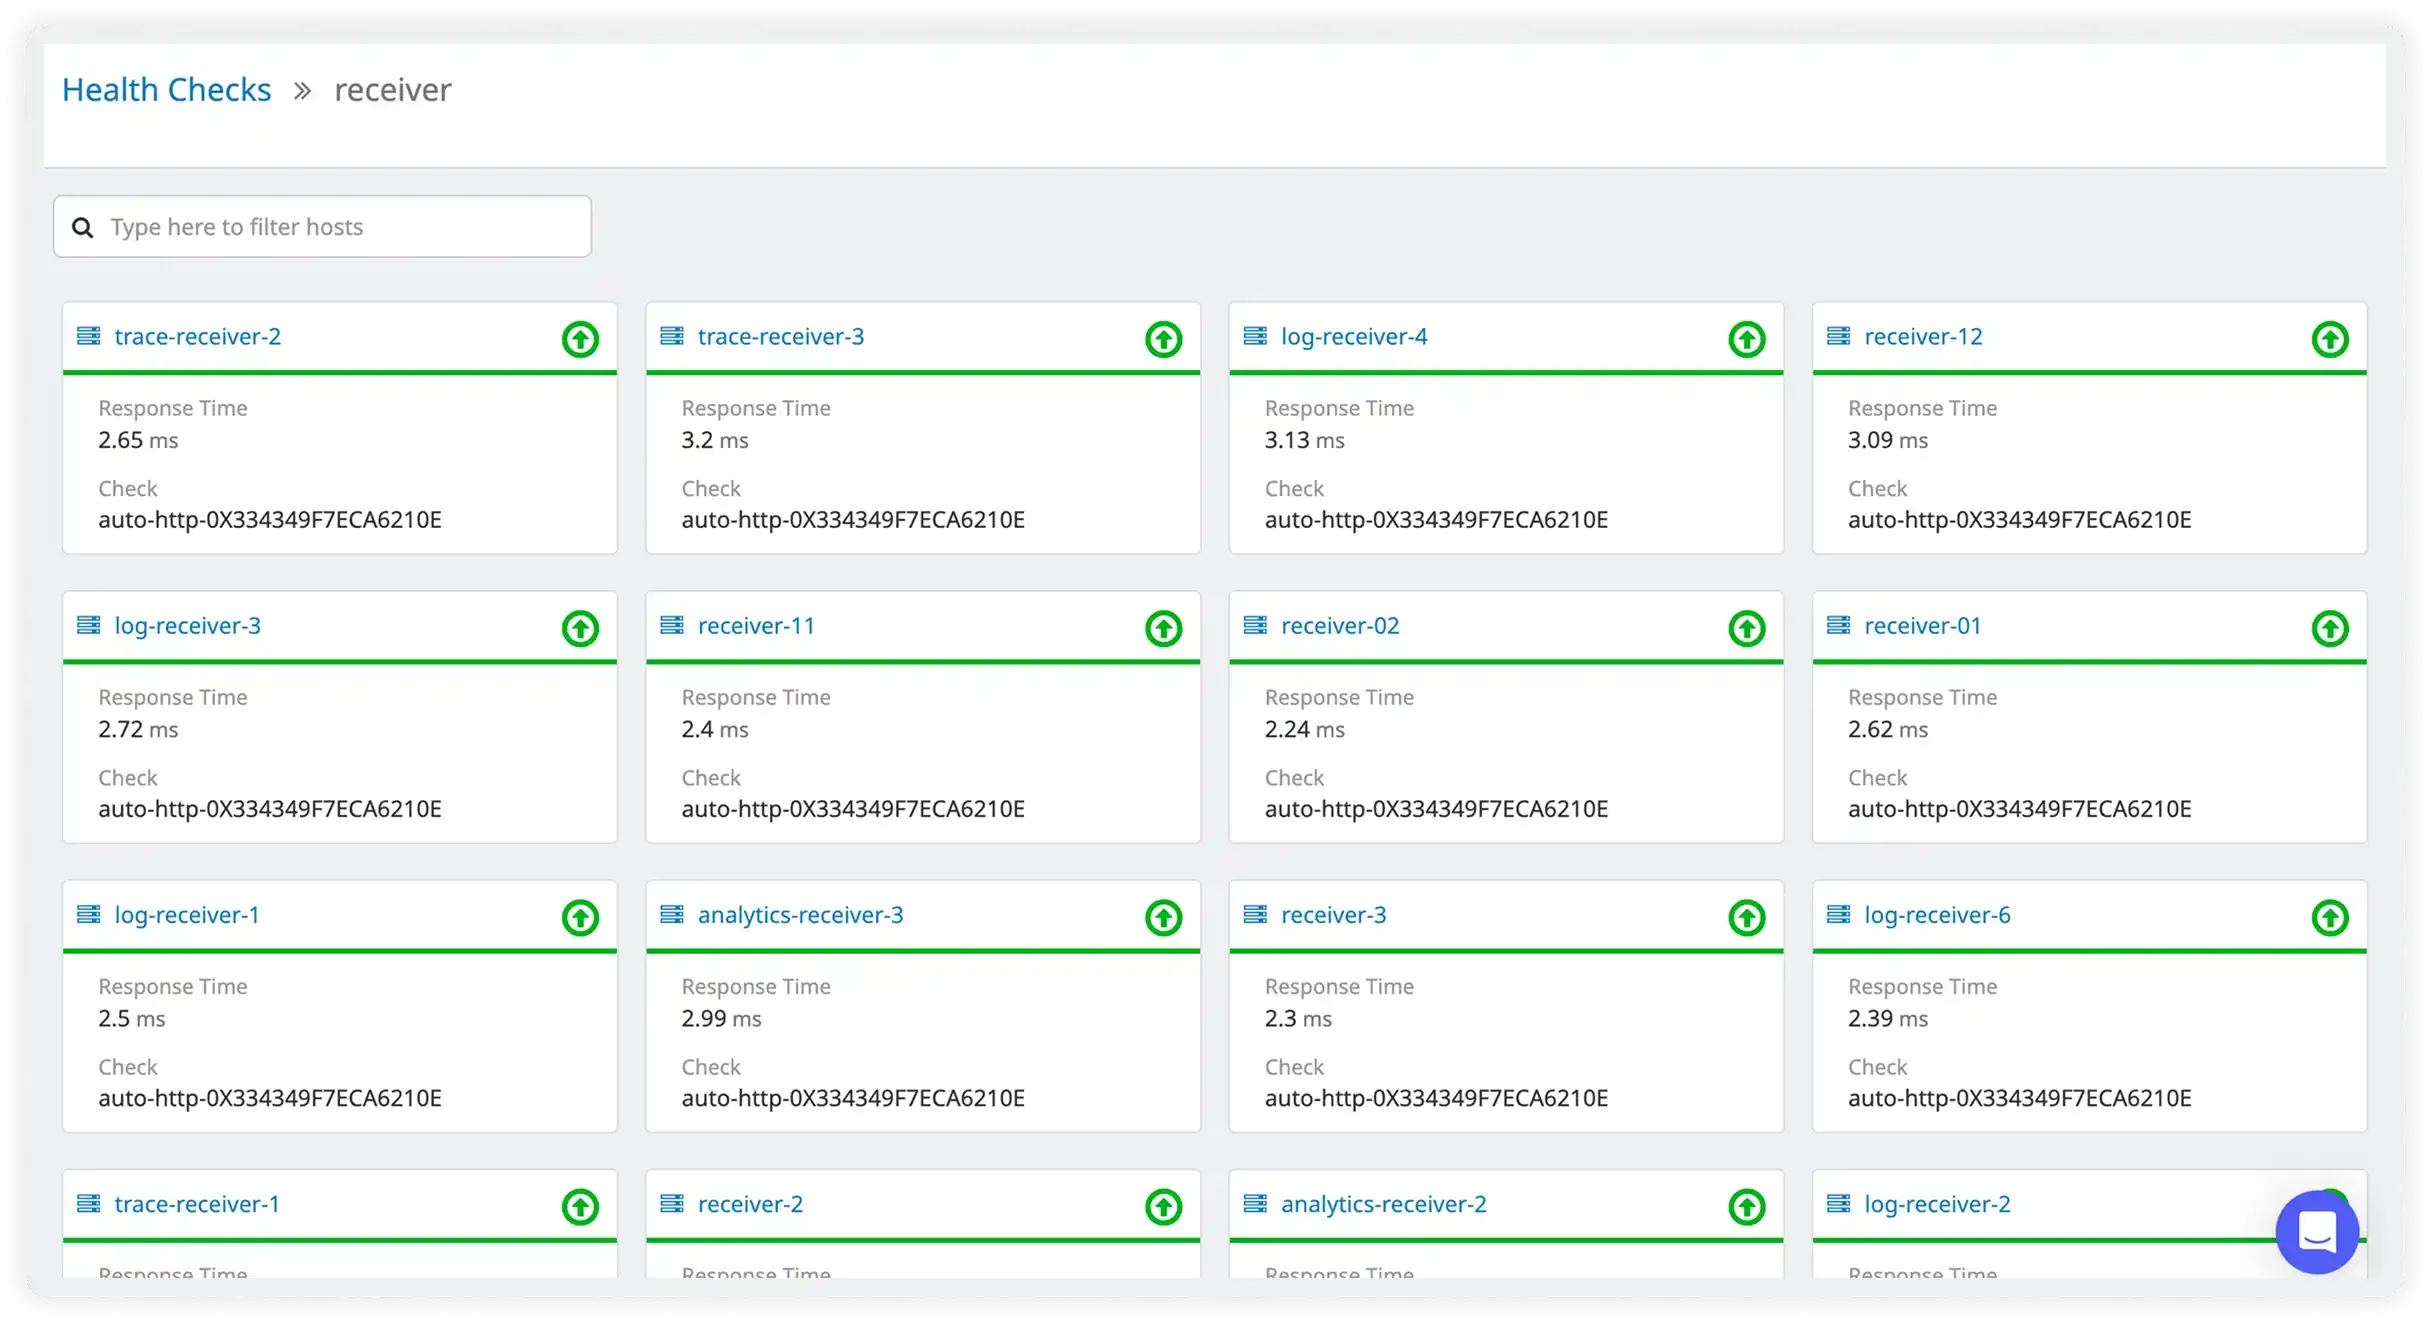
Health Checks
Set up health checks to monitor health (uptime) of apps or services running on your servers. Get notified on any impact to the services.
Process Monitoring
See the summary of all your resources per process, including CPU, memory, storage and network, with detailed data for troubleshooting issues.
Inventory Tracking
Search, filter and group packages, inventory data to identify security vulnerabilities, mismatches, and any user action on your servers.
How Atatus Infrastructure Monitoring Optimizes Operations
Achieve proactive infrastructure management with measurable cost and performance improvements
Prevent Outages Proactively
Smart alerts detect anomalies before they cause outages. Auto-remediation and predictive monitoring keep systems running 24/7.
Reduce Cloud Costs by 40%
Identify idle resources, right-size instances, and optimize cloud spending. Get detailed cost analytics and recommendations.
Complete Container Visibility
Monitor every container, pod, and node. Track resource usage, health checks, and performance across your entire container infrastructure.
Auto-Scaling Intelligence
Data-driven insights for scaling decisions. Know exactly when and how to scale infrastructure based on actual usage patterns.
Unified Multi-Cloud Monitoring
Single pane of glass for AWS, Azure, GCP, and on-premise infrastructure. Manage everything from one dashboard.
Faster Incident Response
Reduce MTTR from hours to minutes with instant alerting, root cause analysis, and automated incident workflows.
Infrastructure Insights
That Keep Systems Reliable
Comprehensive monitoring designed to maintain performance across complex infrastructure layers.
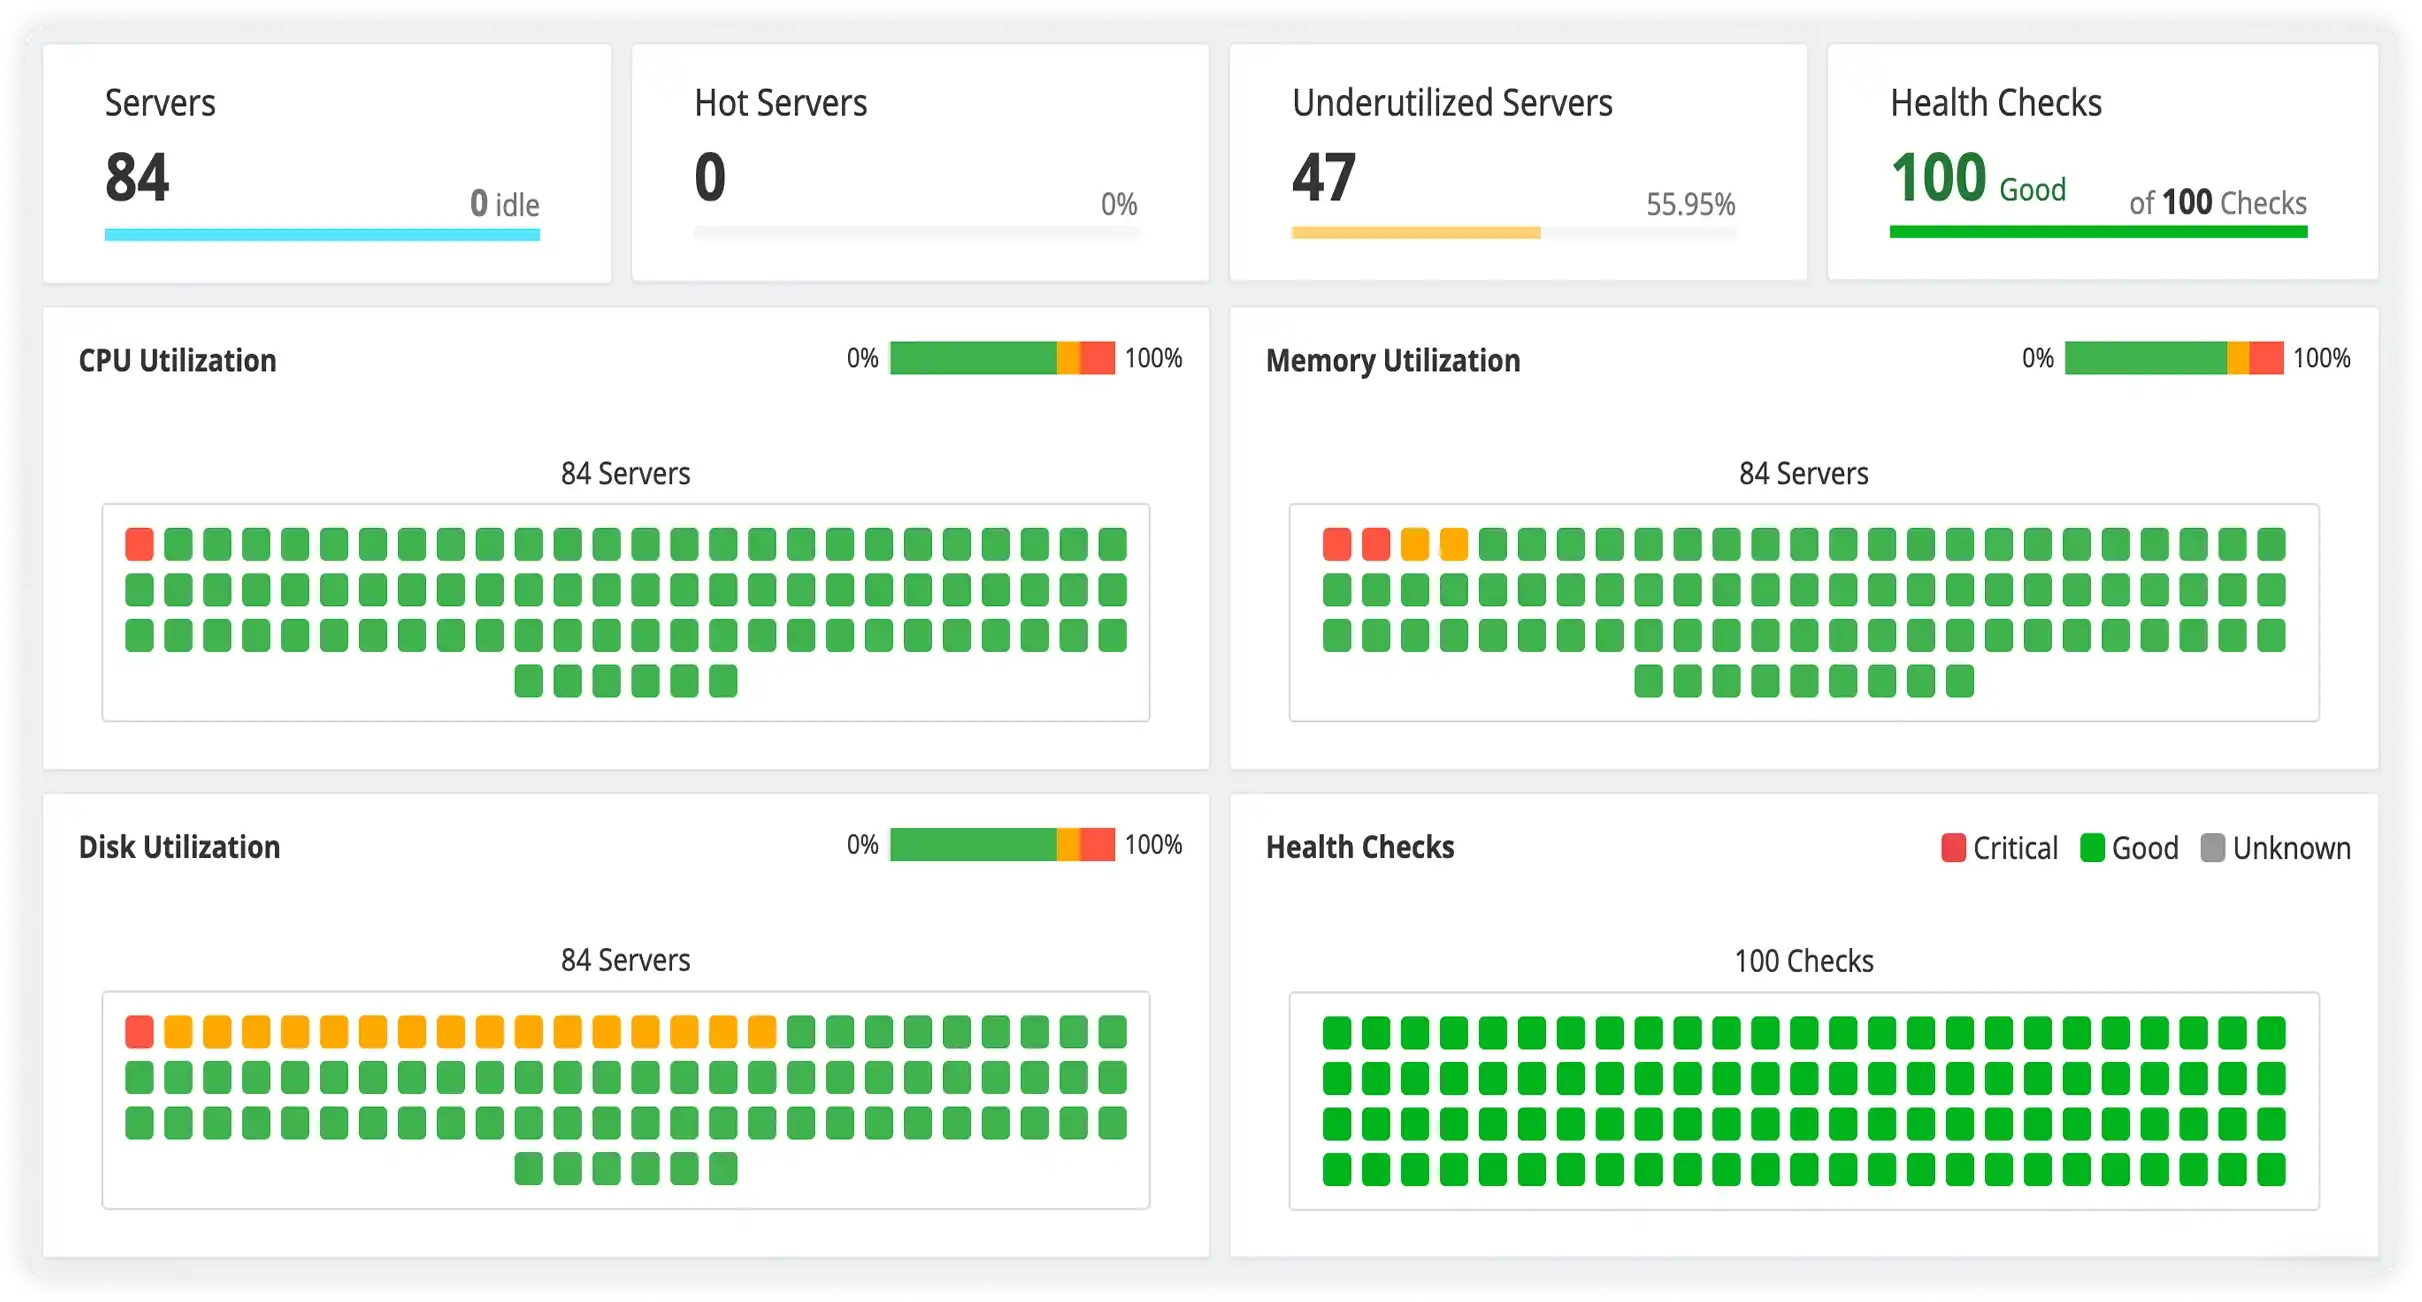
Identify Inefficient Resource Usage Across Servers
Quickly spot underutilized, overloaded, or imbalanced servers using visual heatmaps that highlight CPU, memory, and disk consumption trends.
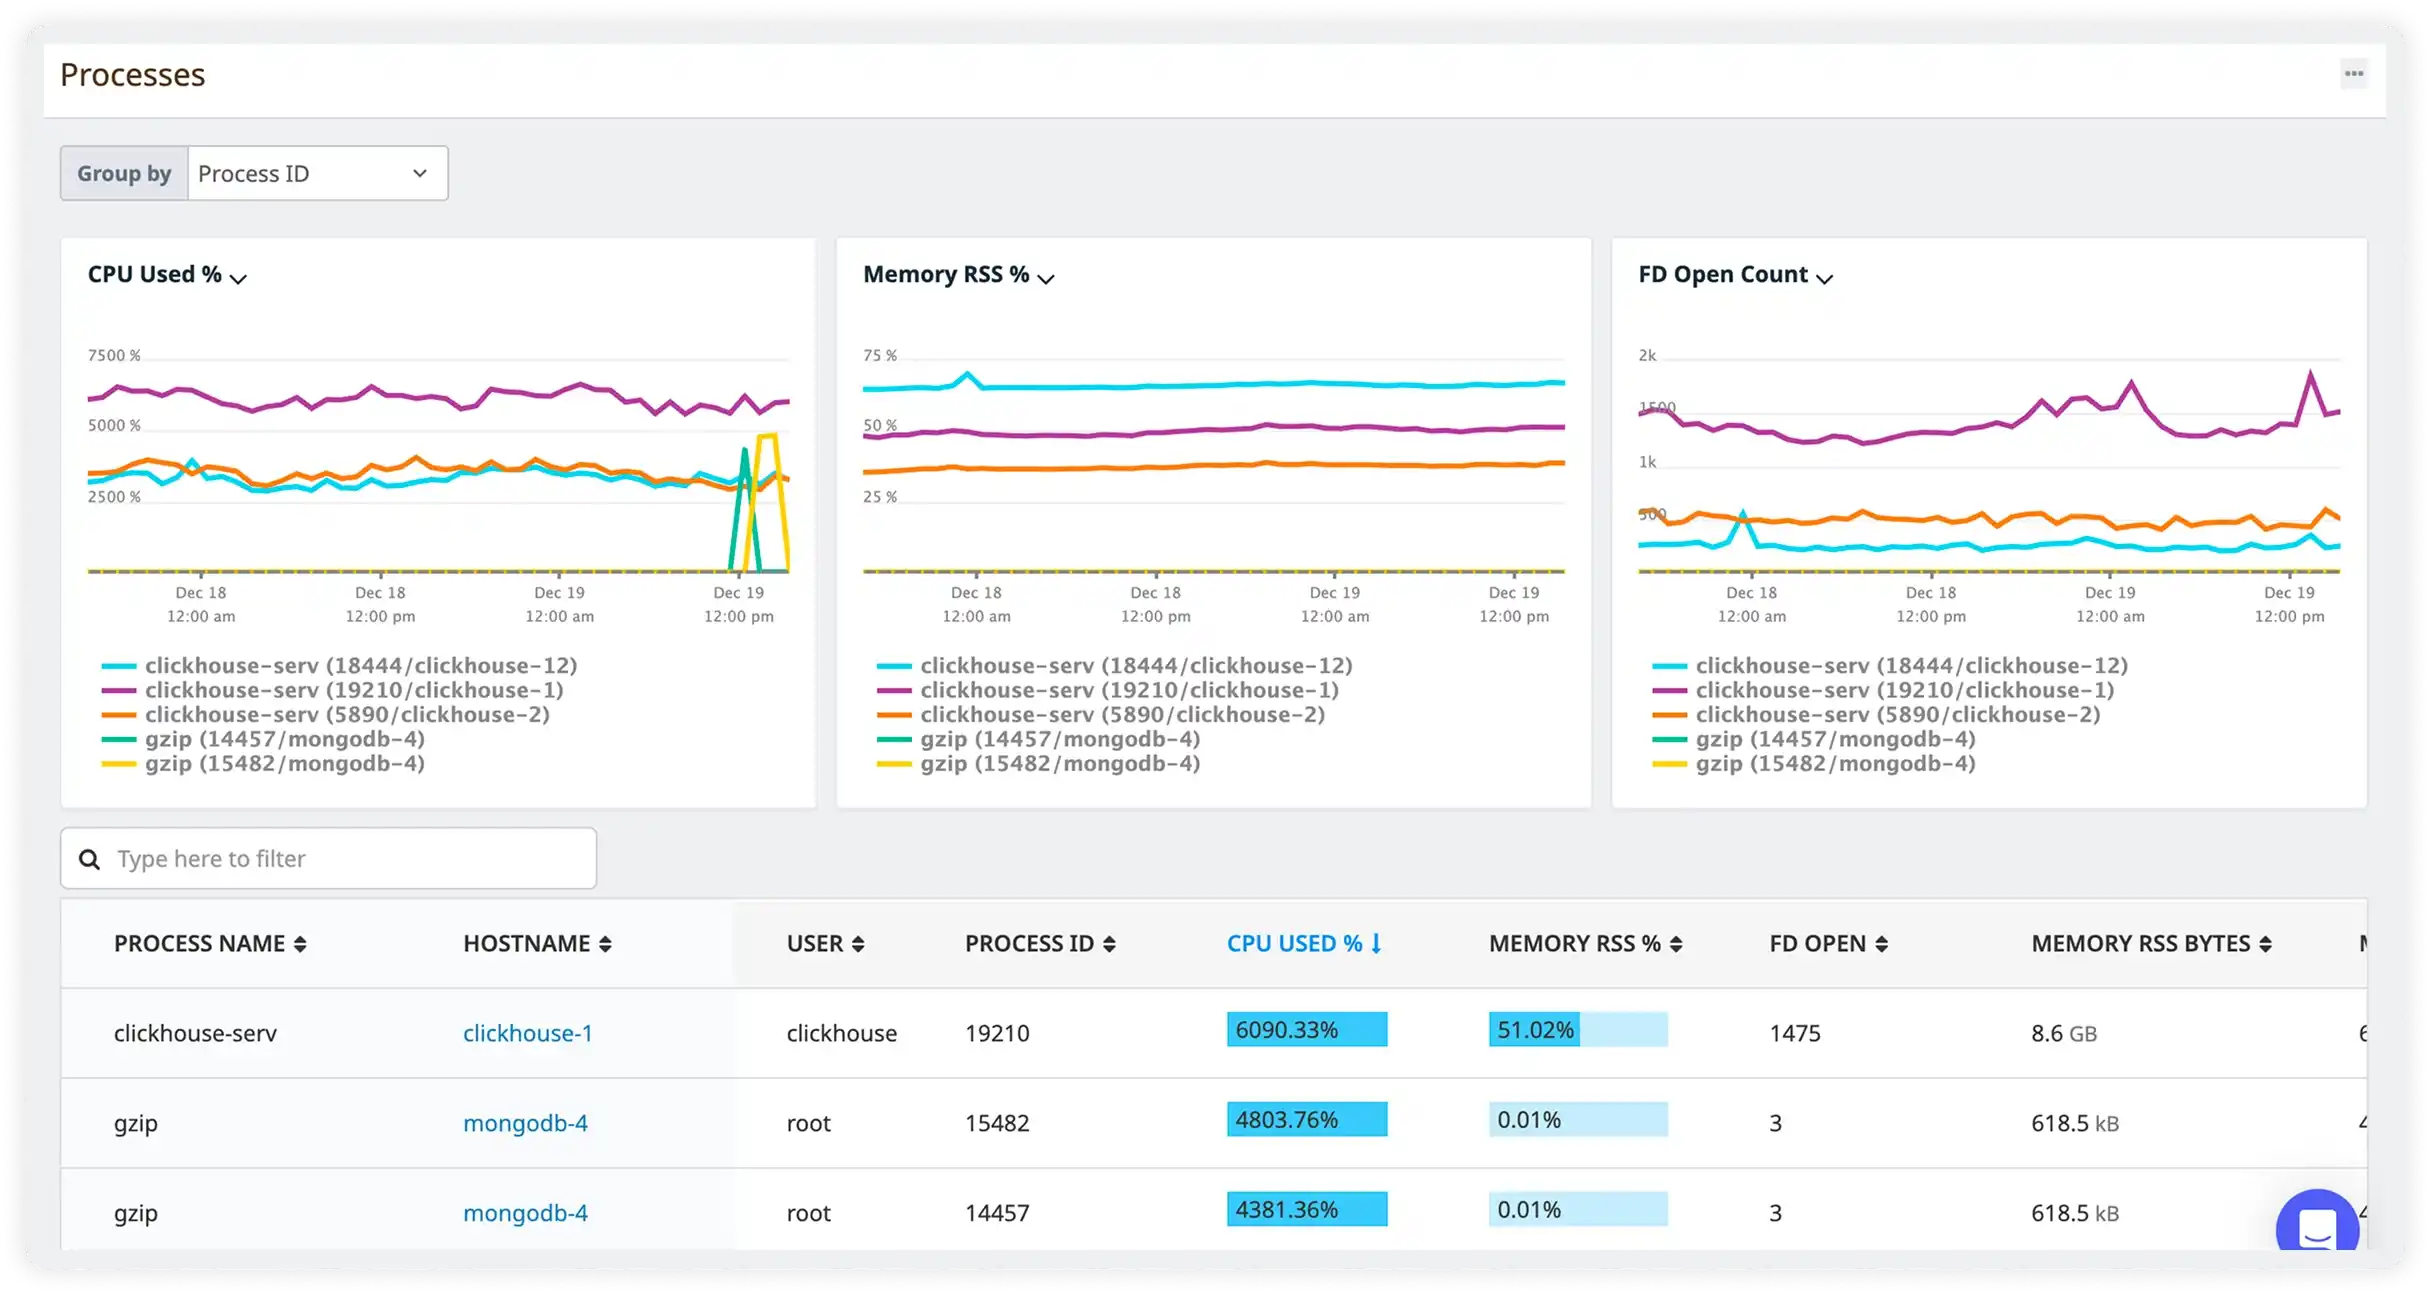
Analyze Which Processes Impact Performance Most
Break down CPU, memory, and file descriptor usage by process to understand how individual services affect system performance and reliability.
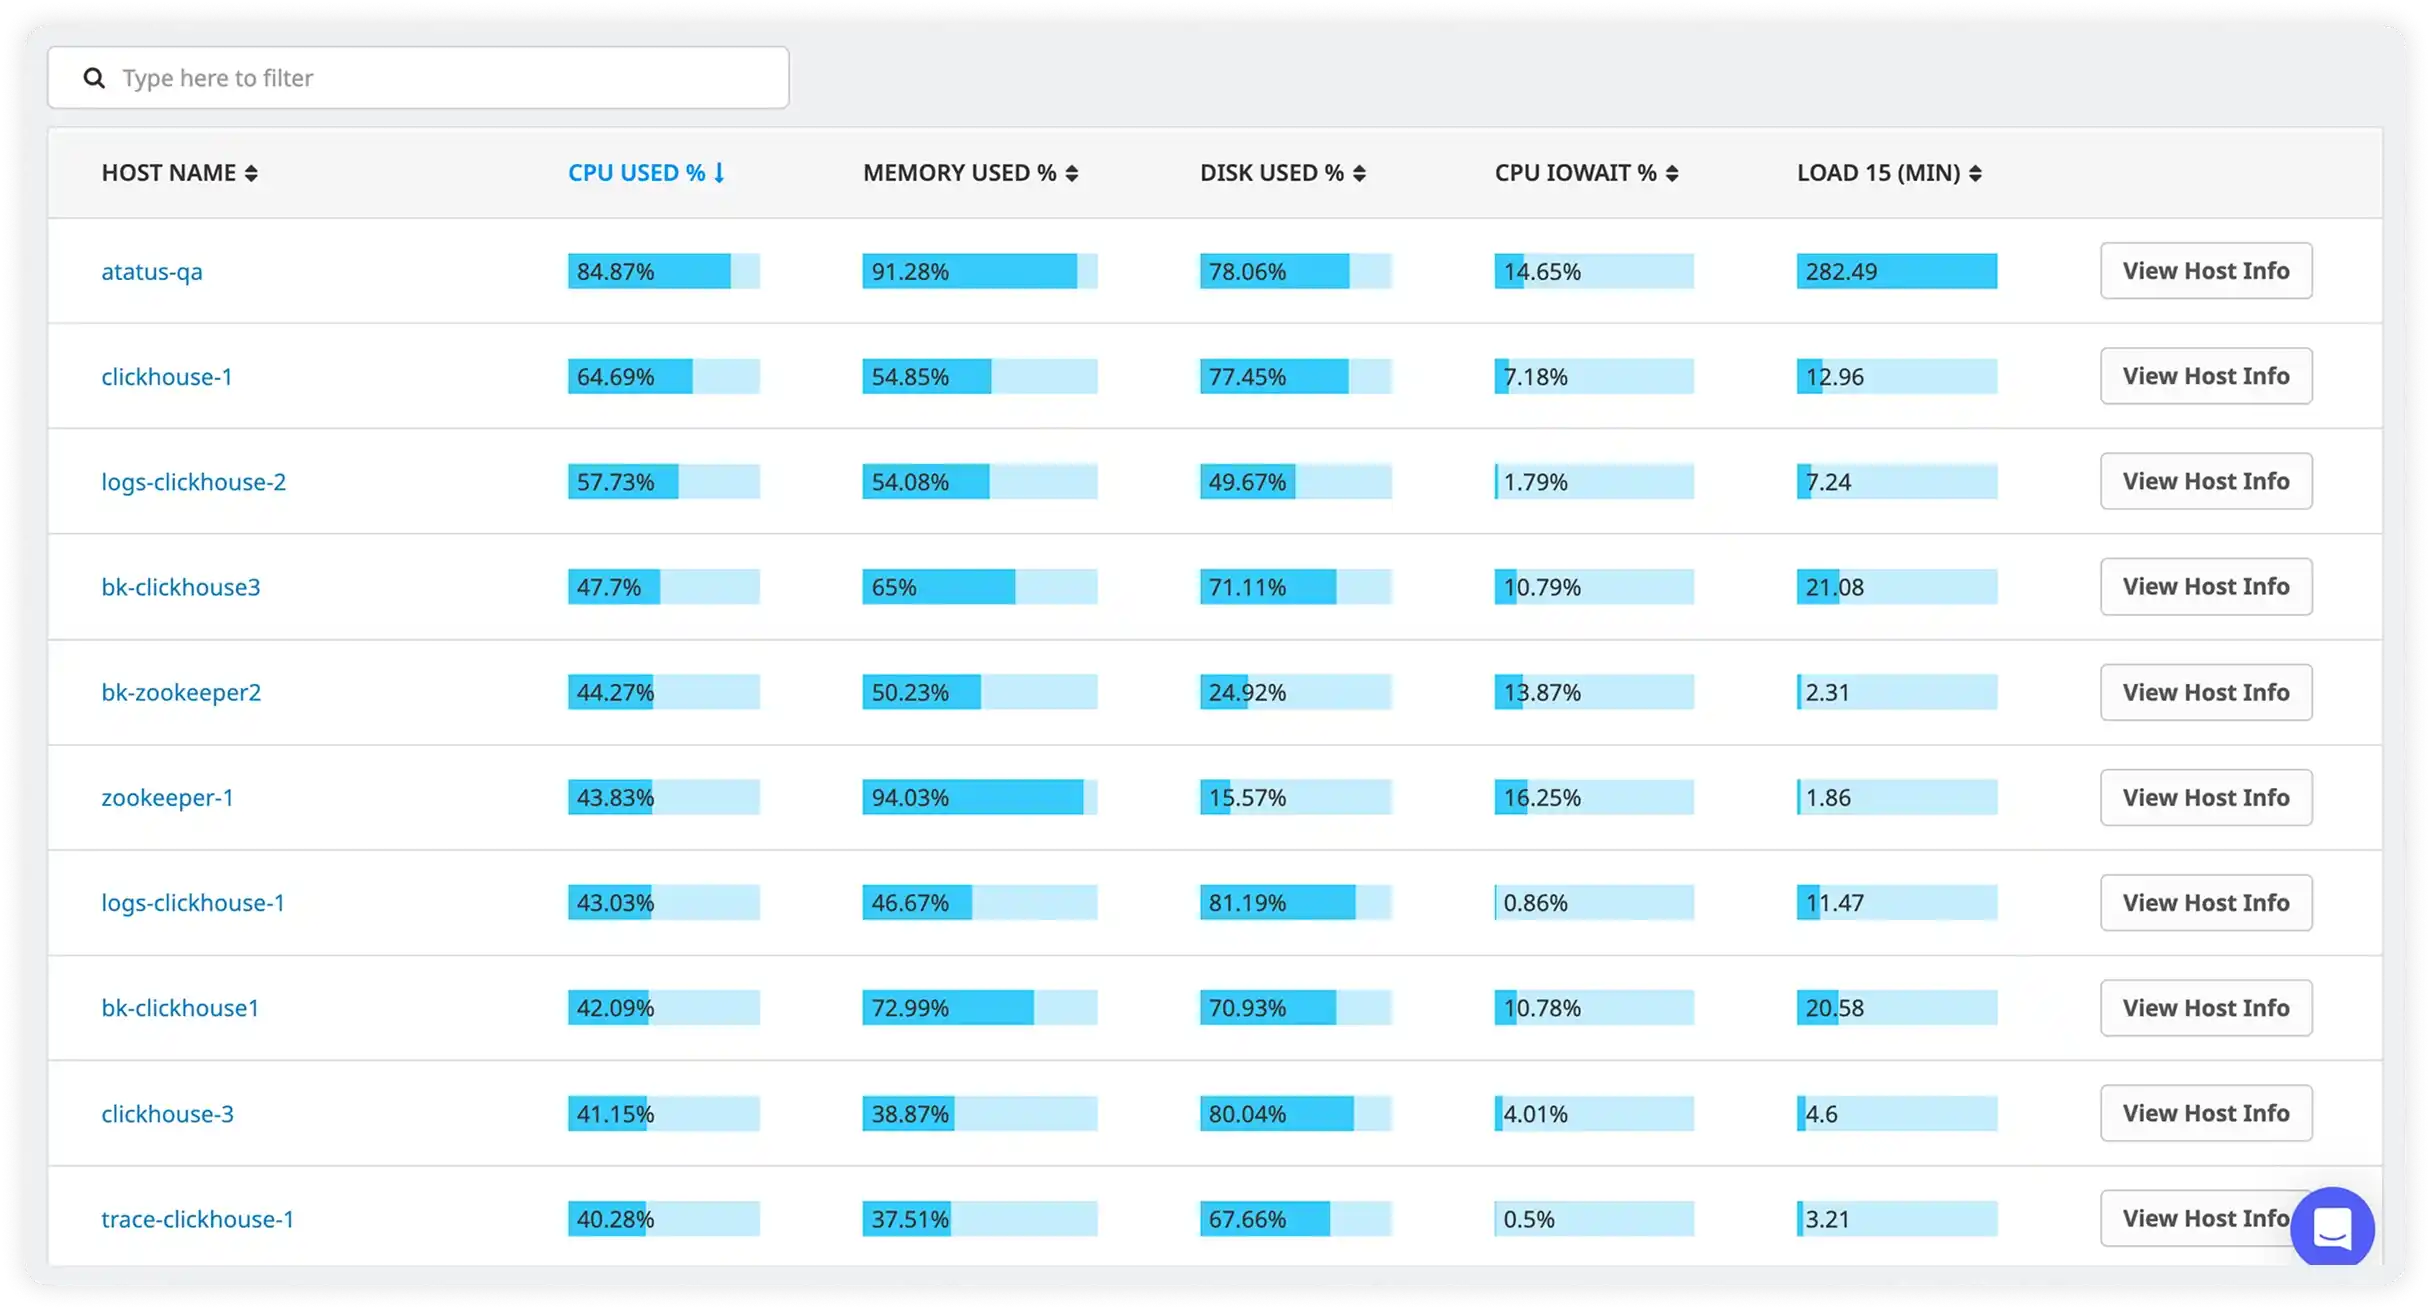
Compare Host Performance to Detect Outliers
Sort and analyze hosts based on utilization, IO wait, and load averages to uncover performance anomalies and capacity risks early.
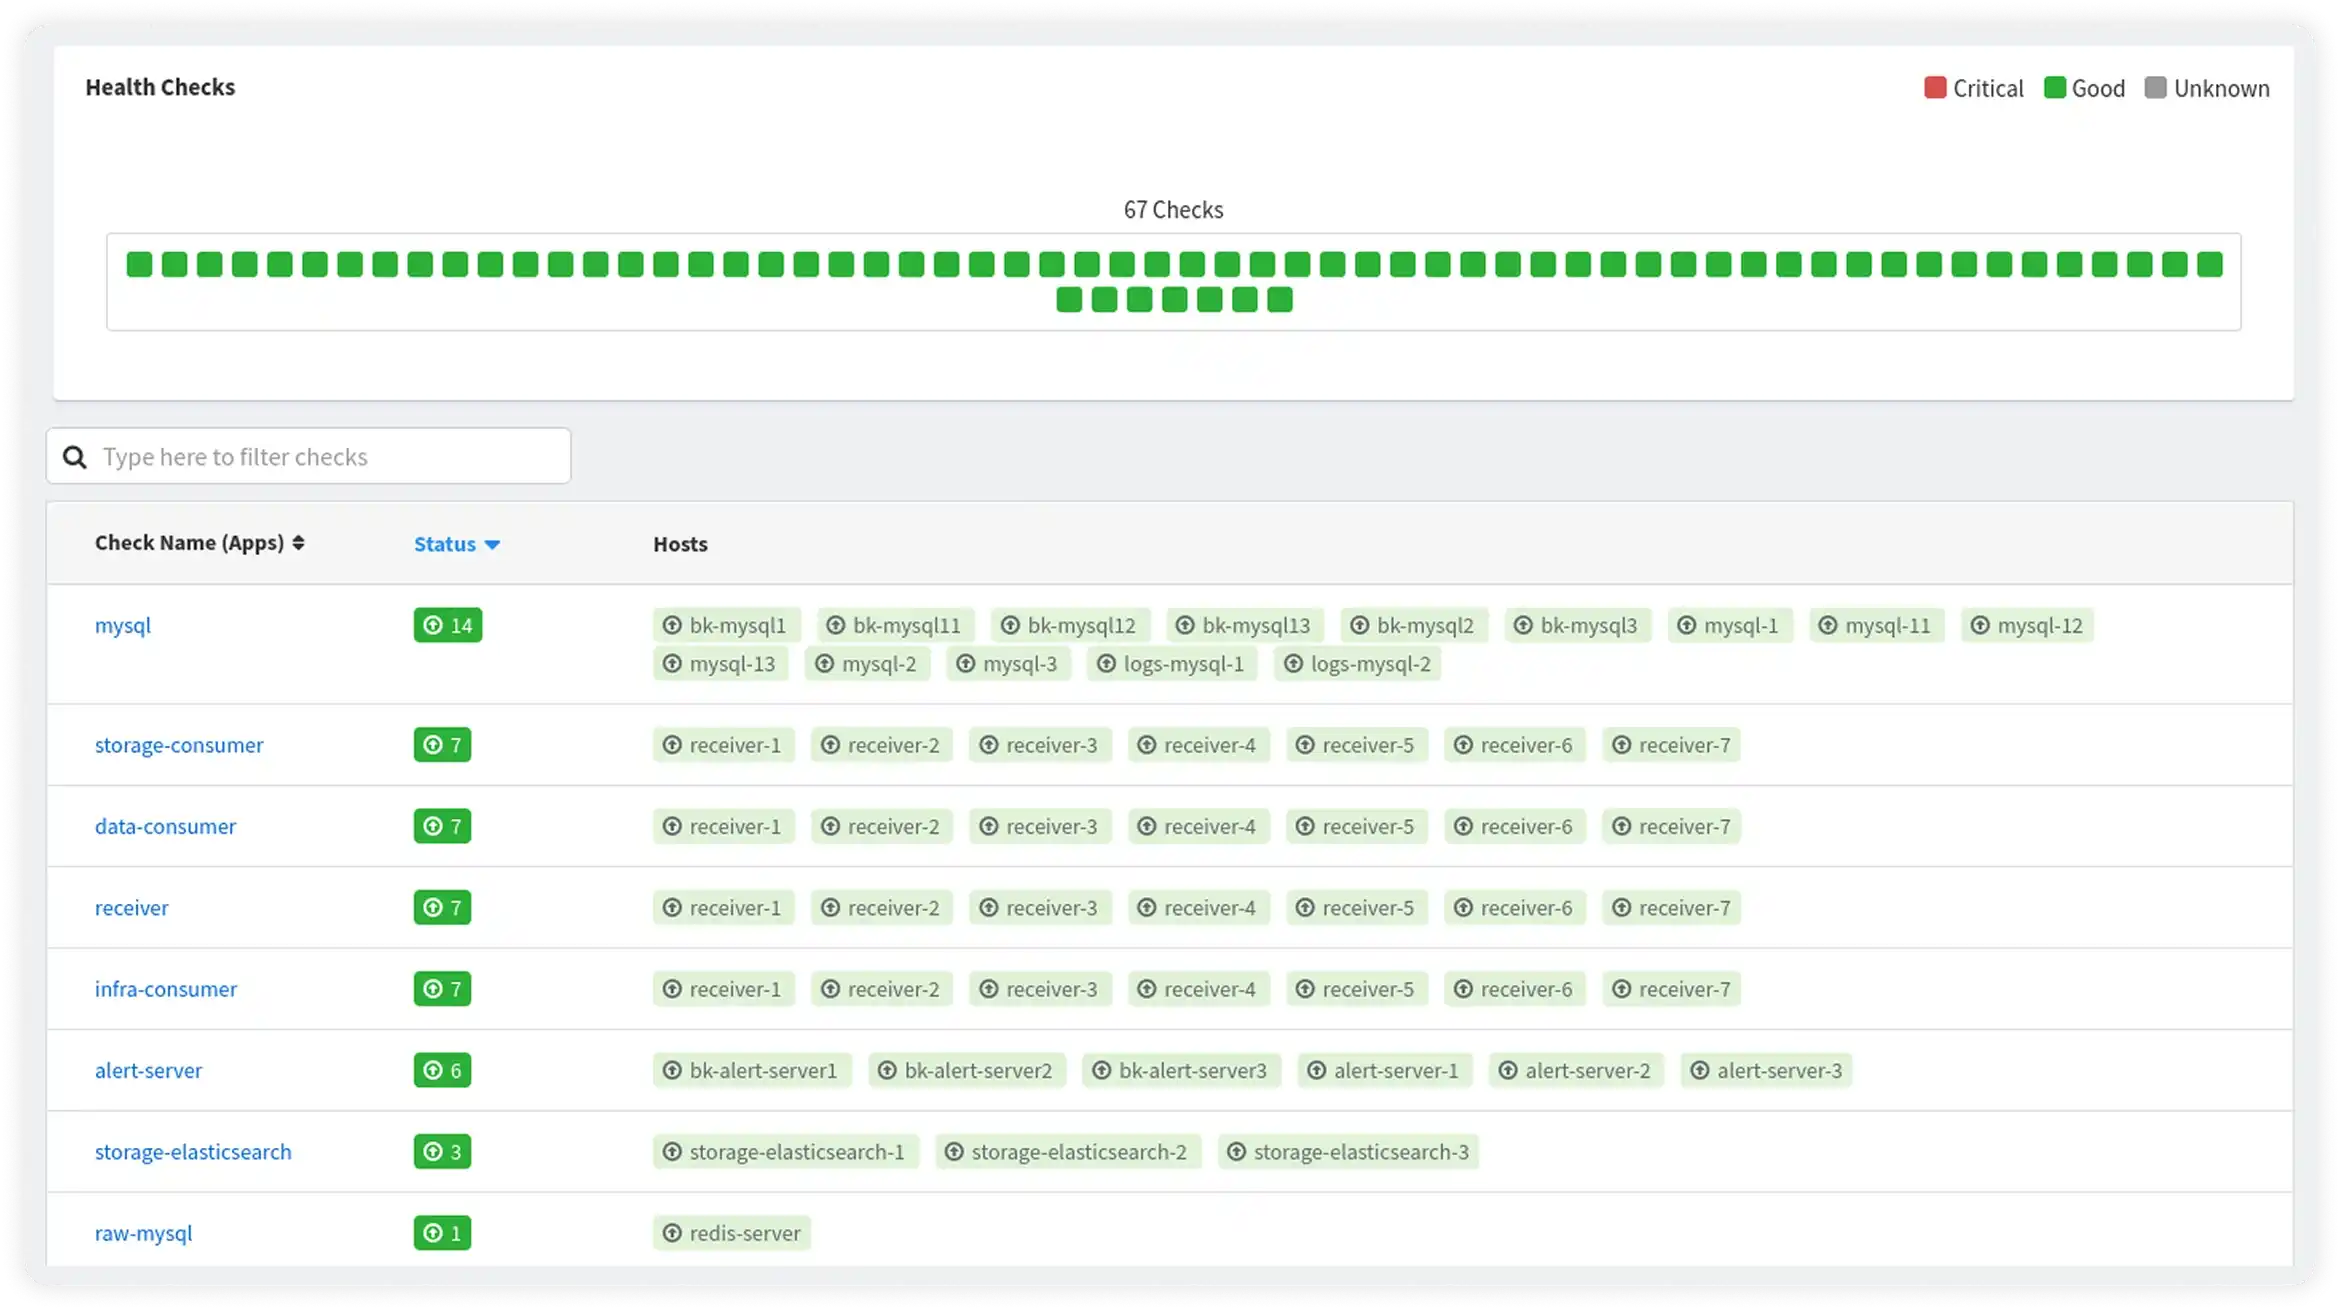
Monitor Service Availability and Response Times
Track service-level health checks to ensure applications remain responsive and meet reliability expectations across environments.
Start Monitoring in Under 5 Minutes
Three simple steps to complete observability. No credit card required.
Two-minute set up
Deploy and get started within minutes in seeing key server performance metrics for actionable insights. Just start collecting data and solving issues now.
Correlate Infra with APM
Troubleshooting becomes easier if you are able to correlate the host metrics with the APM slow traces and errors. Get connected context with unified monitoring.
Smart alerting
Setup alerts to automatically monitor your infrastructure for downtime, increase in CPU, memory, disk and storage consumption. Get notified through various channels.
Milestones that spark performance excellence
Reflections from clients who've achieved unmatched excellence through innovative strategies.
Read customer stories


