Ensure Uptime with 24x7 Synthetic Monitoring
Simulate user interaction with Synthetic(Uptime) Monitoring to test your website or application's availability. Check the slowness and functionality of your application to get accurate and actionable insights in an intuitive dashboard.
Uptime Monitoring Challenges
Without proactive uptime monitoring, teams face these critical availability issues:
Downtime Discovered by Customers
Without proactive uptime monitoring, businesses learn about outages through customer complaints and support tickets, damaging reputation and losing revenue.
"As a product manager, I find out our site is down from angry customer tweets instead of getting proactive alerts from our monitoring system."
No Global Performance Visibility
Applications may work fine from your location but experience slow load times or failures for users in different geographic regions due to CDN issues, DNS problems, or regional outages.
"As a DevOps engineer, I have no visibility into how our application performs for users in Asia, Europe, or South America."
API Endpoint Failures Go Unnoticed
While your website homepage might be up, critical API endpoints, authentication services, or payment gateways could be failing without anyone knowing until users report issues.
"As a developer, our checkout API failed for 2 hours, costing thousands in revenue, because we only monitored the homepage."
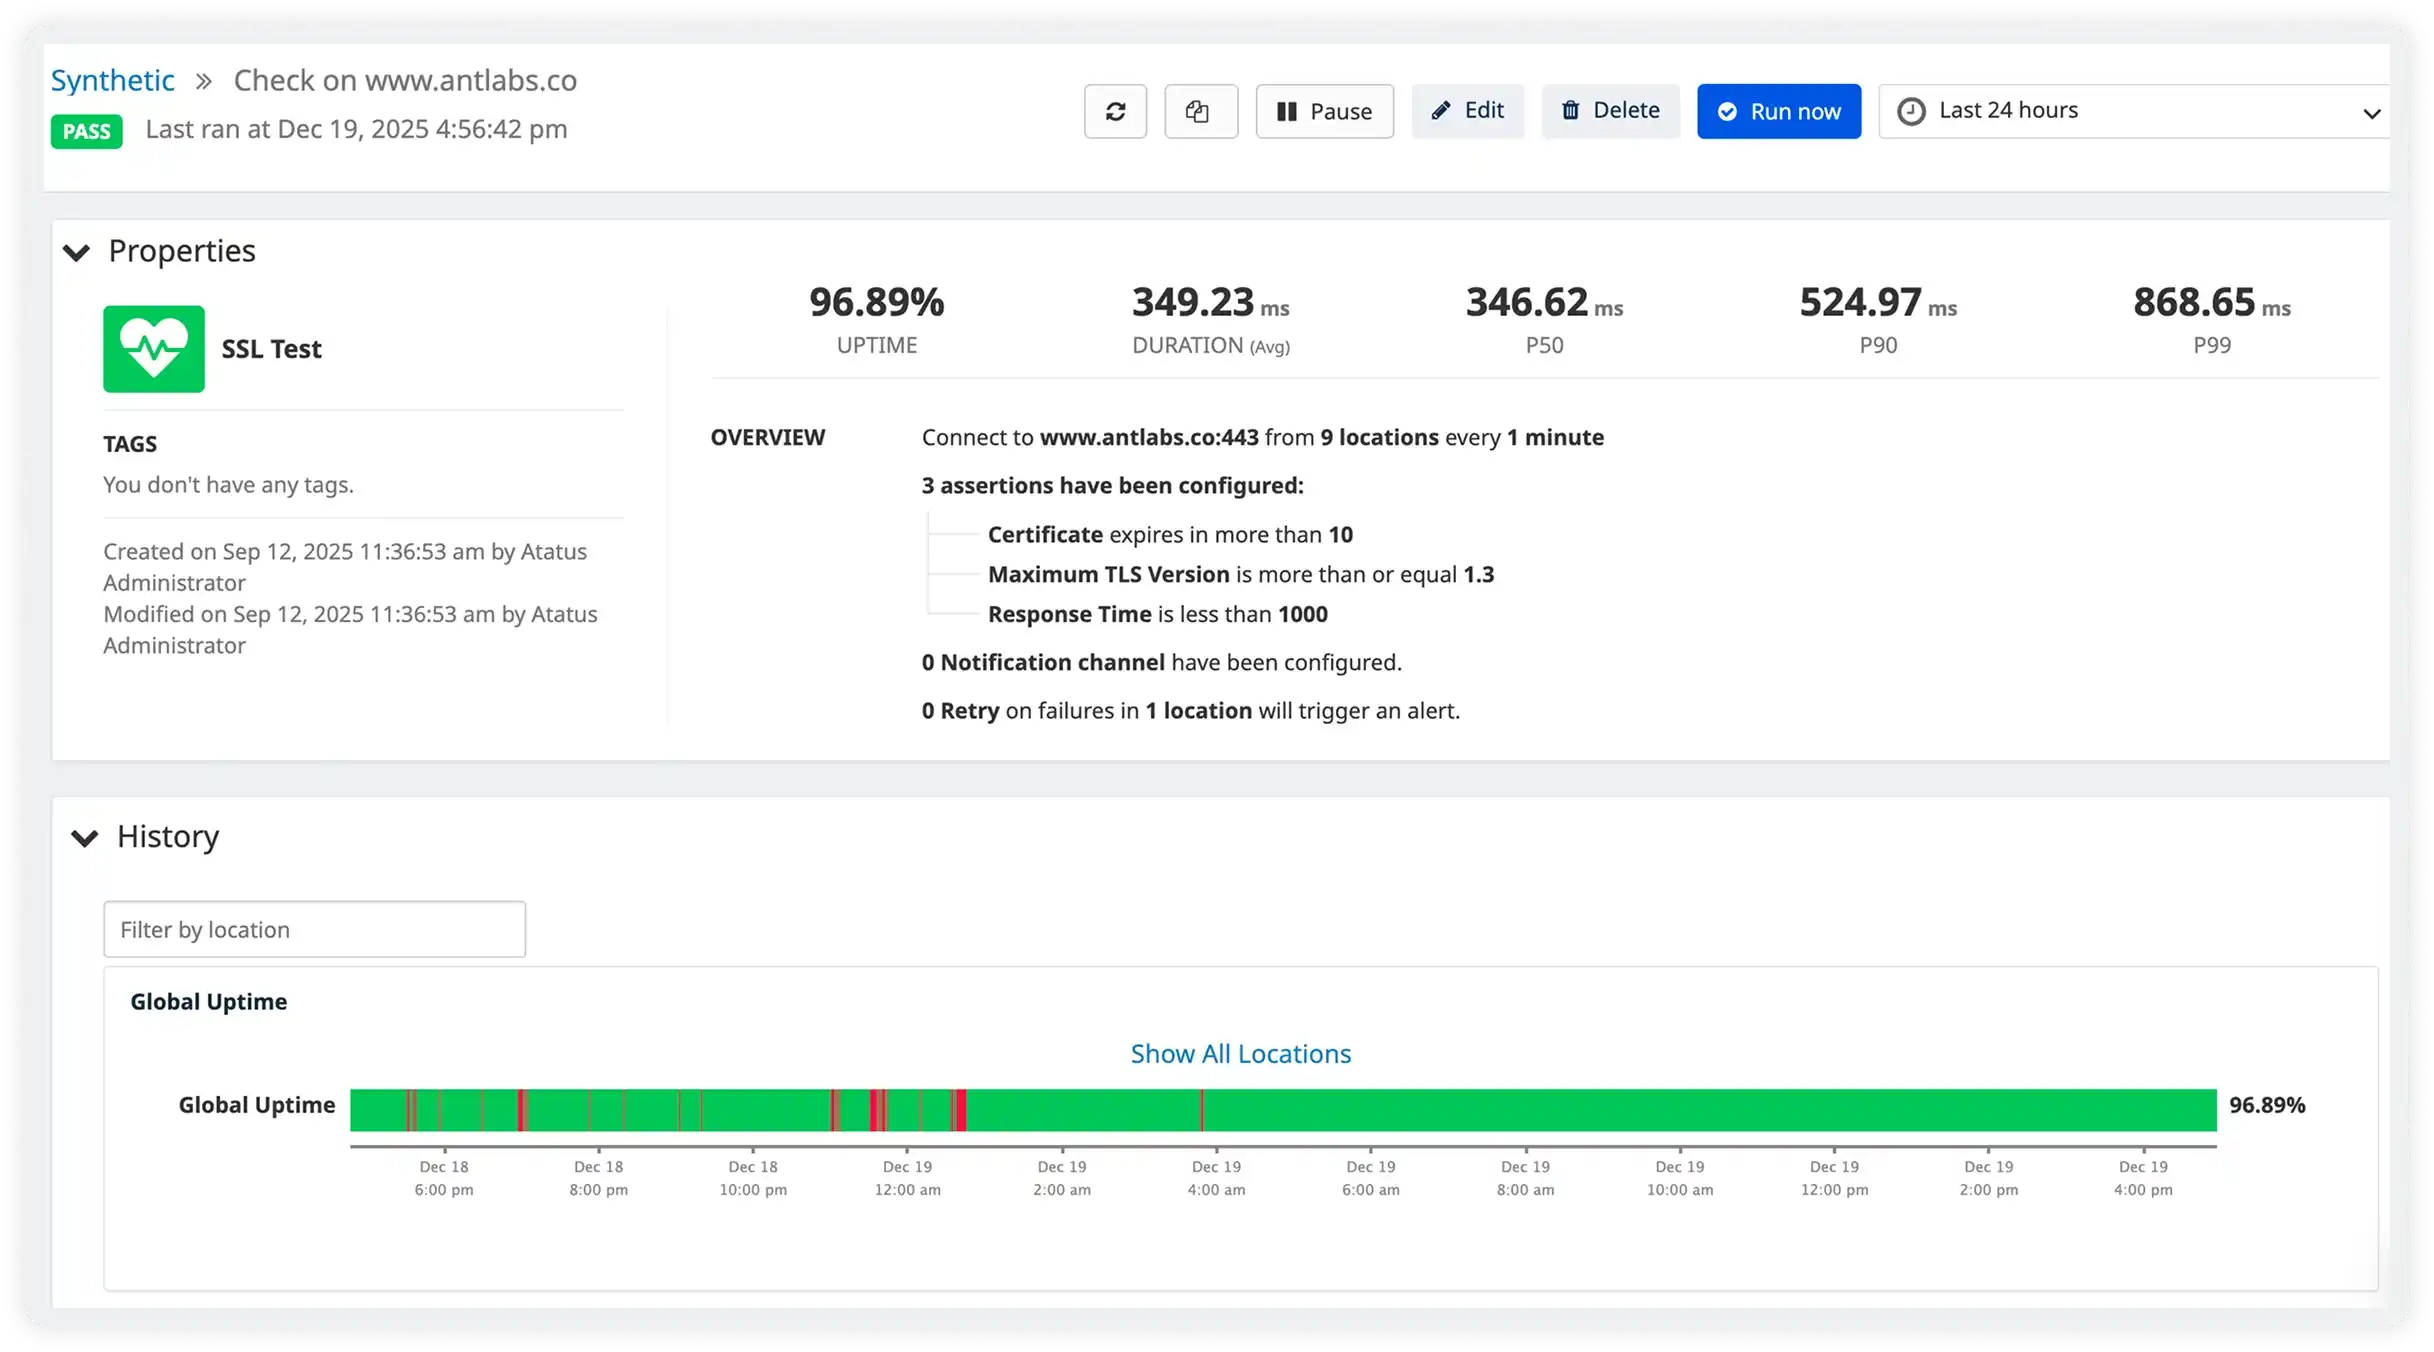
SSL Certificate Expiration
Expired SSL certificates cause browser security warnings and prevent users from accessing your site. Without monitoring, certificates expire unexpectedly, causing embarrassing outages.
"As a security engineer, our SSL certificate expired over the weekend, blocking all users until Monday when someone noticed."
Slow Response Times Undetected
Your site might be 'up' but responding so slowly that users abandon it. Without response time monitoring, gradual performance degradation goes unnoticed until it's critical.
"As a site reliability engineer, our page load times increased from 2s to 15s over a week, but we had no alerts until bounce rates skyrocketed."
DNS and Domain Configuration Issues
DNS propagation failures, expired domains, or misconfigured DNS records causing site inaccessibility for users in certain regions or networks.
"As a systems administrator, our DNS records were misconfigured after a provider migration, causing 50% of users to be unable to reach our site for hours."
Never Miss a
Downtime Again
Proactive monitoring that detects issues before your users do. Stay online, stay ahead.
24/7 Availability Monitoring
Gain full-stack observability into the quality of your network devices by constantly pinging the network hosts to detect the outages.
Multi-Location Checks
Monitor the availability of any specific ports such as HTTP, SSL, TCP and ICMP at the set frequency from different locations.
Instant Downtime Alerts
Validate request and response headers with Response Integrity Monitoring for precise, reliable data exchange.
How Atatus Uptime Monitoring Ensures 24/7 Availability
Detect downtime instantly and maintain reliability with measurable improvements in uptime
Instant Downtime Alerts
Get notified within seconds when your website, API, or service goes down. Multi-channel alerts via email, SMS, Slack, PagerDuty ensure you know about issues before your customers do.
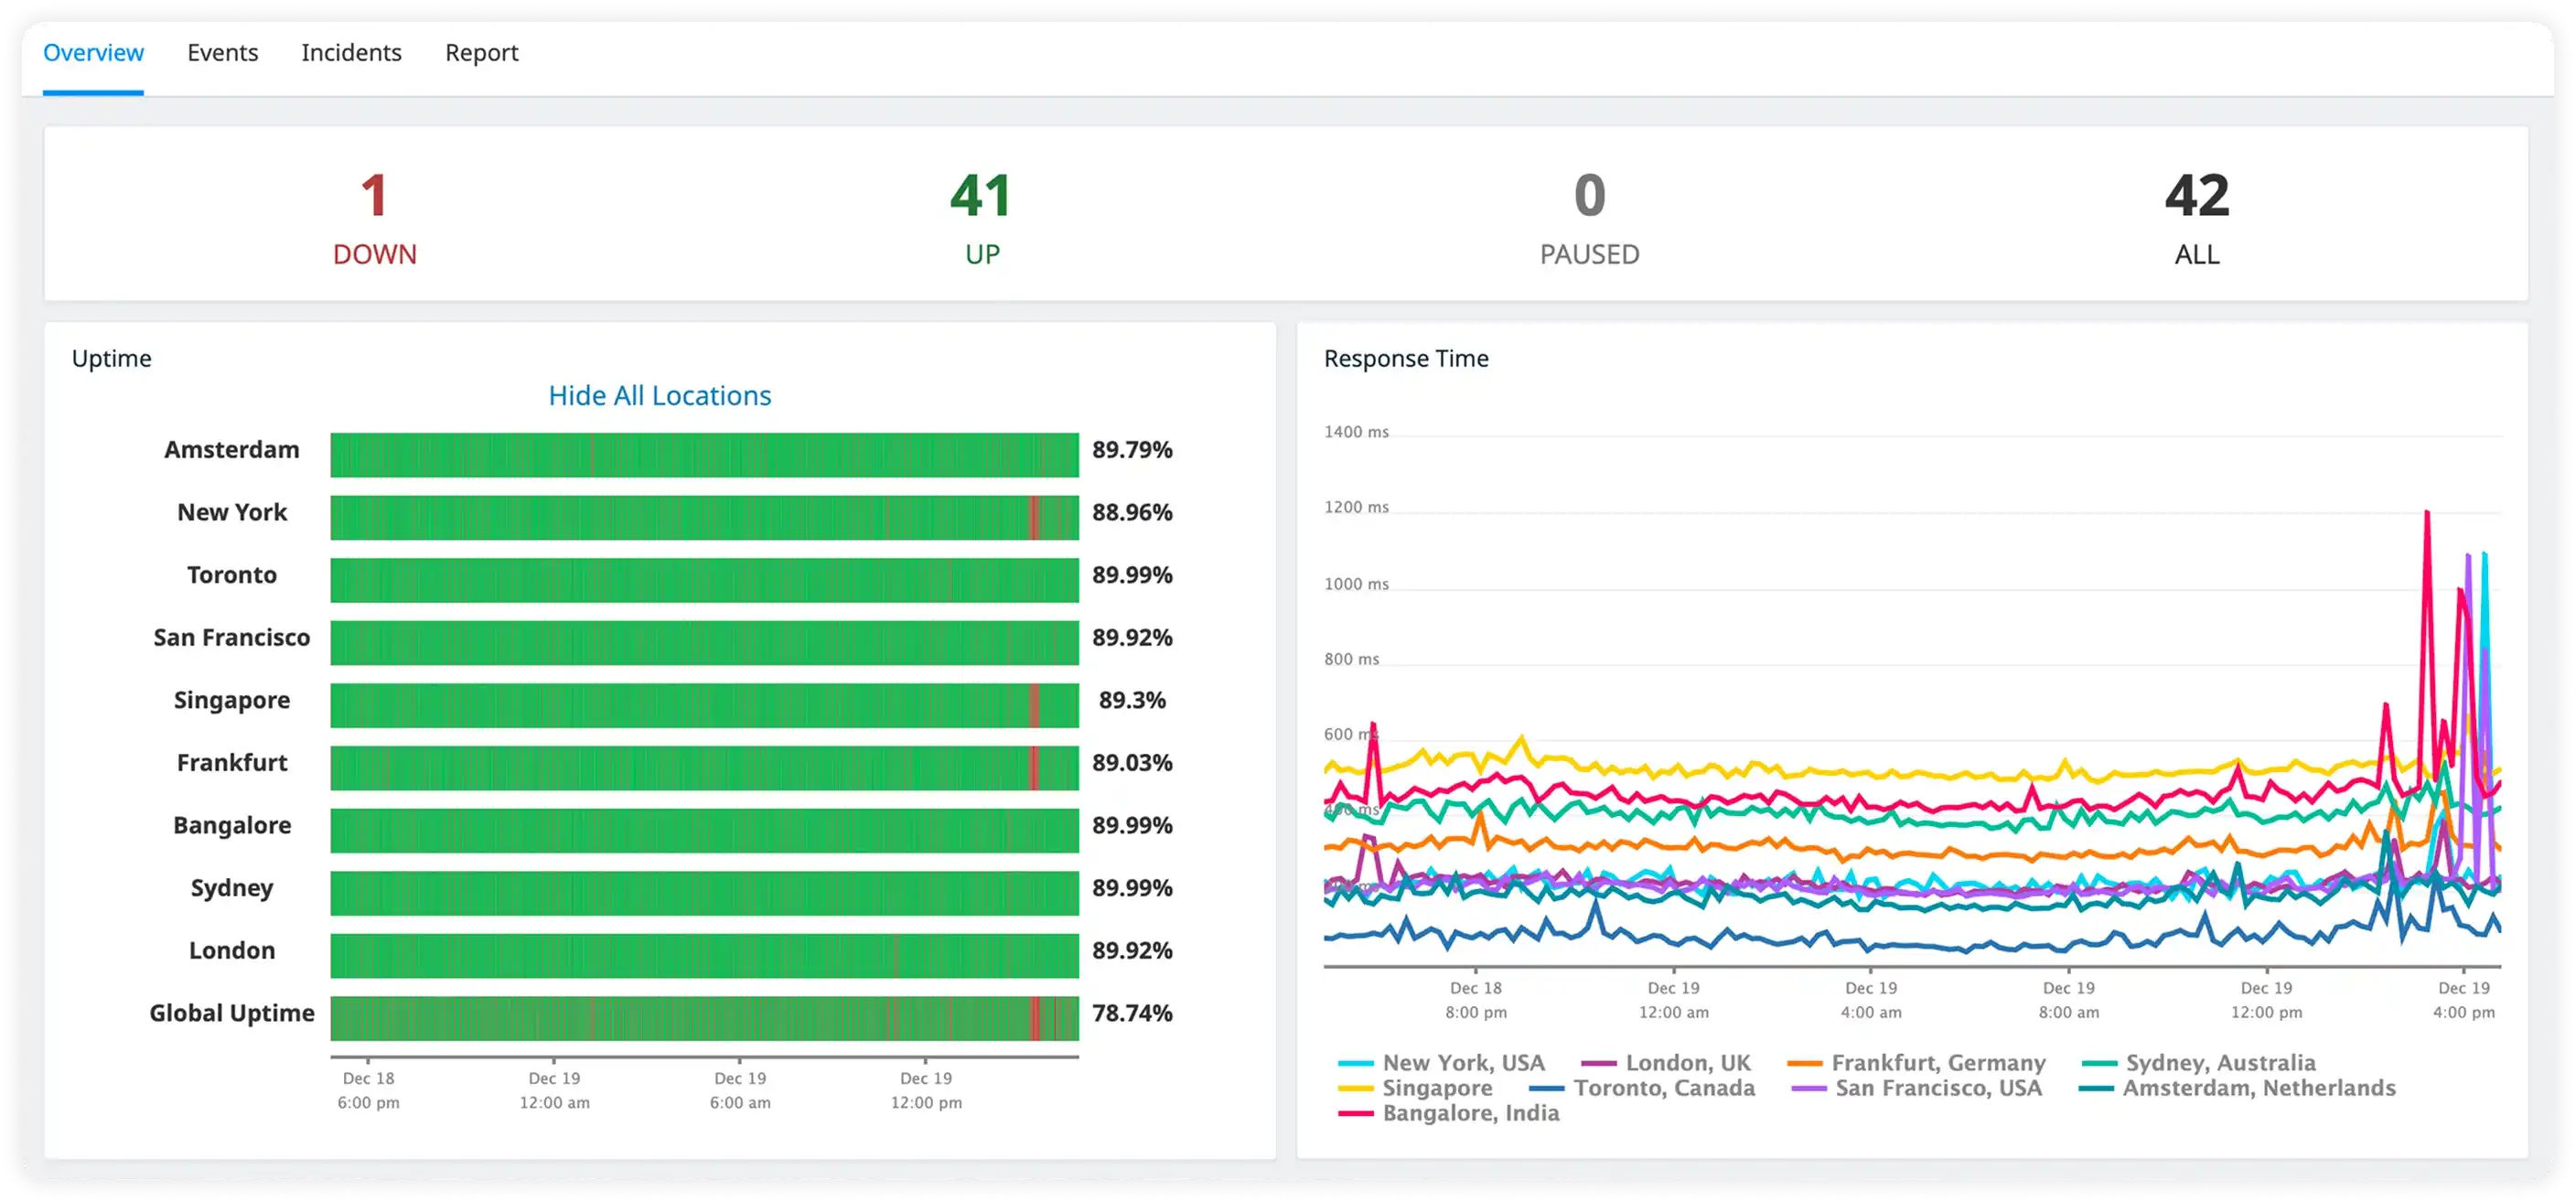
Global Availability Monitoring
Monitor from 20+ locations worldwide to ensure your application performs well globally. Detect regional outages, CDN failures, and geo-specific issues instantly.
Multi-Step Transaction Monitoring
Simulate complex user journeys like login → browse → add to cart → checkout. Ensure critical user flows work end-to-end, not just your homepage.
SSL Certificate Tracking
Automatic SSL certificate expiration monitoring with advance warnings. Never experience an unexpected certificate expiration outage again.
Performance Threshold Alerts
Set custom response time thresholds and get alerted when performance degrades. Catch slow APIs and pages before they impact user experience.
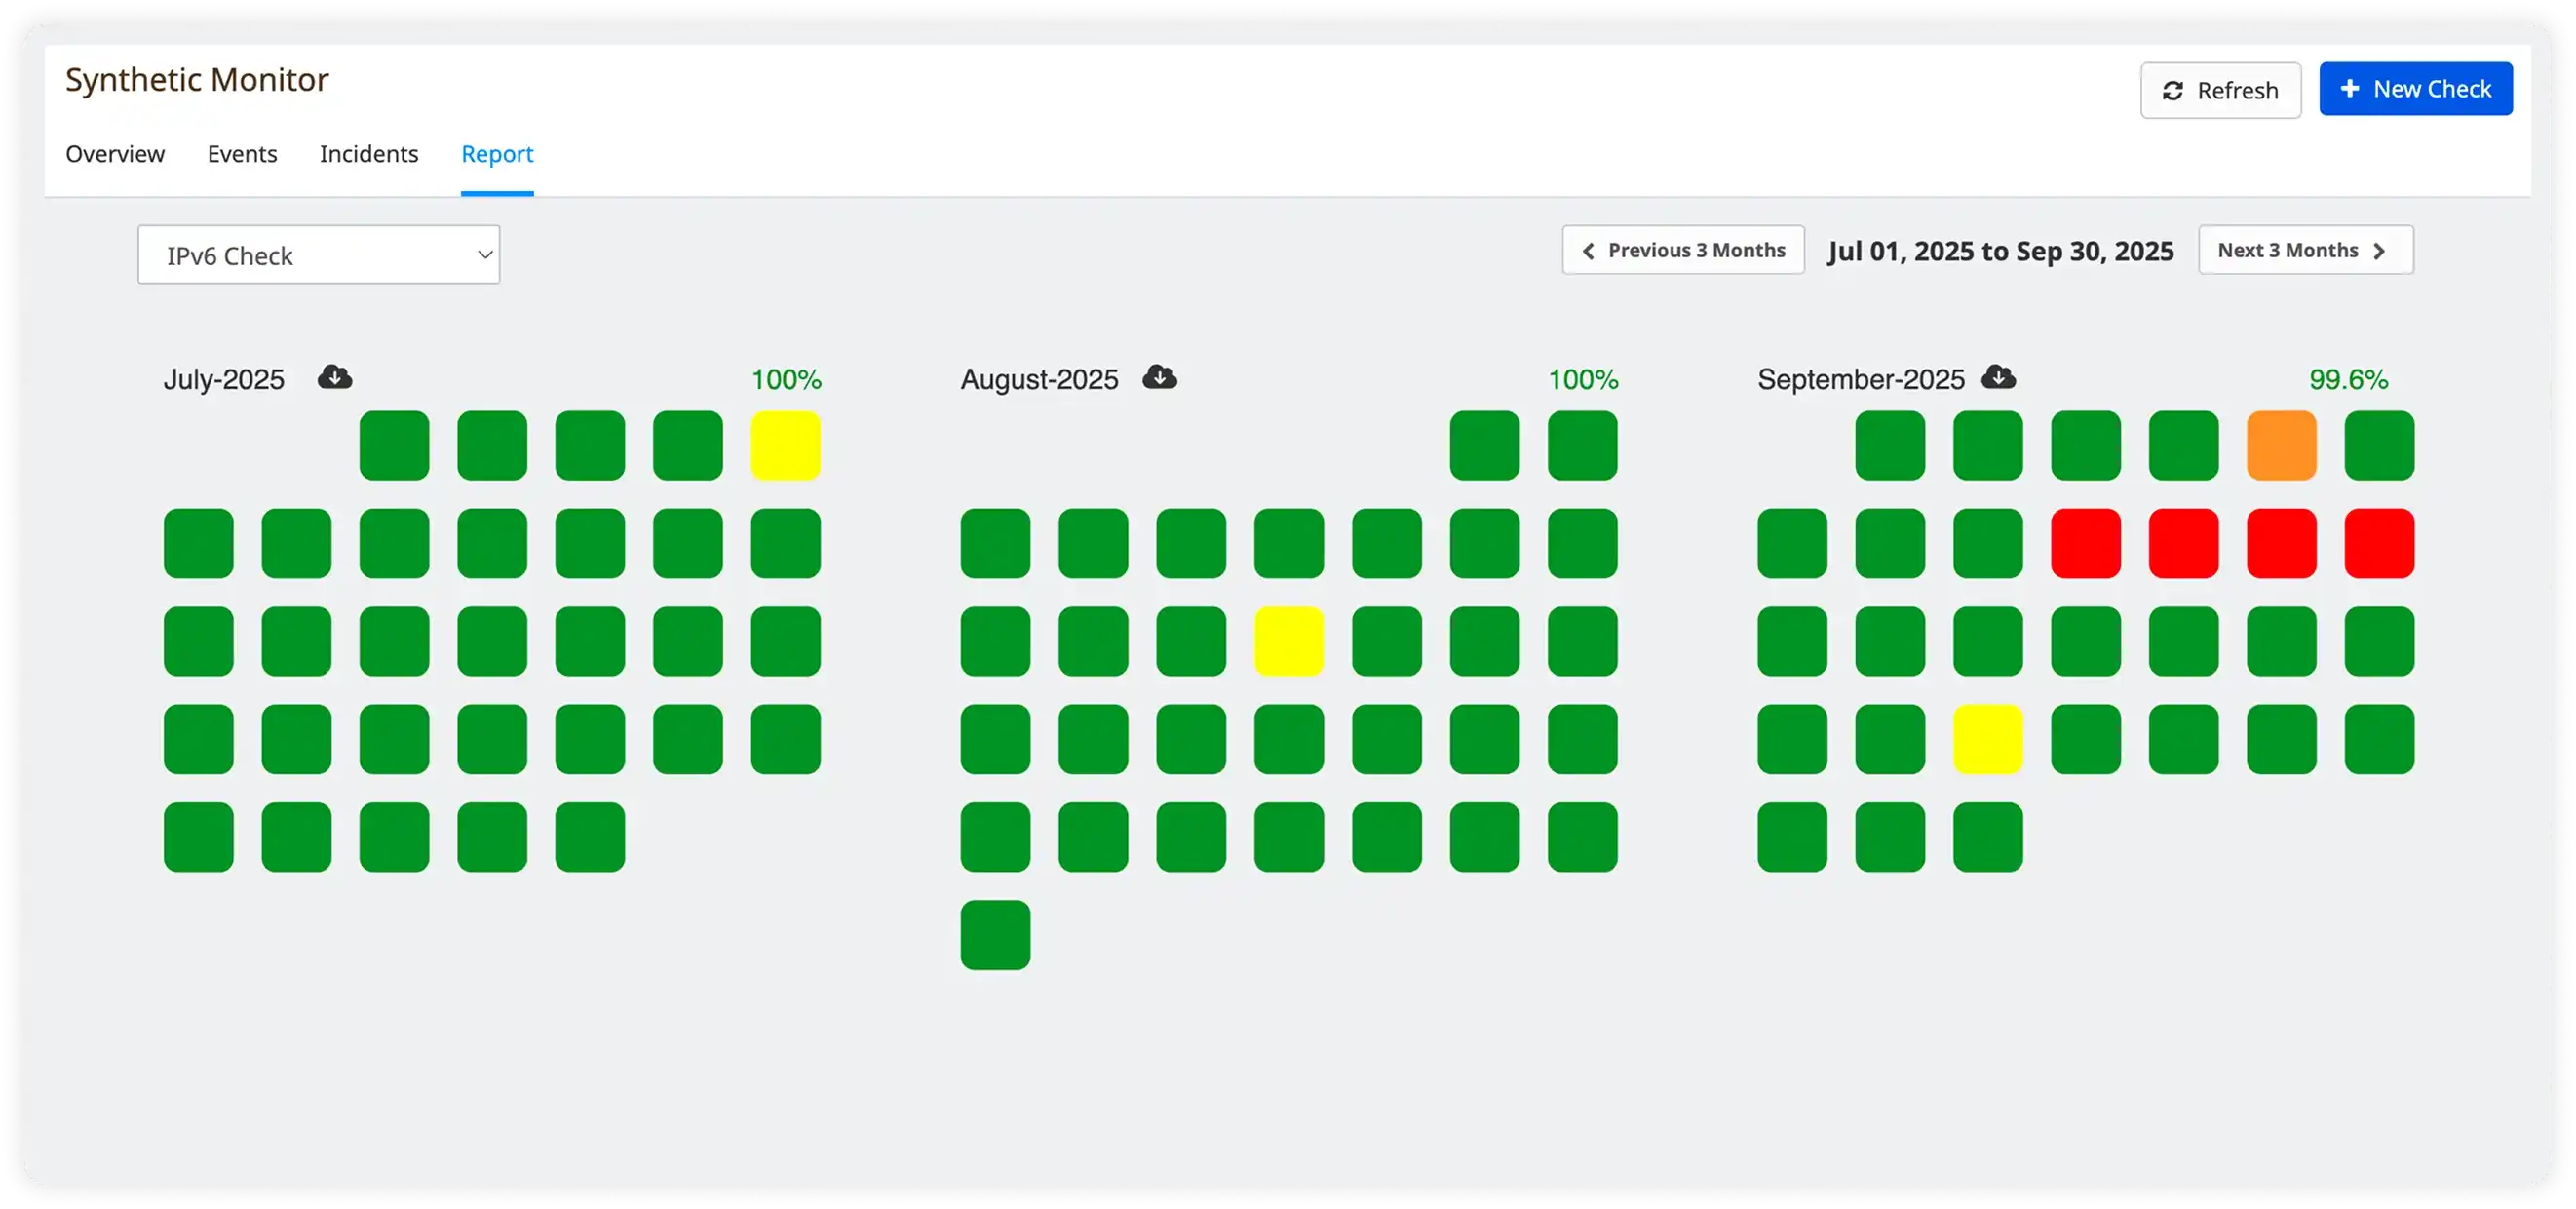
Detailed Uptime Reports
Generate uptime and performance reports for SLA compliance. Track MTTR, MTBF, and availability metrics to demonstrate reliability to stakeholders.
Everything You Need to
Stay Online 24/7
Comprehensive uptime monitoring features that help you detect and resolve issues before they impact users
Continuous Uptime Monitoring
Monitor websites and services continuously to detect outages instantly. Get clear visibility into availability so teams can respond quickly and reduce user and business impact.
Response Time and Performance Trends
Track website and API response times over time to identify slowdowns, latency spikes, and performance regressions before they affect real users.
Synthetic Browser Testing
Run synthetic browser checks to simulate real user journeys and validate page load performance, flows, and functionality beyond basic uptime monitoring.
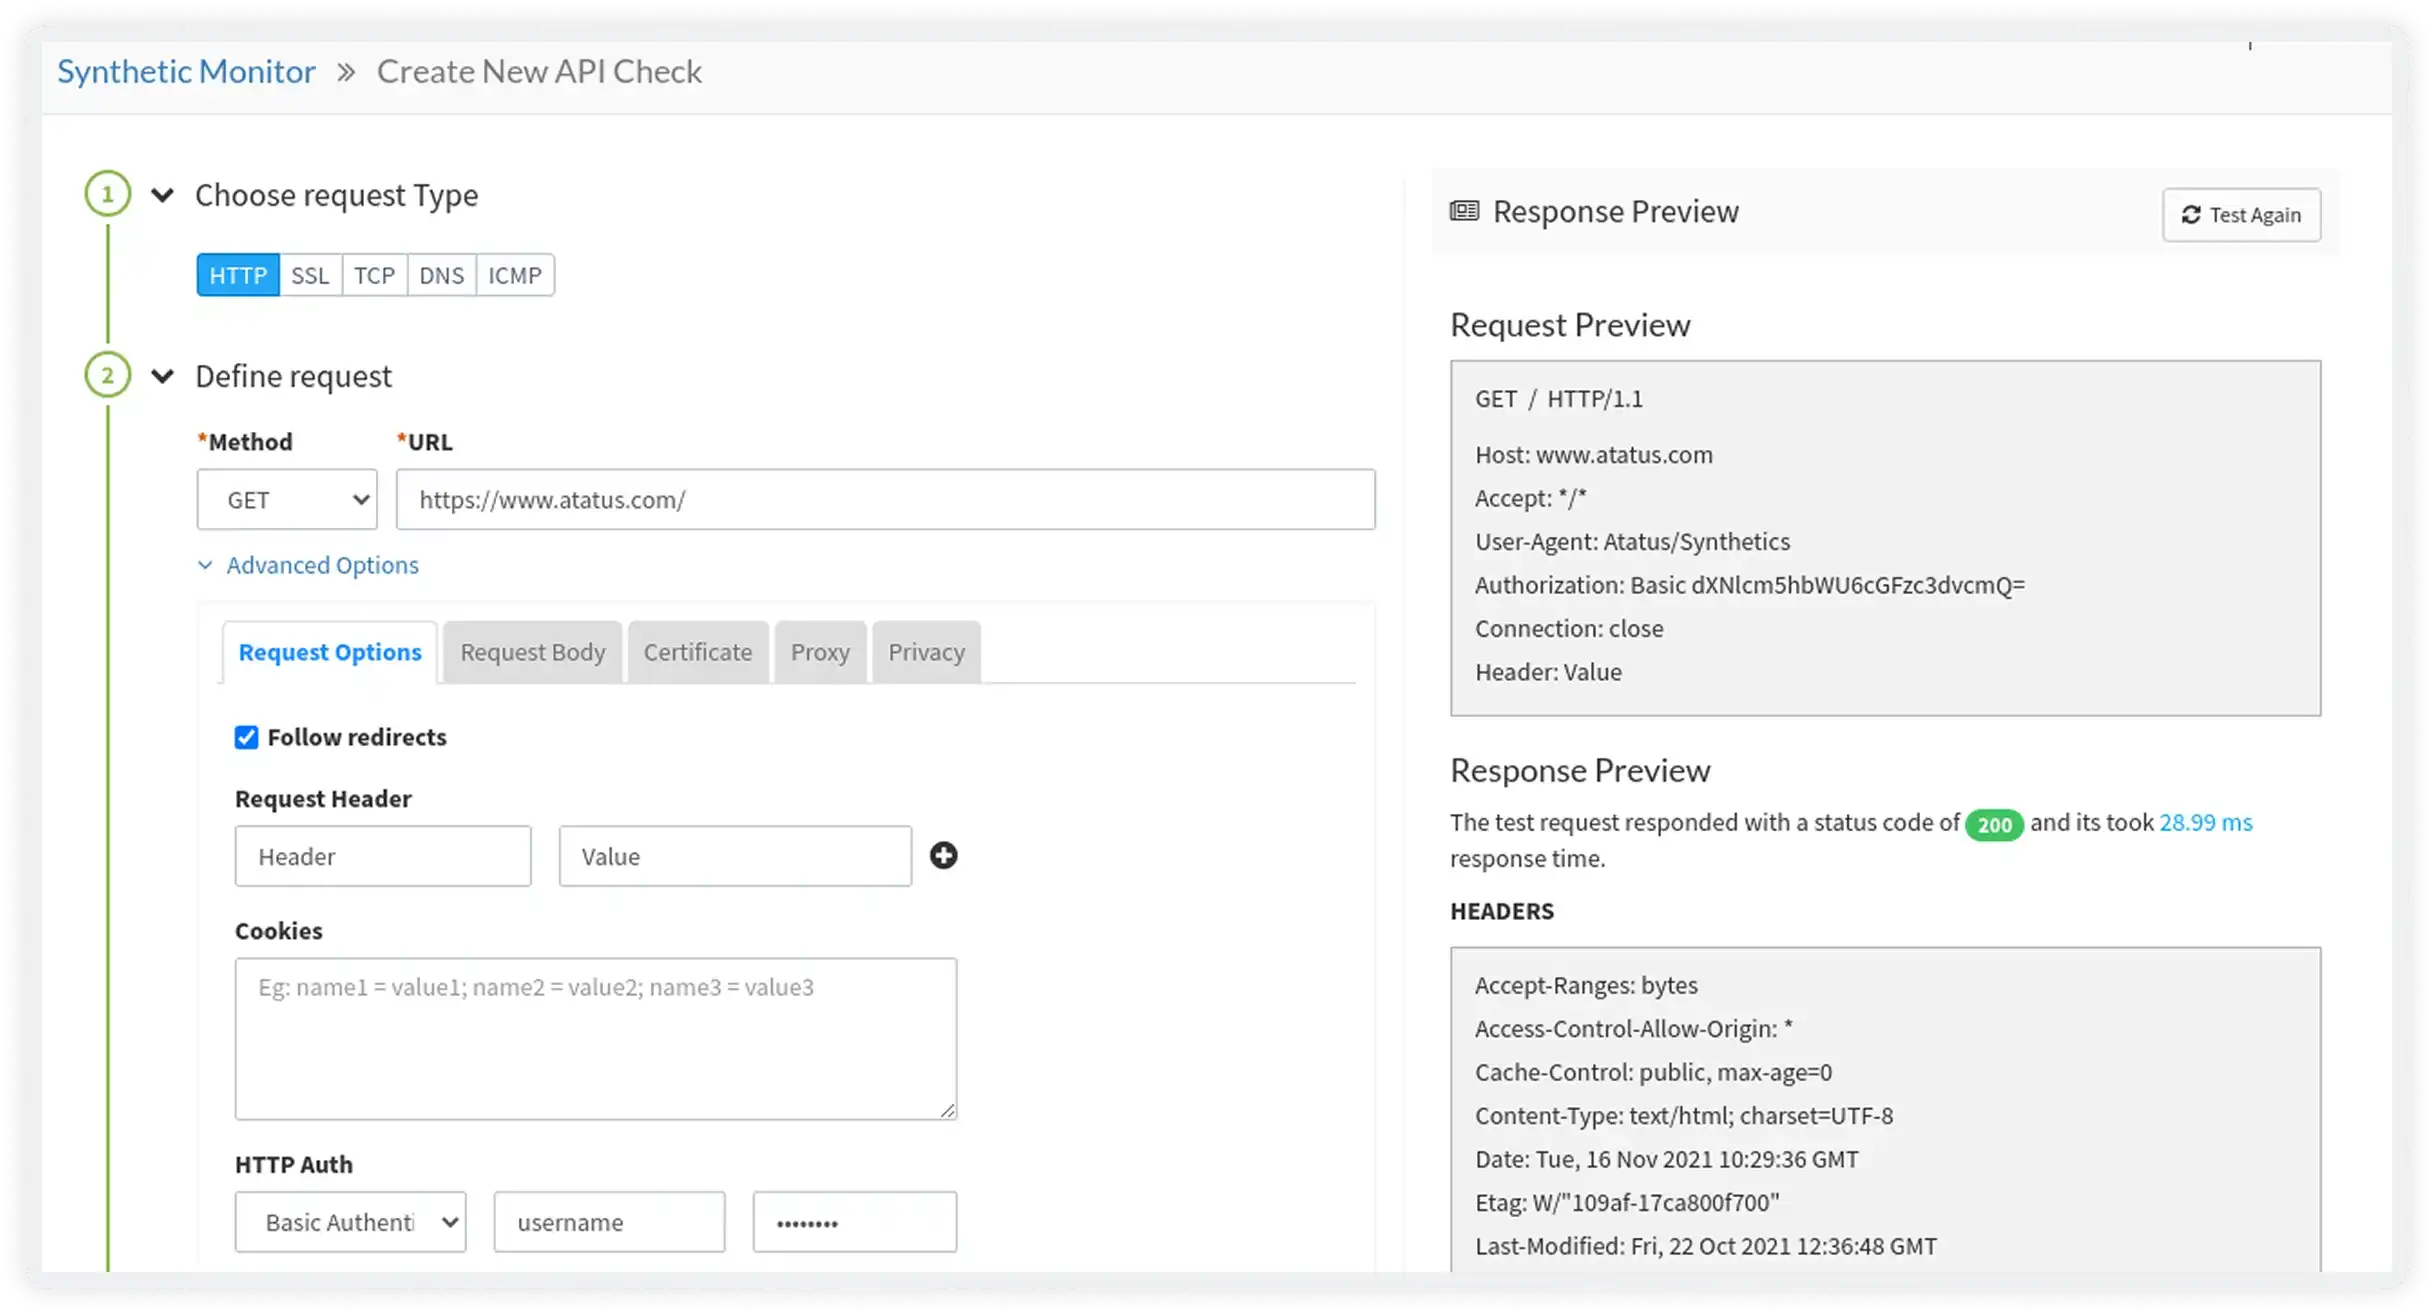
API and Multi-Step API Checks
Validate APIs with single and multi-step checks to ensure availability, correct responses, and end-to-end workflow reliability across dependent services.
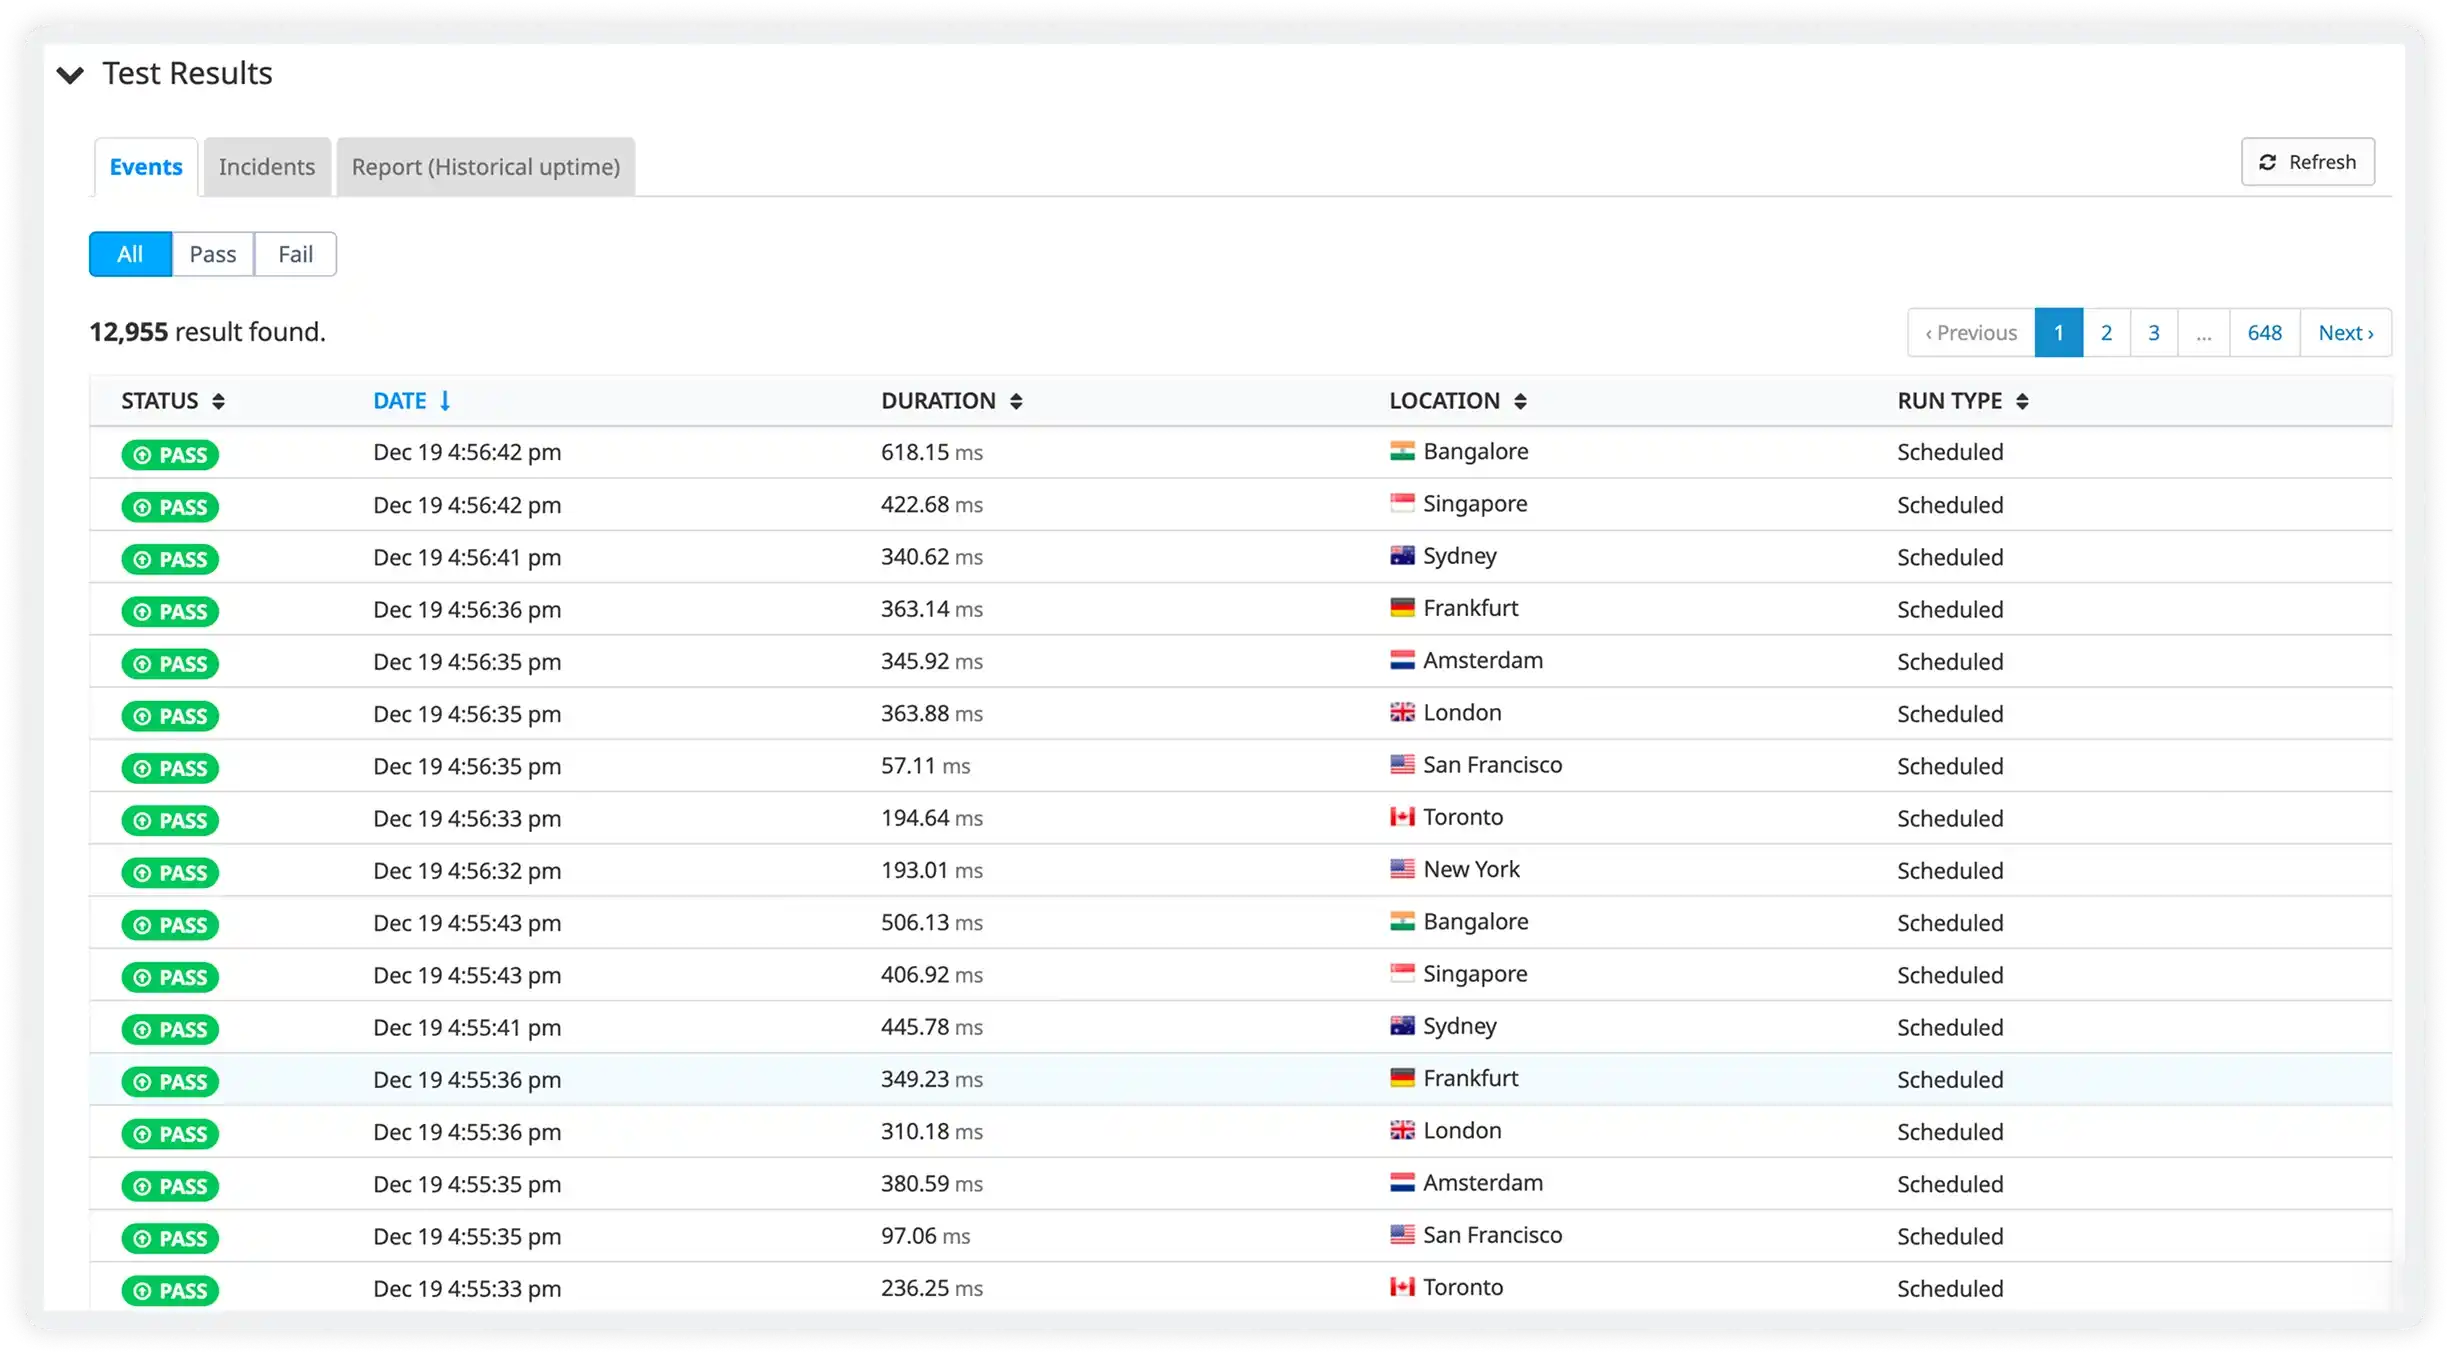
Monitoring Events, Reports, and Incident History
Track monitoring events, check results, incidents, and historical trends in one place to analyze reliability, share reports, and improve incident response over time.
Start Monitoring in Under 5 Minutes
Three simple steps to 24/7 uptime monitoring. No credit card required.
Easy Setup
Deploy and get started within minutes in seeing key site metrics for actionable insights. Just start monitoring website and solving issues now.
Configure Monitoring
Set the desired conditions and test frequency time with the options provided by Atatus to monitor your endpoints.
Get Instant Alerts
Monitor the response time of API and web pages in the all-in-one unified dashboard to ensure your site responds as expected.
Milestones that spark performance excellence
Reflections from clients who've achieved unmatched excellence through innovative strategies.
Read customer stories


