9 Stackify Competitors to Know in 2024

Stackify is a software company based in Leawood, Kansas, United States. Matt Watson, an American entrepreneur, founded it in January 2012. With a suite of tools like Prefix and Retrace, Stackify aids software developers in troubleshooting and provides support. According to Stackify, standard APM software is insufficient for managing application code. They have their own APM software, which gives developers detailed insights, checks code for errors in real-time, and analyses applications for performance issues.
Retrace is a simple SaaS application monitoring solution that integrates a number of essential features such as APM, logs, metrics, and more. It gathers a large quantity of information about the health and performance of your application. It combines all of this data in one place with an easy-to-use user interface for developers.
It consists of six integrated Modules:
- APM - Code Level Application Performance Monitoring
Retrace uses its code profiling and transaction tracing features to obtain extensive information. To give powerful reporting and alerting capabilities, all of the data is consolidated and processed. You can rapidly figure out why your application is slow or not operating properly with Retrace. - Log Aggregation, Searching, and Monitoring
You can use Retrace to consolidate all of your application and server logs into a single location. It's simple to discover anything you want in your logs due to full-text searching and support for structured logging. You may even have log searches run every few minutes and notify your team if anything is discovered. - Transaction Tracing
Retrace's ability to capture extensive performance data and transaction traces for your applications is at its core. It generates the most detailed traces by retracing what your code does in order to swiftly identify defects and performance issues. - Application Errors Tracking, Reporting, and Alerting
You can see all the logging statements that occurred in the same Web request with Retrace, as well as the whole transaction trace that was logged. It's quite satisfying to be able to move from identifying an error to fully comprehending what was going on. Exceptions are uniquely identifiable, and notifications depending on application error rates can be set up. - Server, Application, and Custom Metrics
Basic server metrics such as CPU, RAM, network, and disk performance must all be monitored. Developers can also track operations like garbage collection, request queuing, transaction volumes, page load times, and more by monitoring their applications. - Fully Integrated Alerts
Retrace can keep track of many parameters in your applications and notify you when something isn't operating properly. Instead of a flurry of e-mails, alerts are grouped by application to show all open notifications for that application in one view. Retrace offers a comprehensive set of performance monitoring tools.
Even though Stackify is a great tool for developers, there are some features that it lacks and that’s where competitors score.
In this article, we have listed Stackify’s competitors:
#1 Atatus
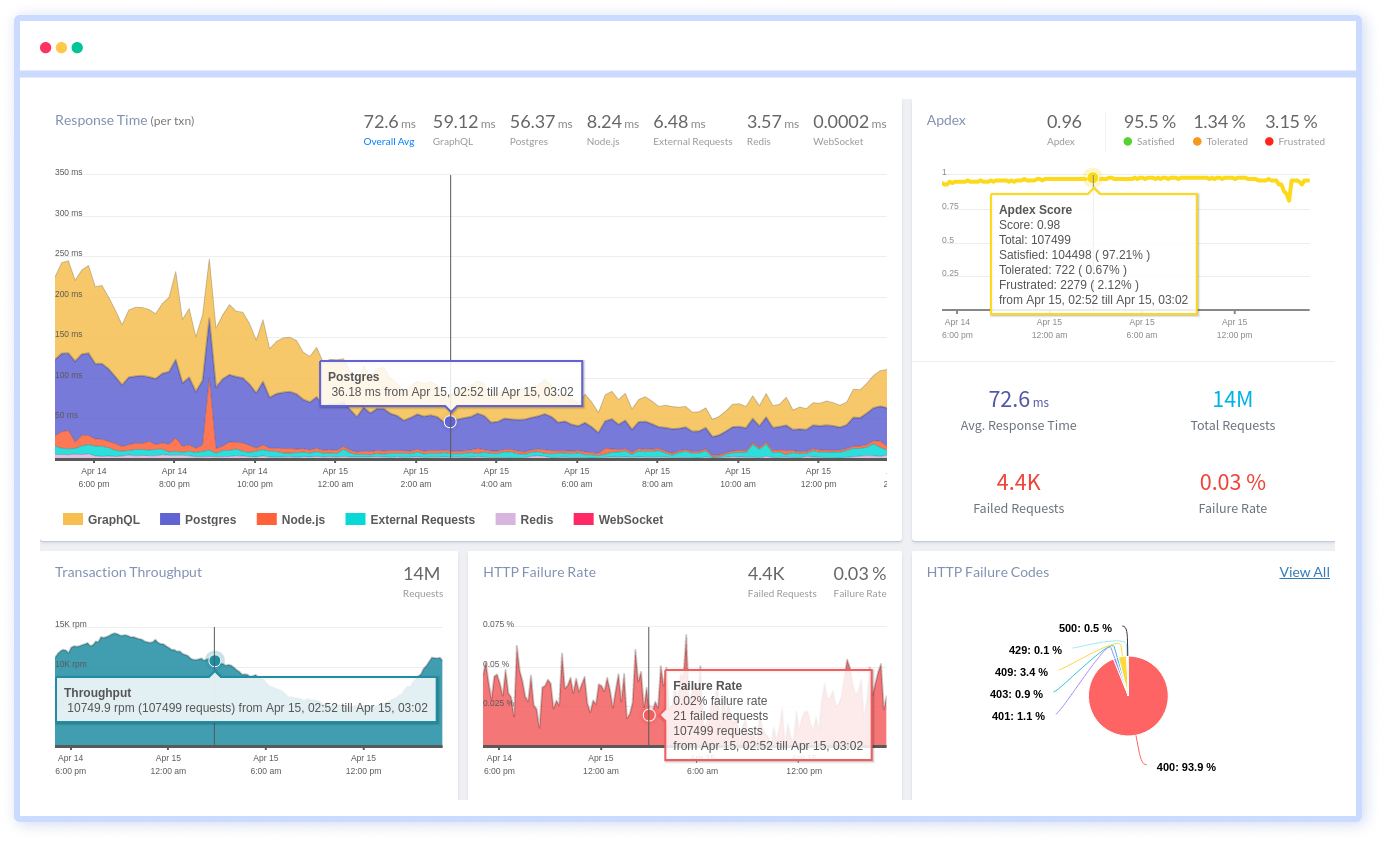
Atatus allows you to understand and learn how all of your applications' performance is tracked in real-time. You can examine the data to learn more about how your applications' front-end (Browser Monitoring), back-end (Application Performance Monitoring), and servers (Infrastructure Monitoring) fared overall.
Application Performance Monitoring (APM) by Atatus gives you a real-time view of the data you're monitoring. Performance metrics such as response time, transaction throughput, and so on can be viewed. Performance monitoring data is provided by APM, which includes chart views, APM instrumentation, and alert notification.
Atatus Browser Monitoring analyses the performance of your web applications in real-time. You'll also get data on browser metrics like page load time and JS errors for all of your assets, allowing you to figure out why a user is having performance issues and what they need to do to improve the speed of their web application. Atatus Browser tracks ajax queries, individual pages, JS failures, and session traces.
Infrastructure Monitoring from Atatus provides you with real-time information on all active hosts. It keeps track of the health of your servers and hosts, as well as the applications and services that rely on them, so you can swiftly resolve problems and release a bug-free product.
Infrastructure integrations allow you to see more information about your systems. Debian, RedHat, Mac, and MUSL are all supported by Atatus. The monitoring of your hosts and applications is connected with Atatus APM integration.
You can collect logs from your log files, servers, applications, networks, and security devices using Atatus Log Monitoring. You can easily detect a specific log message, and you can monitor several log files on many hosts.
With the new Atatus alerting system, sending messages is easier and faster. Individual alerting for Browser, Application, and Infrastructure monitoring is now accessible. Atatus also provides a variety of notification options for you to receive your alerts. The alert policy, alert rules, threshold values, alert issues, events, and occurrences will also be covered.
#2 Datadog
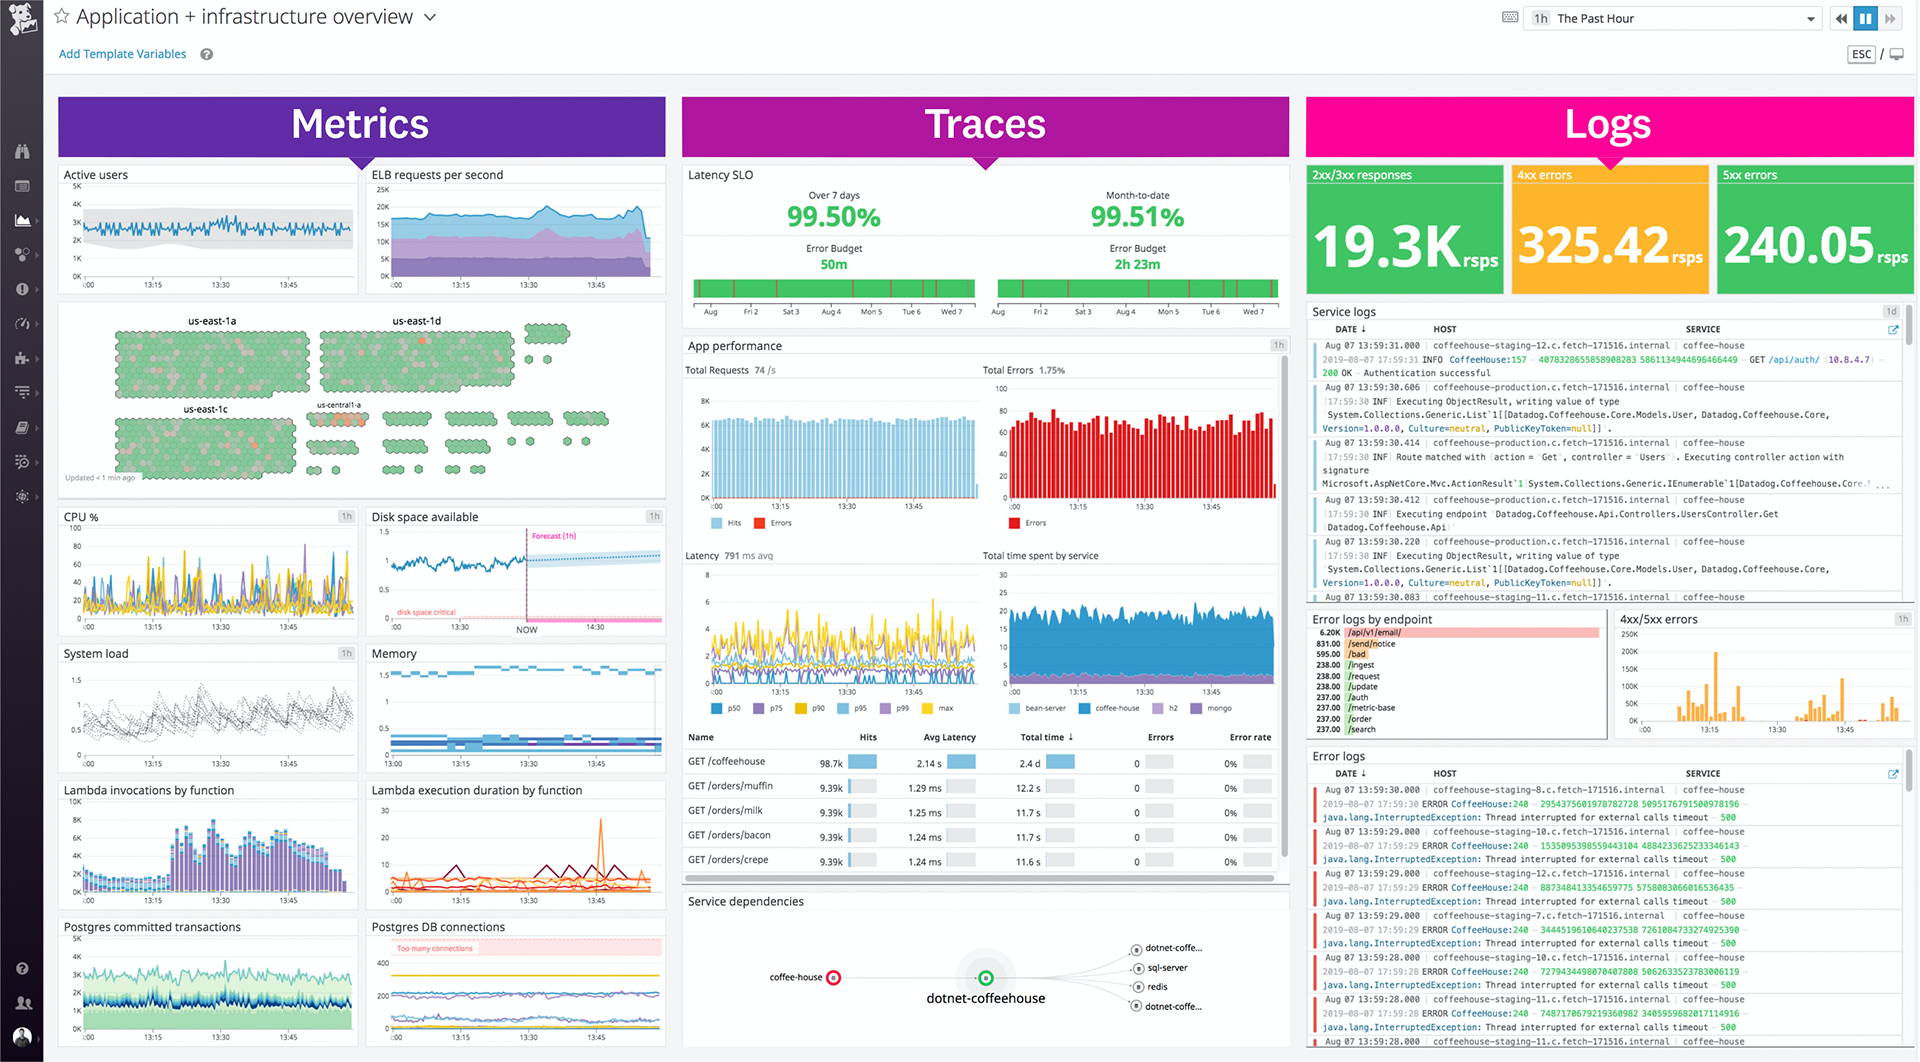
Datadog is a cloud-scale application observability solution that monitors servers, databases, tools, and services using a SaaS-based data analytics platform. With excellent performance dashboards for web services, queues, and databases, Datadog APM & Continuous Profiler delivers extensive visibility into your applications by monitoring requests, errors, and latency.
By isolating log ingestion from indexing, Datadog Log Management, often known as logs, eliminates these constraints. This allows you to collect, analyse, archive, explore, and monitor all of your logs for a low cost, with no log restrictions. It also drives Datadog's Security Monitoring, which detects security vulnerabilities in your environment without requiring you to index your logs.
Real User Monitoring (RUM) from Datadog gives you end-to-end visibility into individual users' behaviour and experience in real-time. Performance, error management, use, and support are four types of use cases for web and mobile applications that RUM is aimed to address.
Synthetic testing lets you test the performance of your systems and applications by simulating requests and actions from all over the world. From the backend to the frontend, and at multiple network levels, Datadog monitors the performance of your webpages and APIs in a regulated and trustworthy manner, alerting you if anything goes wrong.
Without the capacity to detect crucial changes, monitoring all of your infrastructure in one place would be incomplete. Datadog lets you set up real-time monitors for metrics, integration availability, network endpoints, and other things. On the Alerting platform, you can configure monitors, notify your teams, and manage alerts at a glance.
#3 New Relic
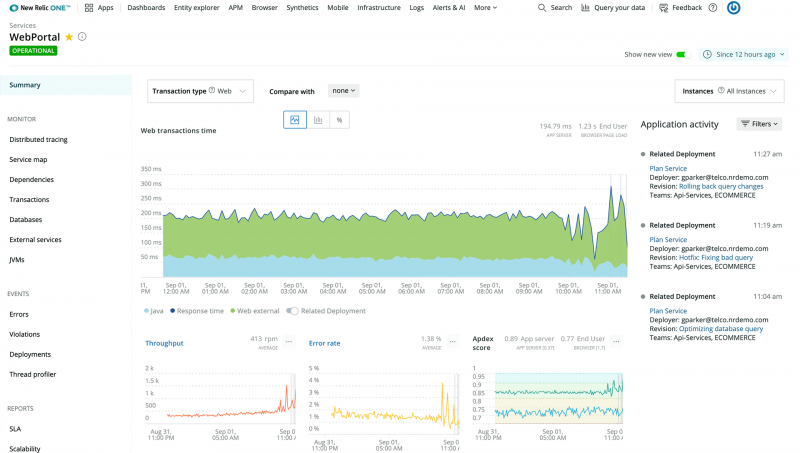
New Relic is a software observability platform that helps to improve software development. It is a technology company situated in San Francisco, California that creates cloud-based software to assist website and application owners in tracking the performance of their services.
New Relic's Telemetry Data Platform unifies all of your operational data into a single source of truth, allowing you to ask and answer any question. With the most powerful, managed, open, and unified telemetry platform, you can collect, explore, and alert on all your metrics, events, logs, and traces from any source.
The cost and complexities of hosting, operating, and managing extra monitoring systems or data repositories are eliminated with automatic integrations for open-source solutions. You can investigate your unknowns now that you have all of your telemetry data in one location.
New Relic helps you cut through the layers of complexity that surround your systems by bringing data from any instrumented source and environment together and connecting it without having to switch tools. The customized Full-Stack Observability experiences allow you to see, evaluate, and debug your whole software stack in one place.
The New Relic Explorer brings together all of the entities in your system, as well as how they're connected, in one location, allowing you to quickly see performance issues and patterns. You can cut through the noise to locate the signal by automatically correlating infrastructure health with application performance and end-user behaviour.
Alerts allow you to create powerful and configurable alert policies for anything you can track. As data floods in from all of their products, including APM, infrastructure, browser, mobile, and NRQL queries, receive notifications for changes in critical performance measures.
Their AIOps solution for DevOps, site reliability engineers, and on-call teams is called Applied Intelligence (AI). It speeds up the process of locating, troubleshooting, and resolving issues. It's a hybrid machine learning engine that lowers alert noise, correlates incidents, and discovers anomalies automatically. Applied Intelligence is designed to improve functionality and give wiser context over time by applying machine learning to your data and feedback.
#4 LogicMonitor
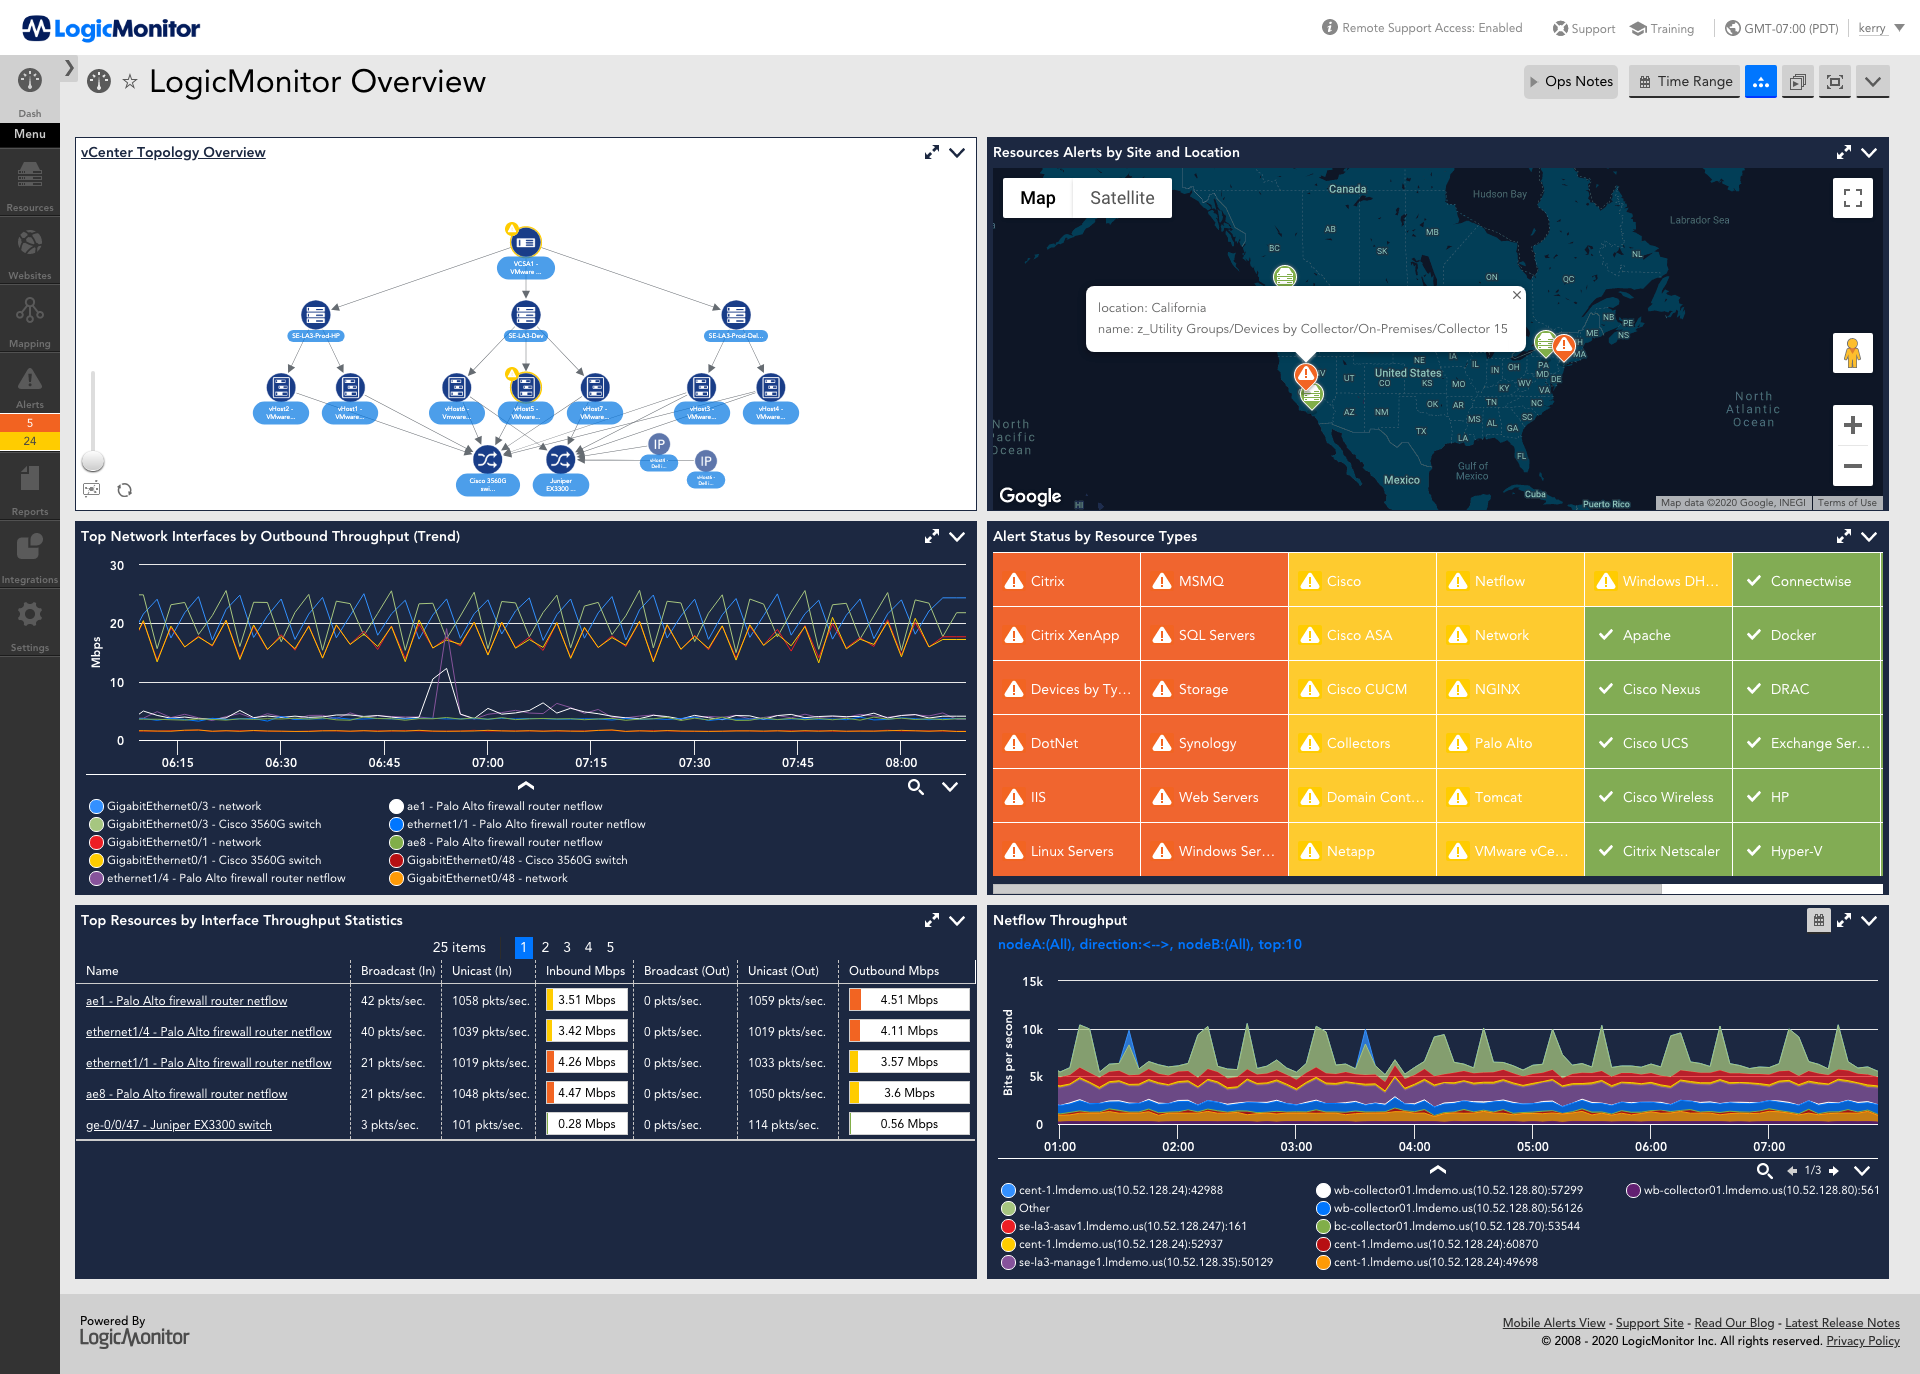
For enterprise IT and managed service providers, LogicMonitor offers SaaS-based data center monitoring tools that are fully automated, cloud-based infrastructure monitoring, and observability platform. IT Ops teams can manage today's sophisticated on-premise, hybrid, and cloud IT infrastructures with LogicMonitor's automated SaaS performance monitoring platform, which gives end-to-end visibility and actionable information.
With Auto-Discovery of Devices, it can deploy and manage your monitoring more quickly and automatically. Use built-in and customizable dashboards, performance predictions, and complete reporting to act on infrastructure performance data. To increase IT team responsiveness, it uses built-in workflow capabilities such as alerting routing and escalation management.
Distributed Tracing from LogicMonitor is an OpenTelemetry-based interface that allows you to transfer trace data from instrumented applications and monitor end-to-end requests as they transit across your environment's distributed services. These traces are displayed alongside relevant metrics and contextual logs on the Traces page. Having access to all of an application's metrics, traces, and logs in one place can help you rapidly understand what's going on, why it's going on, and where it's going on, allowing you to troubleshoot faster and improve the application performance.
LogicMonitor Logs uses an algorithmic root-cause analysis approach to provide a unique and unified approach to log analysis. It examines log events to find normal patterns and departures from these patterns, which it refers to as anomalies. To aid inquiry, these log anomaly occurrences are shown on a Logs page alongside metric Alerts and Topology information.
Advanced machine learning algorithms are used by LogicMonitor to construct predicted data patterns for data points so that it can spot data that deviate from these patterns. This opens up even another window into resource behaviour, potentially helping users to spot problems before they become more serious.
There are filtered Alerts pages available from the detail pages of your various devices, cloud resources, instances, websites, services, and groups, as well as an overall Alerts page available from the left-hand main menu that displays all alerts across your whole LogicMonitor account.
#5 Dynatrace
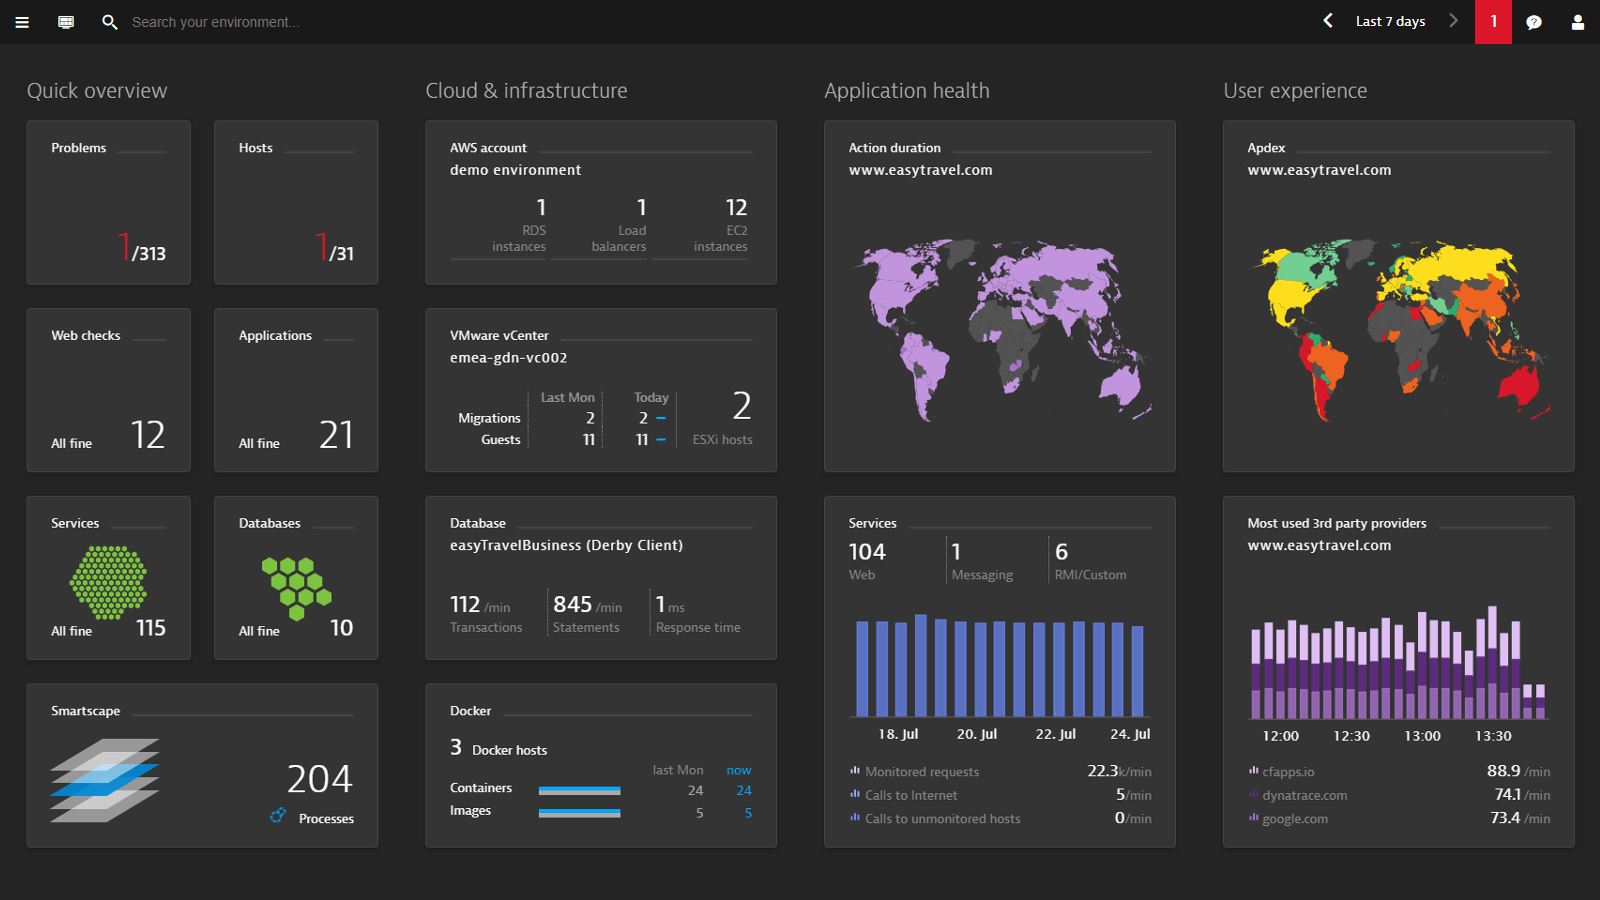
Dynatrace is a software intelligence platform based on artificial intelligence (AI) and automation to businesses and government agencies around the world to monitor and optimize application performance, development and security, IT infrastructure, and user experience.
The Dynatrace Software Intelligence Platform discovers, maps, and monitors applications, microservices, container orchestration platforms like Kubernetes, and IT infrastructure running in multi-cloud and hybrid-cloud environments, as well as providing automated problem remediation, using a proprietary form of AI called Davis. The Dynatrace platform enables observability of the entire solution stack, which reduces cloud complexity and accelerates digital transformation and cloud migration for enterprises, as well as hyper scales to meet demand.
Dynatrace's Real User Monitoring (RUM) analyses all user interactions with your applications, whether they happen in a browser or on a mobile device. Application availability monitoring, verification of correct UI element presentation, third-party content provider performance analysis, backend service performance analysis, and performance analysis of any underlying infrastructure are all possible with Real User Monitoring. It is also supported for mobile applications.
Web services, web containers, database requests, and custom services are some of the server-side services available. The OneAgent from Dynatrace can show which applications or services communicate with which other applications or services, as well as which services or databases a particular service calls.
Dynatrace allows you to monitor all aspects of your infrastructure, including your hosts, processes, and network. You can observe data such as the total traffic on your network, the CPU consumption of your hosts, the reaction time of your processes, and more by performing log monitoring. Dynatrace also gives extensive topological information, such as which processes are running on which servers and how your processes are linked.
Your whole stack, including private, public, and hybrid cloud environments, is monitored by Dynatrace OneAgent. It works smoothly with current Docker environments and monitors your containerized applications and services automatically.
Davis, a major feature of Dynatrace's AI-driven causation engine, uses artificial intelligence to continuously monitor every part of your applications, services, and infrastructure to understand the baseline performance metrics and dependencies of all of these components.
#6 AppDynamics
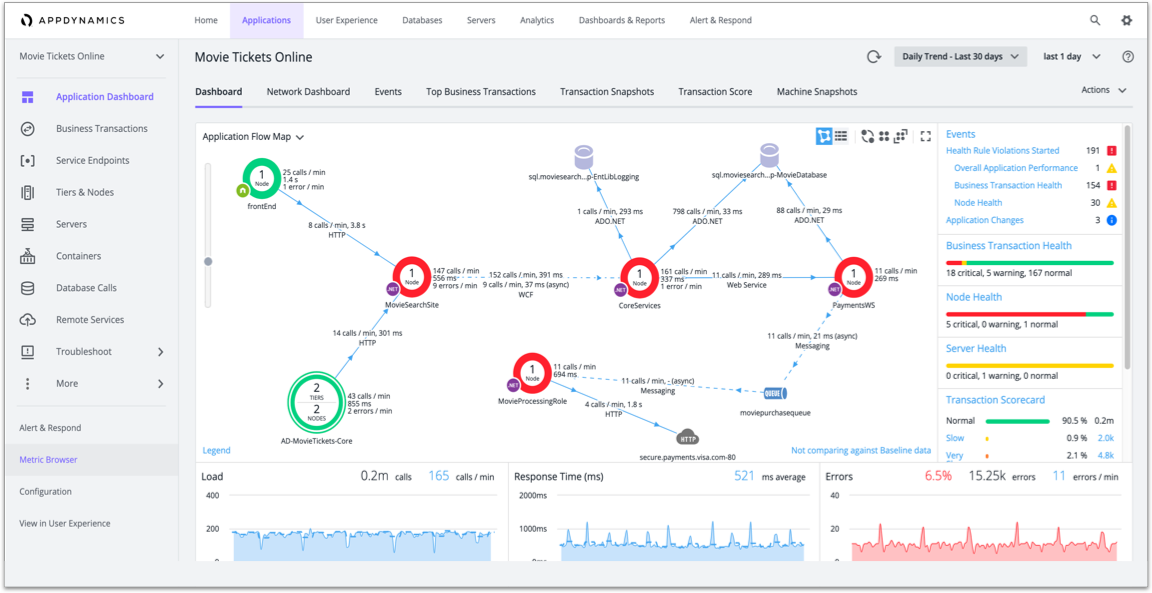
AppDynamics is a cloud-based APM solution and IT operations analytics for worldwide users which is located in San Francisco. The company specializes in controlling application performance and availability in cloud computing environments as well as data centres.
From mobile/browser client network requests to backend databases/servers and everything in between, AppDynamics APM allows you to control and monitor your whole application delivery environment. It gives you a bird's-eye view of your application landscape and lets you easily traverse around the distributed application to call graphs and exception reports created on particular servers. It uses an AppDynamics App Server Agent to provide a view of your code's runtime operation.
Database Visibility from AppDynamics provides details on calls to backend databases, including failures and call counts. An agent-less profile gives you more insight into the workings of the database server by providing information on query execution and performance. Their Infrastructure Visibility adds to your data center picture by offering useful information on machine and network performance.
AppDynamics' End-User Monitoring collects data on where your requests are coming from, what devices/channels your users are using, and the performance of your code once it's delivered on their devices. It also gives you the visibility to examine mobile crashes by showing stack traces and other contextual data from the moment the problem occurred, as well as connecting it to the server's Business Transaction data.
Business iQ allows you to see how transactional business data affects the performance of your application environment and end-user applications. It allows you to sort, order, and comprehend the information that makes up Business Transactions.
To help you detect and fix problems with your infrastructure, AppDynamics comes with pre-configured application infrastructure metrics and default health rules. Additional persistent metrics can be configured to establish a monitoring approach according to your business objectives and application architecture.
AppDynamics can send notifications or perform actions in response to circumstances or events that you specify. You can detect problems as they occur, or even before they occur, by using the alert and response option.
#7 Raygun
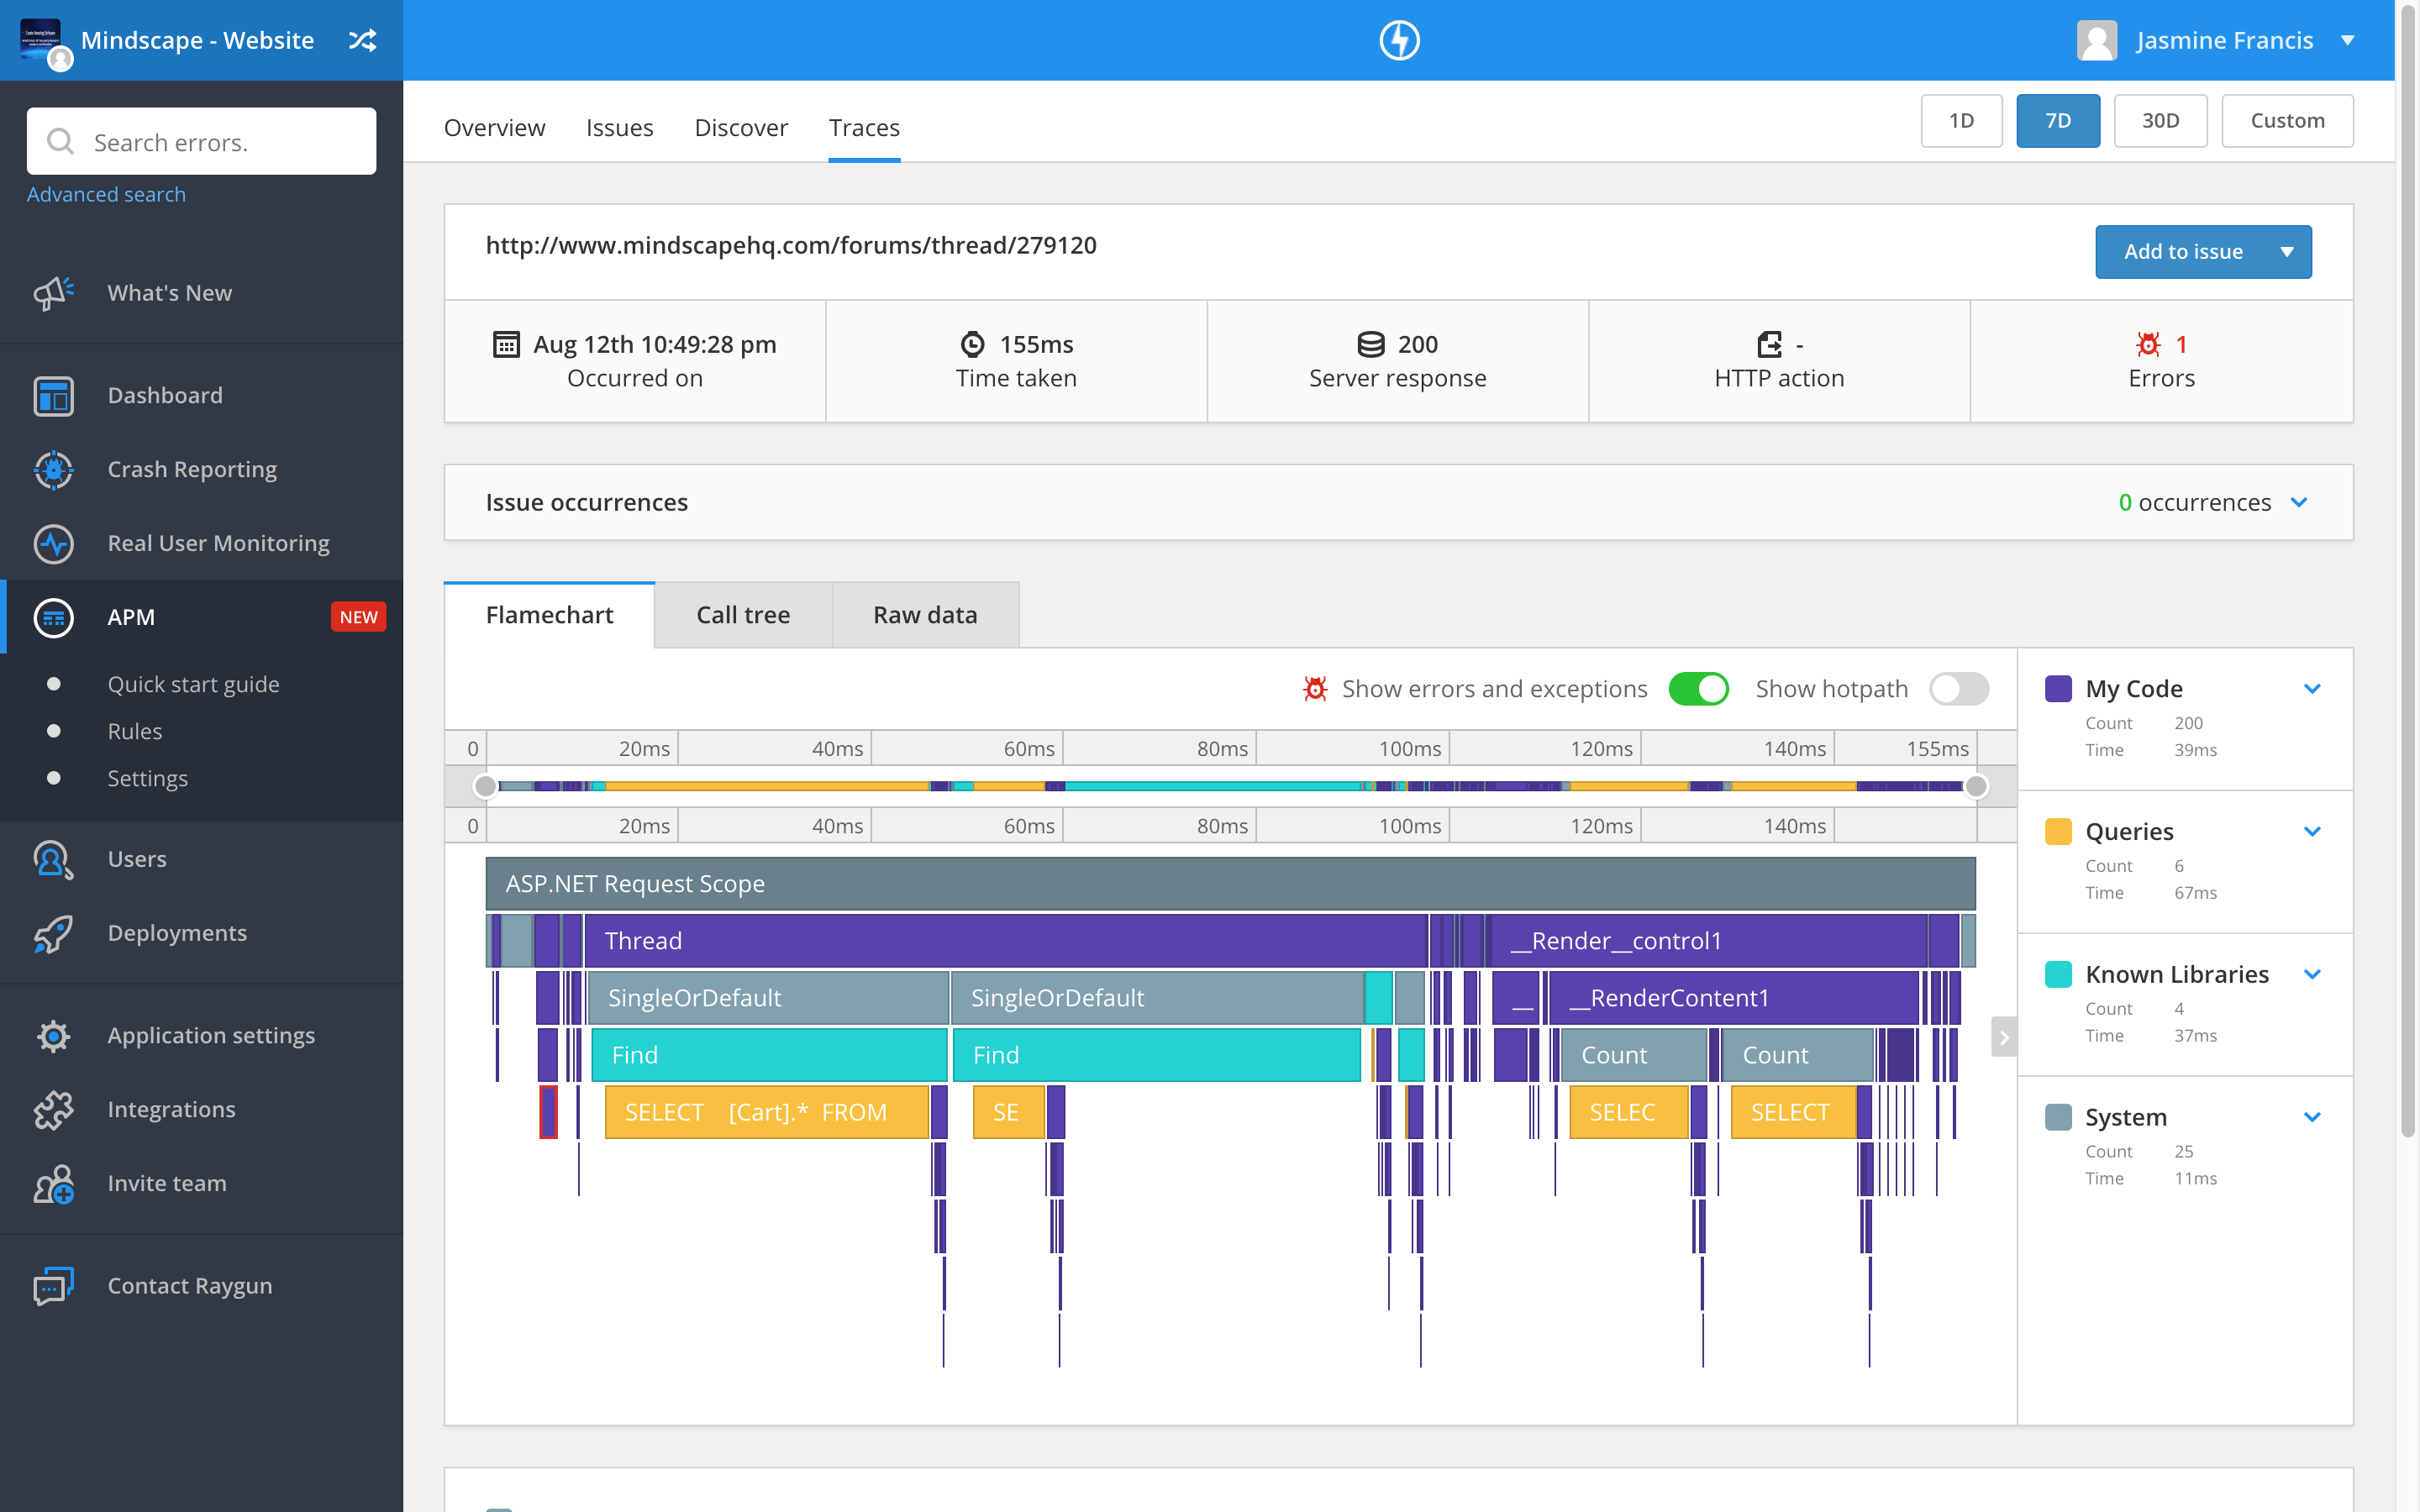
Raygun is a network monitoring and bug tracking application that runs in the cloud. Crash reporting, user monitoring, user tracking, deployment tracking, and connectors with other applications are available for big and midsize enterprises across a variety of industries. There are additional on-premise deployment options.
It also monitors the entire stack of an application. Users can look at client lists, track session data, and analyse how users interact with applications. Diagnostic data and workflow tools assist users in identifying, reproducing, and resolving issues.
Raygun APM is a server-side application performance monitoring tool that gives your software development and maintenance a new dimension. It provides data on your application's server performance and user experience in both trend and real-time. The Raygun platform monitors your whole technological stack and warns you when defects and performance concerns occur, in addition to Crash Reporting and Real User Monitoring.
Raygun applications segment data from various applications, sections of an application, or development environments. Crash Reporting should be set up in production as soon as feasible to catch failures that affect customers. It can also be set up in a development environment.
Raygun Real User Monitoring (RUM) gives you complete visibility into your app's end-user experience. It is compatible with both web and mobile applications. Workflow management tools aids in the organization of issue resolution.
To be alerted to difficulties caused by faulty releases, employ Raygun's Deployment Tracking features. You'll be able to quickly identify problematic deployments and the commits that make them up. You'll be able to view which errors were present in the deployment version, which ones were repaired, and which ones are still there.
#8 Prometheus
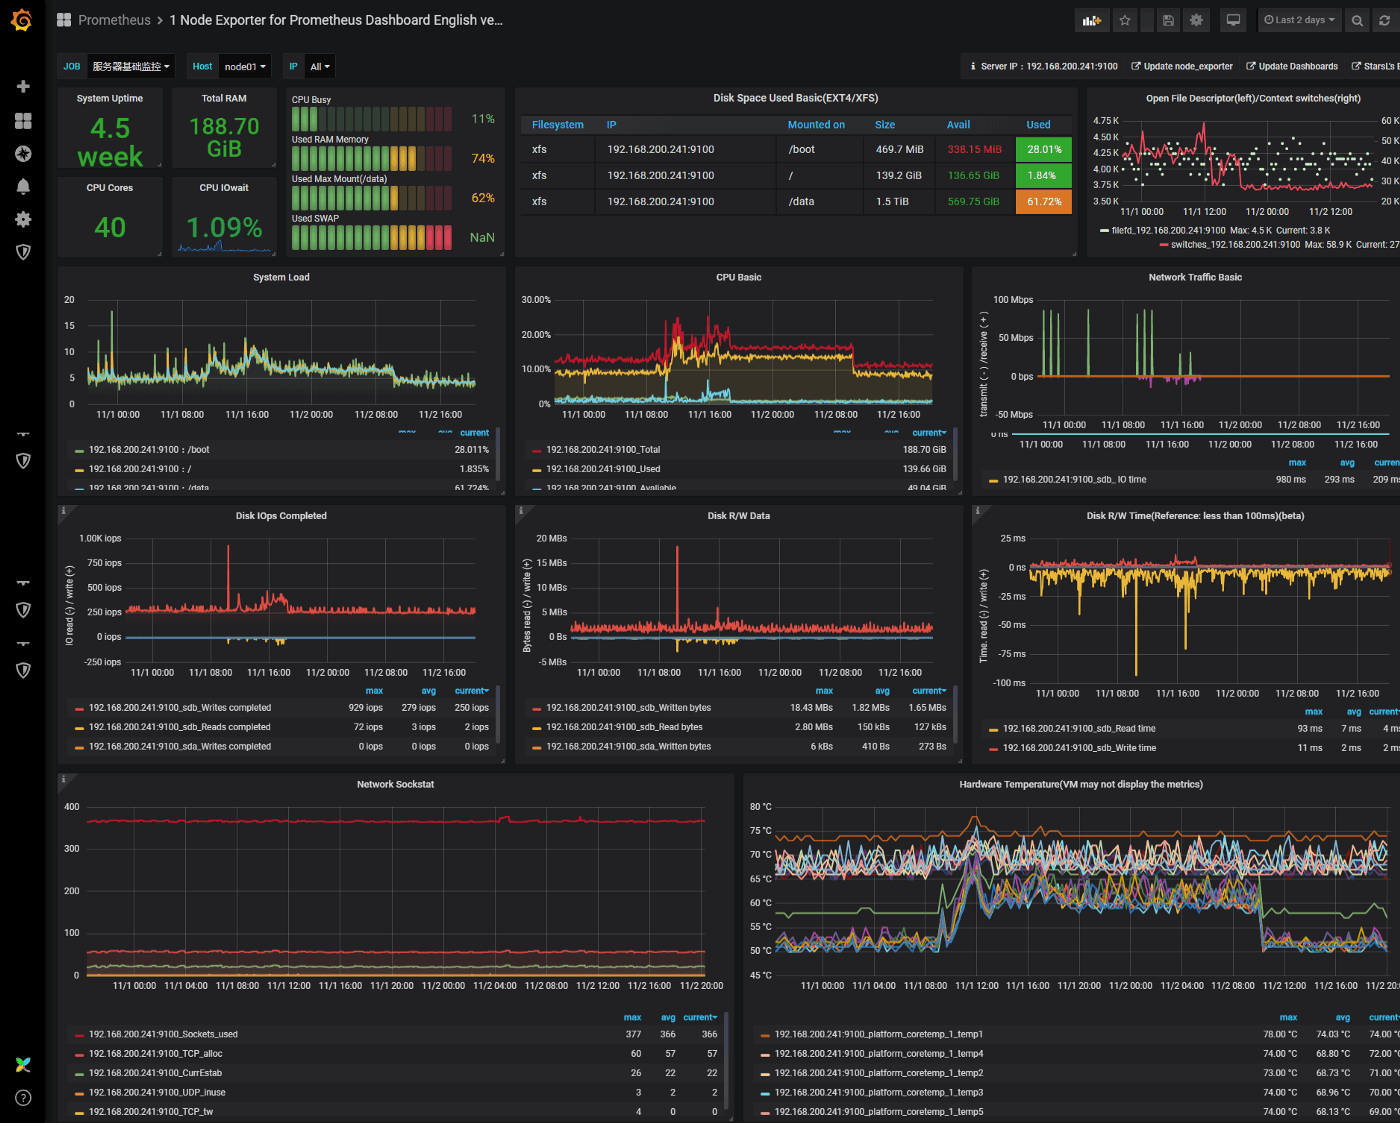
Prometheus is a open-source event monitoring and alerting software application that uses an HTTP pull mechanism to capture real-time measurements in a time series database (allowing for large dimensionality) with configurable searches and real-time alerting. Like Kubernetes and Envoy, this tool is developed in Go and distributed under the Apache 2 License, with the source code available on GitHub. It is also a graduating project of the Cloud Native Computing Foundation.
Data is collected in the form of time series by Prometheus. The time series are created using a pull approach, in which the Prometheus server polls a list of data sources (also known as exporters) on a regular basis. At the endpoint queried by Prometheus, each of the data sources offers the current values of the metrics for that data source. After that, the Prometheus server gathers data from all of the data sources. Prometheus offers a number of techniques for discovering resources that it should use as data sources automatically.
Users can choose and combine data using Prometheus' native query language, PromQL (Prometheus Query Language). PromQL has been tailored to work in tandem with a Time-Series Database and hence includes time-related query capabilities. The rate() function, the instant vector, and the range vector functions can provide many samples for each queried time series. The PromQL components center on four clearly specified metric kinds in Prometheus.
White-box monitoring is something Prometheus prefers. Applications are encouraged to provide internal metrics for Prometheus to collect on a regular basis. To give metrics, some exporters and agents for various applications are available. To facilitate interoperability for transitioning, Prometheus supports the following monitoring and administration protocols: Graphite, StatsD, SNMP, JMX, and CollectD.
Prometheus focuses on platform availability and basic operations. The data is usually kept for a few weeks. The metrics can be sent to distant storage options for long-term storage.
Prometheus is not designed to be used as a dashboarding tool. Although it may be used to graph certain queries, it is not a full-fledged dashboarding solution and requires integration with Grafana in order to build dashboards; this has been highlighted as a drawback owing to the additional setup complexity.
#9 Splunk
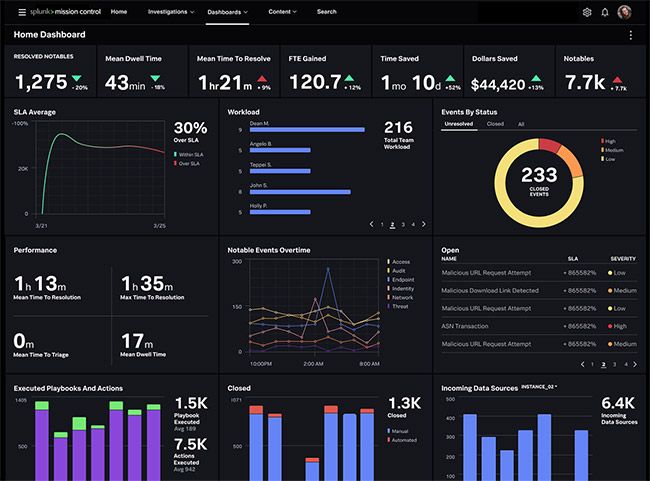
Splunk is a San Francisco-based technology company that creates software for searching, monitoring, and analysing machine-generated data using a Web-based interface. It combines real-time data into a searchable database from which reports, alerts, dashboards, and visualizations can be created.
Splunk makes use of machine data to find patterns in data, generate metrics, diagnose problems, and provide business intelligence. It is a horizontal technology that may be utilized for a variety of purposes, including application management, security and compliance, business and web analytics, and so on.
You can keep track of important information about your applications, infrastructure, and cloud services by using Splunk Observability Cloud. It offers a uniform interface for gathering and monitoring metrics, logs, and traces from a variety of data sources. Full-stack, end-to-end observability of your complete infrastructure is possible with data gathering and monitoring in one place.
With Splunk APM, you can collect traces and spans to monitor your distributed applications. It collects and analyses every span and trace from each service you've linked to Splunk Observability Cloud, providing you with total insight into all of your application data.
You may discover more about the performance and health of your application's front-end user experience with Splunk Real User Monitoring. It captures performance metrics, web vitals, errors, and other types of data to help you detect and troubleshoot application issues.
Splunk Infrastructure Monitoring provides visibility into your hybrid and multi-cloud infrastructure and resources. It supports a wide range of data collection connectors, ranging from system metrics for infrastructure components to custom data from your applications.
Using Splunk Observability Cloud's high-context logs, you can troubleshoot your application and infrastructure behaviour. You can use Splunk Log Observer to execute codeless log queries to find the cause of problems in your systems. You may extract fields from logs to develop log processing rules and change your data as it arrives.
Developers, DevOps, and operations teams can reduce mean time to notice and repair outages by using Splunk On-Call (VictorOps).
Wrapping Up
We hope that this list of Stackify competitors will aid you in your hunt for a replacement software package for whatever you need. Many of these applications provide a free or 14-day trial, so it's worth signing up and testing the software in your network before committing long-term.
#1 Solution for Logs, Traces & Metrics
![]() APM
APM
![]() Kubernetes
Kubernetes
![]() Logs
Logs
![]() Synthetics
Synthetics
![]() RUM
RUM
![]() Serverless
Serverless
![]() Security
Security
![]() More
More