A HAR file: Pro Tips for Developers

A HAR file is a breakdown of timings that help you better understand how your site gets built. The standard includes timings for DNS, objects, and connections, among others. These values are stored as JSON documents in a file called a .har.
In practice, reading .har files can be complicated, but there are ways to make sense of the data for your particular web page or domain.
The HAR file format was created by Mozilla to provide developers with transparency over how web pages are built and what assets are loaded.
This allows you to gain insight into your own site’s performance and discover any issues that might affect visitors.
Table Of Contents
- What is a HAR file?
- Creating a HAR file
- Different methods to visualize HAR files
- Examine the HAR file
What is a HAR file?
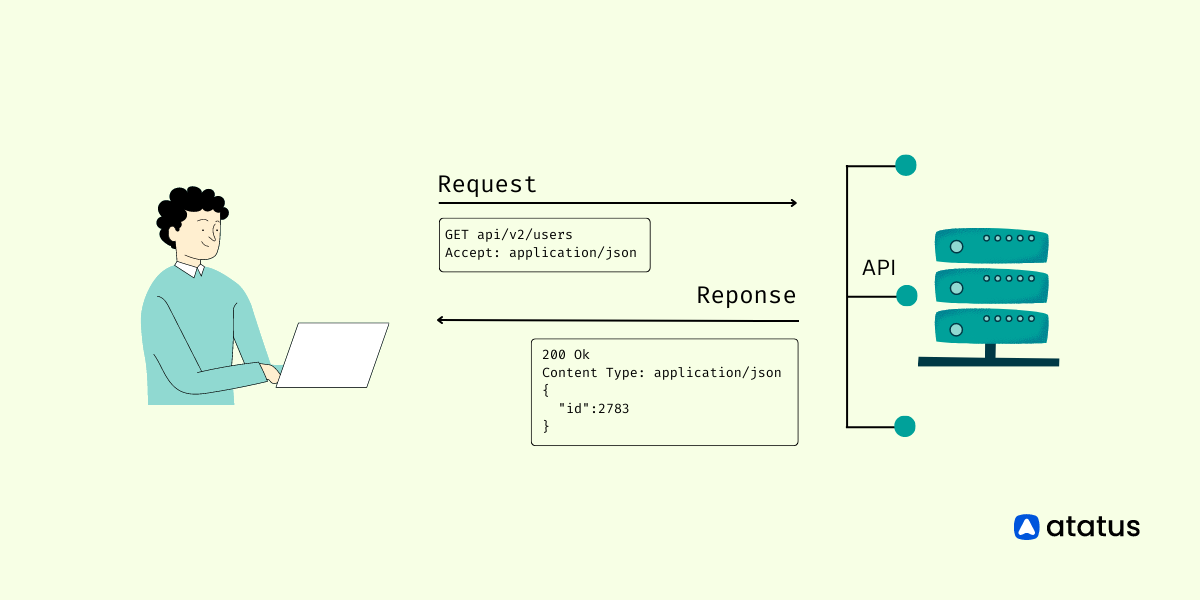
A HAR file is an HTTP Archive. It's a JSON-based manifest of all assets loaded in your browser. HAR files can be used to track down and check which resources are causing slow page load times.
The HAR file is a performance measurement file that captures a website's HTTP traffic. This is a standard format that can be used to measure the performance of any website.
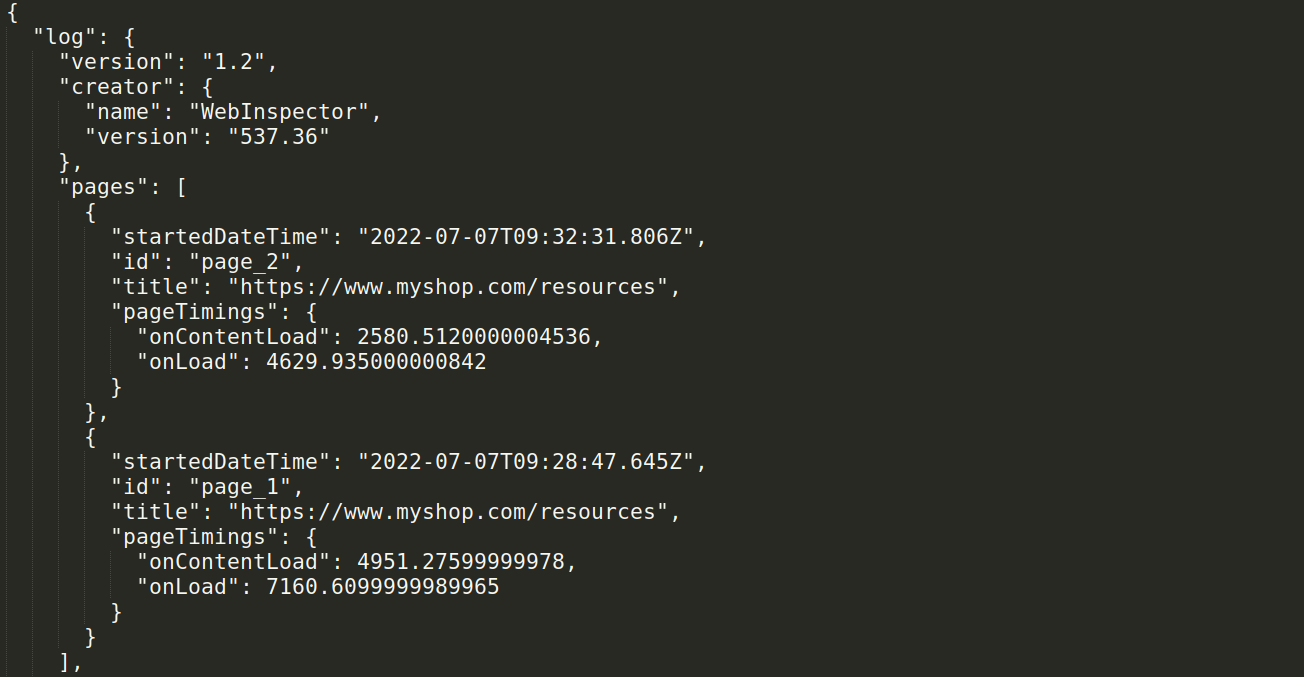
The HAR file format is an evolving standard and the information contained within it is both flexible and extensible. It can contain any data you want, as long as it is serialized into JSON format.
This means that you can easily add your own metrics to the HAR file by using Hooks and Extensions.
Creating a HAR file
HAR is a file that contains a HARriet Analysis of your website. It is similar to pings, but it has some extra information that makes it more powerful. You can create a HAR file with any browser, but using Chrome or Firefox is more recommended.
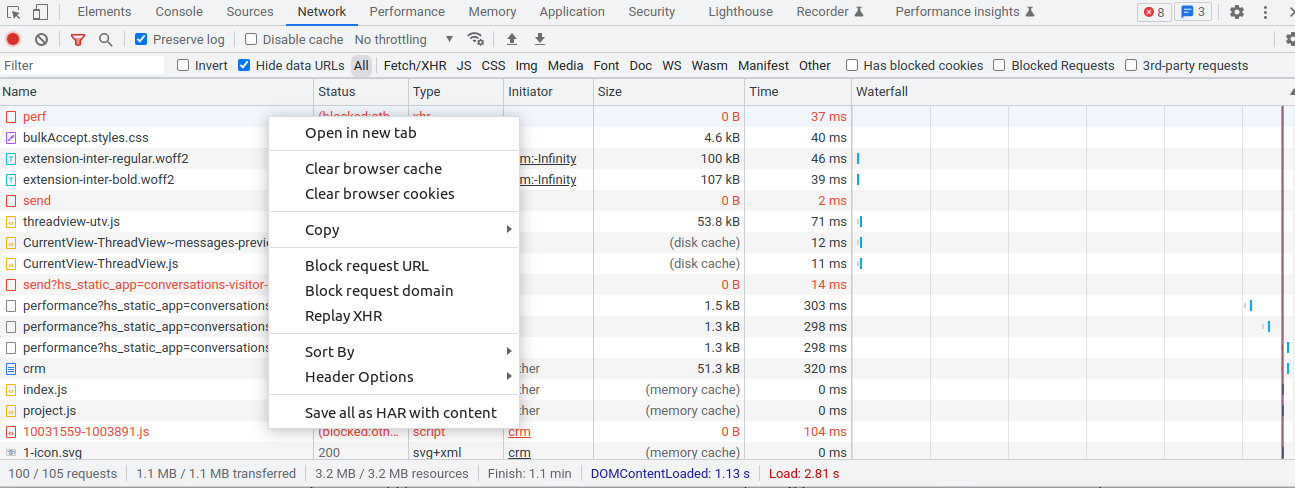
1. Google Chrome HAR file Generation
To create a HAR file in Chrome for a specific URL, follow the steps below.
i.) Click on the web page where the problem occurred in your Chrome browser.
ii.) Launch the Developer Tool (Inspect). (Shortcut For Windows: CTRL + Shift + i, For Mac: CMD + ALT + i, For Linux: CTRL+Shift+C ).
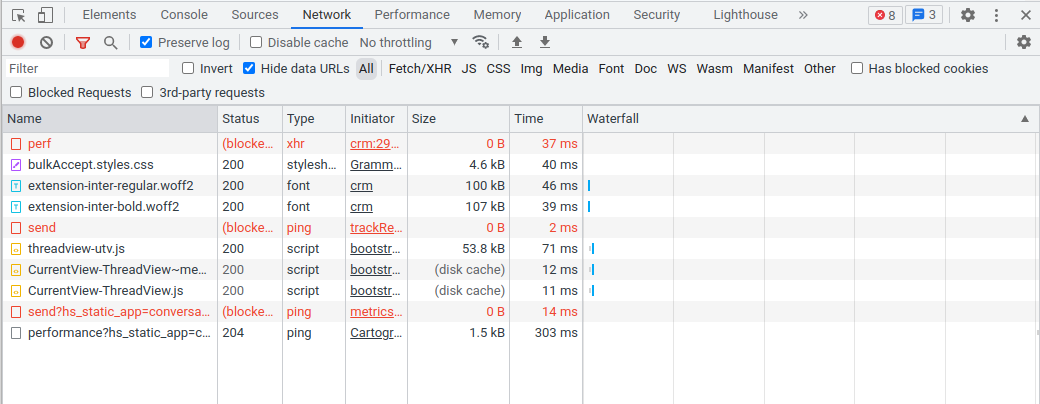
iii.) Click on the Network tab next.
iv.) Start the file recording by clicking the left side of the panel. In this section, you will find a small round red button. (A red-coloured round button starts recording, so you don't need to click on it, but if it's grayed, you'll have to press it.)
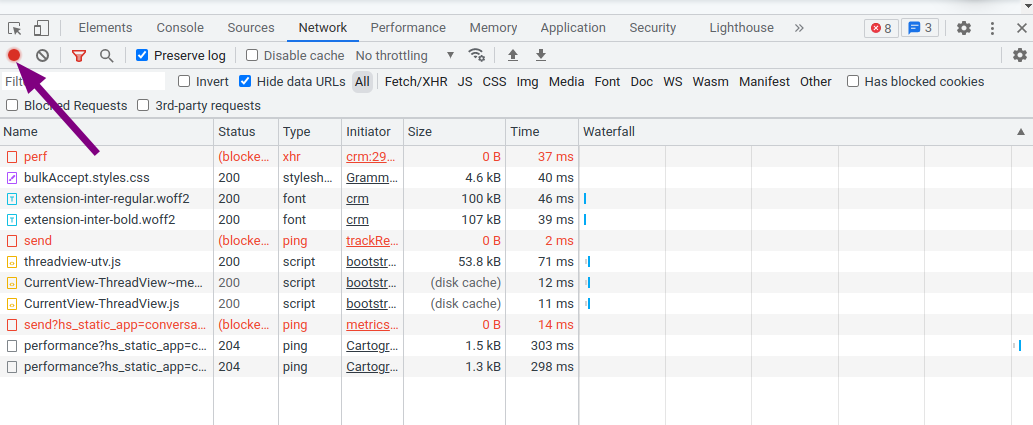
v.) Any log records kept in the browser can be removed by clicking the "Clear icon".
vi.) Refresh the page.
vii.) Right-click on the network panel content and then select "Save as HAR File".
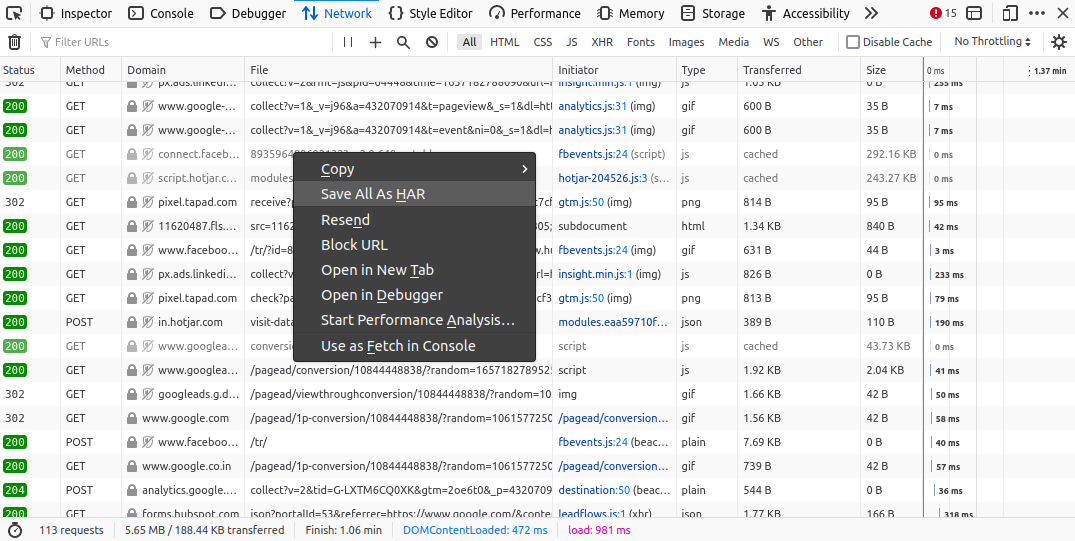
2. Firefox HAR File Generation
i.) Click the page on which the problem occurred in your Firefox browser.
ii.) To access the Developer Tool, press CTRL + Shift + i on Windows and CMD + Option + C on Mac.
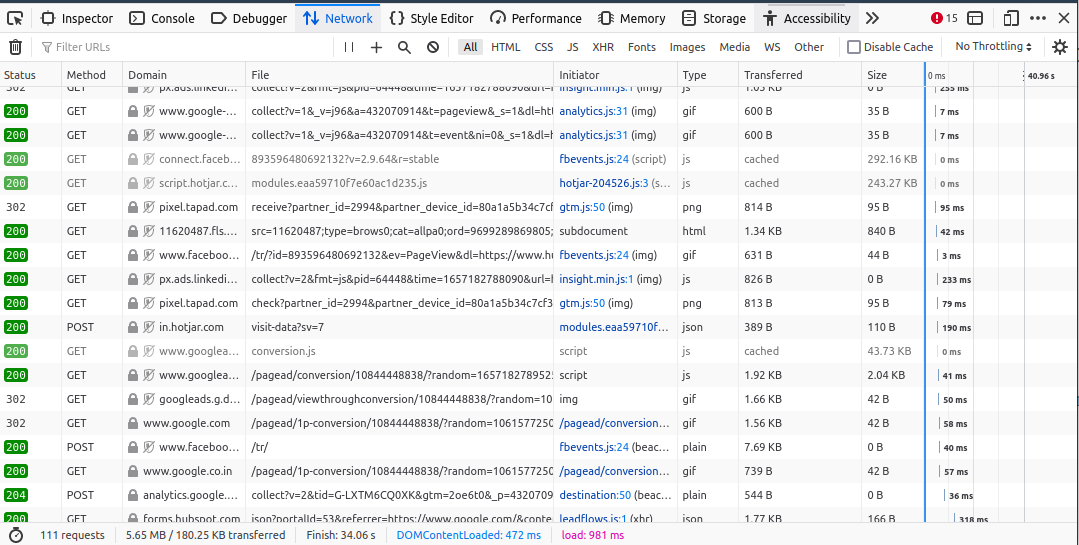
iii.) Select the Network tab.
iv.) Refresh the page.
v.) Right click and select the "Save All as HAR" to save the content in a HAR file.
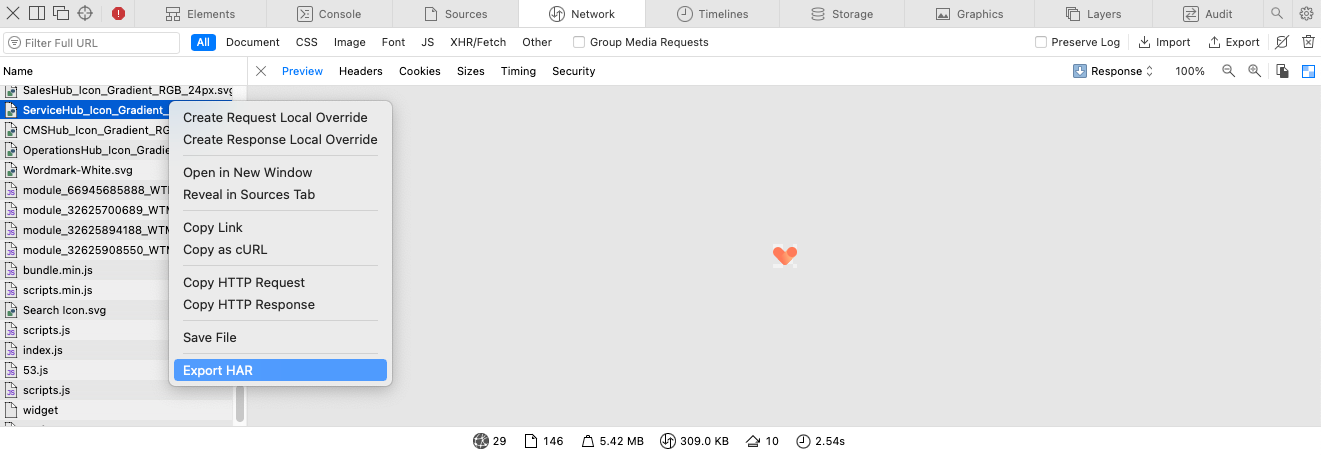
3. Safari HAR File Generation
If you are experiencing an issue with a web page, open your Safari browser and click there.
i.) You can view the page by pressing "Option + Command + I".
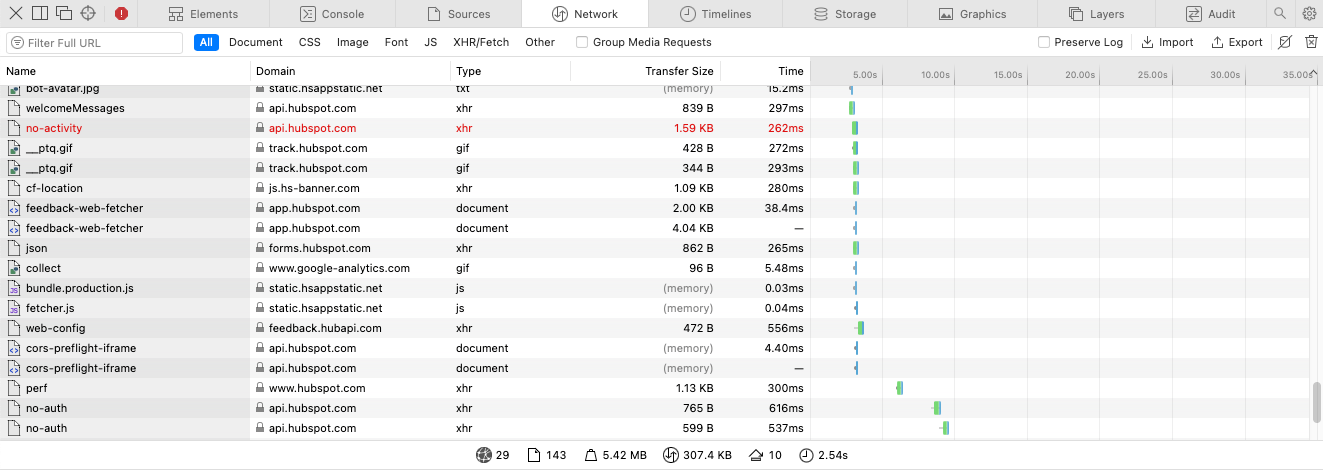
ii.) Navigate to the "Network Tab".
iii.) Refresh the page.
iv.) Right click on any of the network call and click on"Export as HAR" to download as a HAR file.
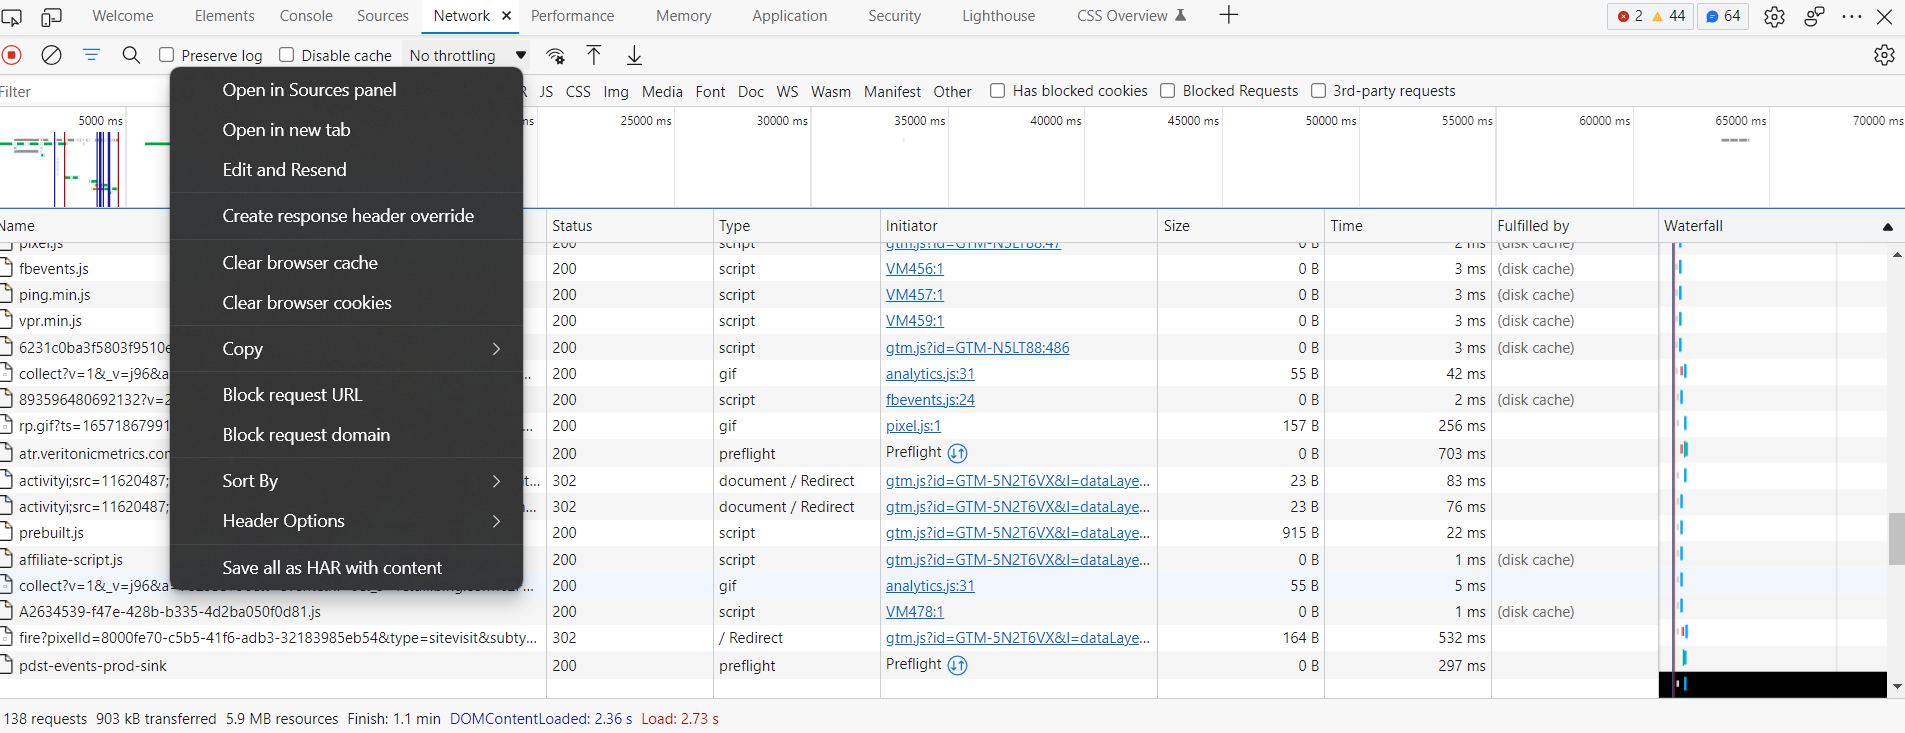
4. Microsoft Edge HAR file Generation
You can view the page where the error occurred by opening Microsoft Edge and clicking on it.
i.) You can do this by pressing F12 or CTRL+Shift+C.
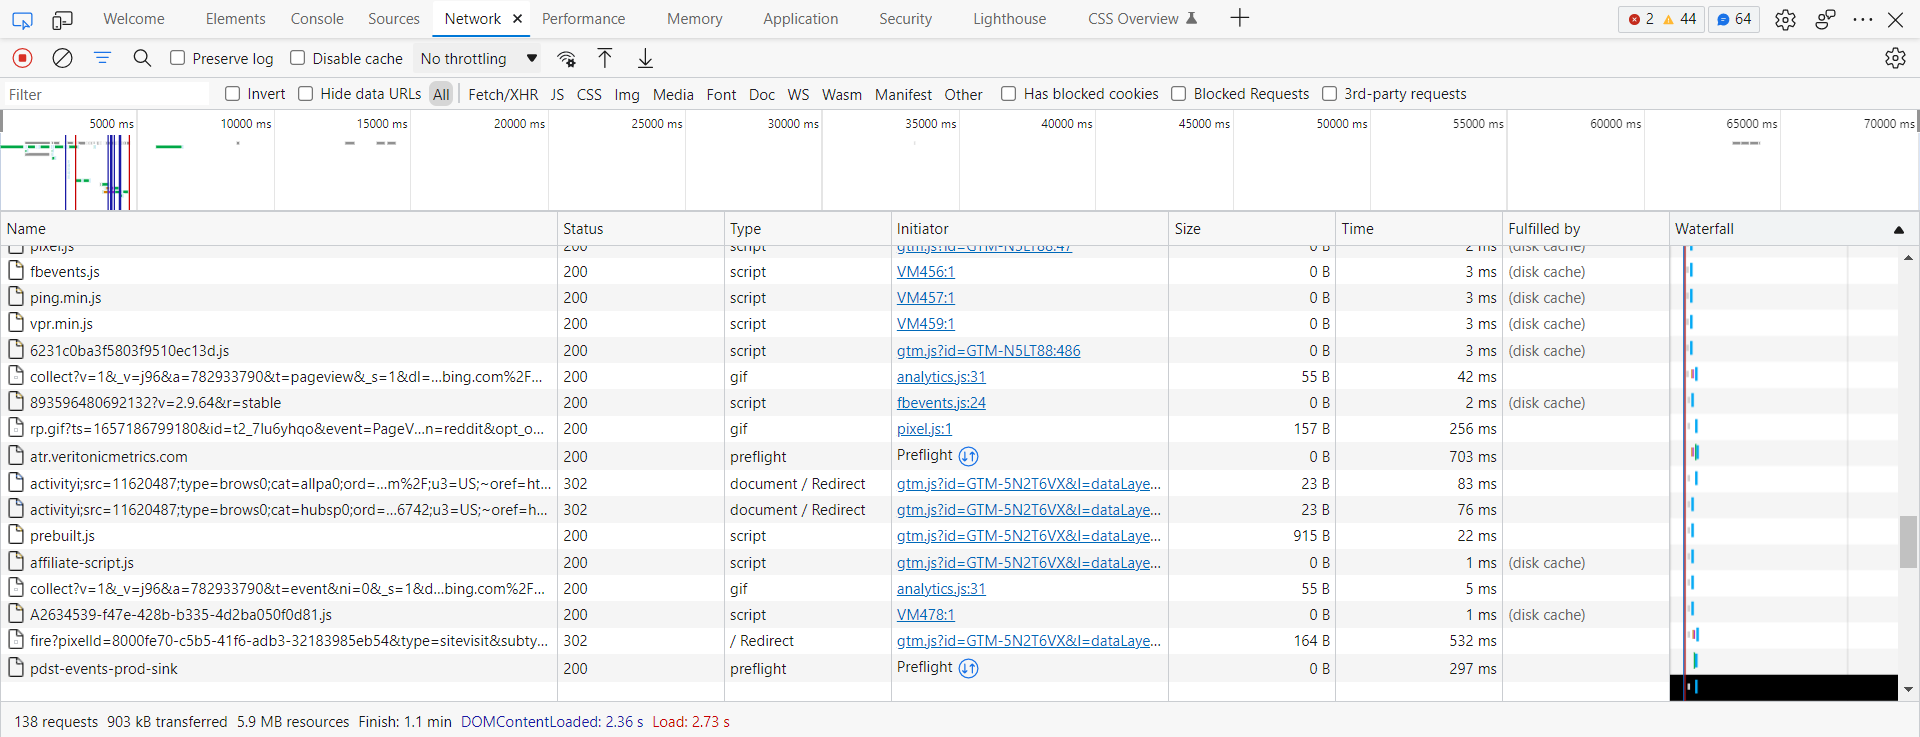
ii.) Select the Network tab.
iii.) Refresh the page.
iv.) Right click and select the "Save All as HAR with content" to save the content in a HAR file.
Different methods to visualize HAR files
In order to visualize data in your HAR file, you can choose one of three methods:
a.) Use HTTP Archive Viewer - Select the HAR file by clicking one the "Choose file" option and it generate a file or a HAR report for you!
The following tools can also be used to view and analyze HAR files:
b.) Check with your monitoring service - They should have some sort of visualization tool that lets you compare load times from different geographic locations. This will give you a broader view of how customers around the world experience your site.
c.) Use the Chrome Network tab of Chrome's developer tools (or whatever Network tab or browser you prefer). It's easy to find and use this tool, so it's ideal for first-time users!
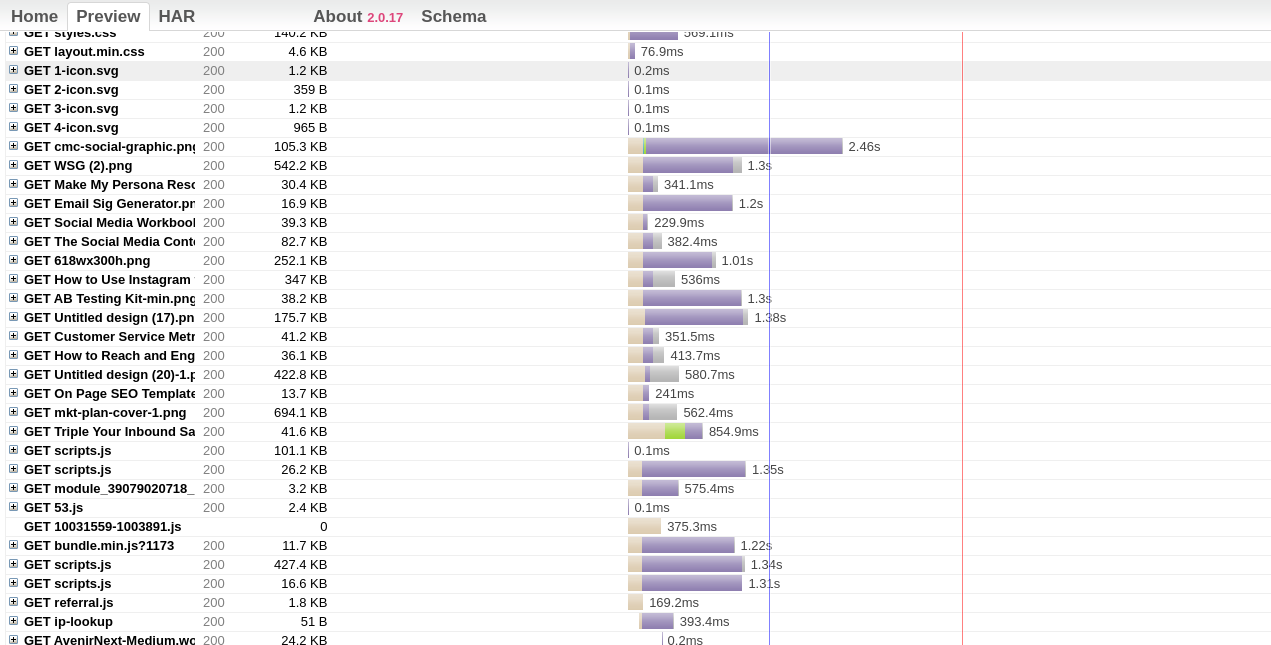
Examine the HAR file
When troubleshooting performance issues or page rendering issues, different steps are taken to analyze the web requests captured in the HAR file.
A HAR Viewer, which is available as a web application, is a common tool for viewing HAR files.
- The longest request (usually the longest bar when viewing all requests) should be the one that took the longest to respond.
- Calculate how long the longest wait was.
- Determining the reason for a delay (blocking, waiting, or receiving) is the best way to resolve it.
- Reload the page multiple times to check for consistency
- If the Server identification is contributing to the delay, contact the Support Team with the information captured. You can contact the ISP or internal hosting team directly for assistance with other issues, such as the network. Information collected should demonstrate the observation.
Last-Shot
A HAR file is, as the acronym suggests, a file created from the information retrieved from an HTTP Archive.
The data of the HTTP Archive can be used in various ways, for norm, in a program that allows you to analyze any website. HAR files are a great way to look at how websites function and how their content is distributed.
HAR files are conventionally generated by Firefox and may contain debugging data, crash reports, installed add-ons, bookmarks or browsing history, form history, cookies and cache, among many other items.
These files give developers a way to debug code and identify issues that may be occurring in a browser environment. Depending on the circumstance, you may be able to extract relevant data from a HAR file or convert it into CSV format.
Atatus: Monitoring applications in a Nutshell
Atatus provides actionable insights for application monitoring, so you can isolate and resolve performance issues holistically. Learn about the slowest layers affecting your customers by getting a complete picture of your requests.
Get real-time insights into the performance of your applications as well as details about slow database queries, poor network performance, and more. Using Atatus, you can quickly identify root causes.
Transaction Monitoring provides histograms and percentiles along with error rates for troubleshooting request performance issues. Identify slow API responses right away.

Access to performance information for network calls to external services, such as third-party apps, micro-services, and other services. Find out which network calls are most time-consuming and help you prioritize your requests accordingly.
Identify the time spent on database queries, code blocks, external services, templates, message queues, and so on in slow request traces. With the original request, view logs, infrastructure metrics, and VM metrics.
Bring your app to vitality faster and free of bugs with Atatus. Consequently, check out Atatus’s 14-day unlimited free trial!
#1 Solution for Logs, Traces & Metrics
![]() APM
APM
![]() Kubernetes
Kubernetes
![]() Logs
Logs
![]() Synthetics
Synthetics
![]() RUM
RUM
![]() Serverless
Serverless
![]() Security
Security
![]() More
More