Transaction Monitoring
Within minutes identify server-side performance bottlenecks with the most time consuming transaction, highly detailed breakdown along with percentile and apdex charts gives you a granular view with actionable insights.

Get the whole story behind requests
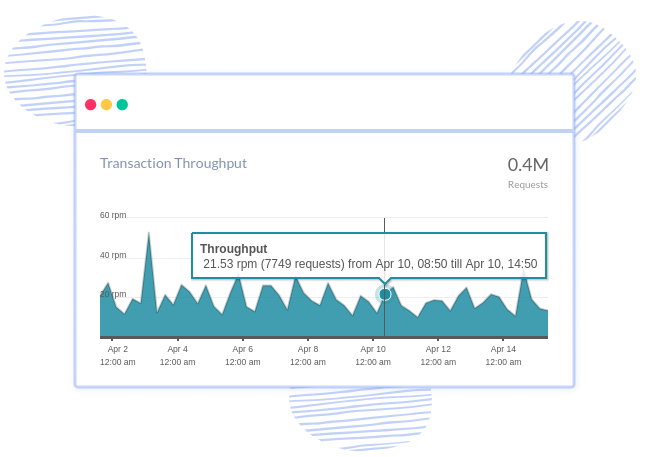
Automatically start monitoring all your requests that your app serves, and get in-depth details on how each of your requests perform, which end points have the worst performance, how app errors and exceptions affect your users and start prioritizing your actions.

Uncover performance impacts immediately
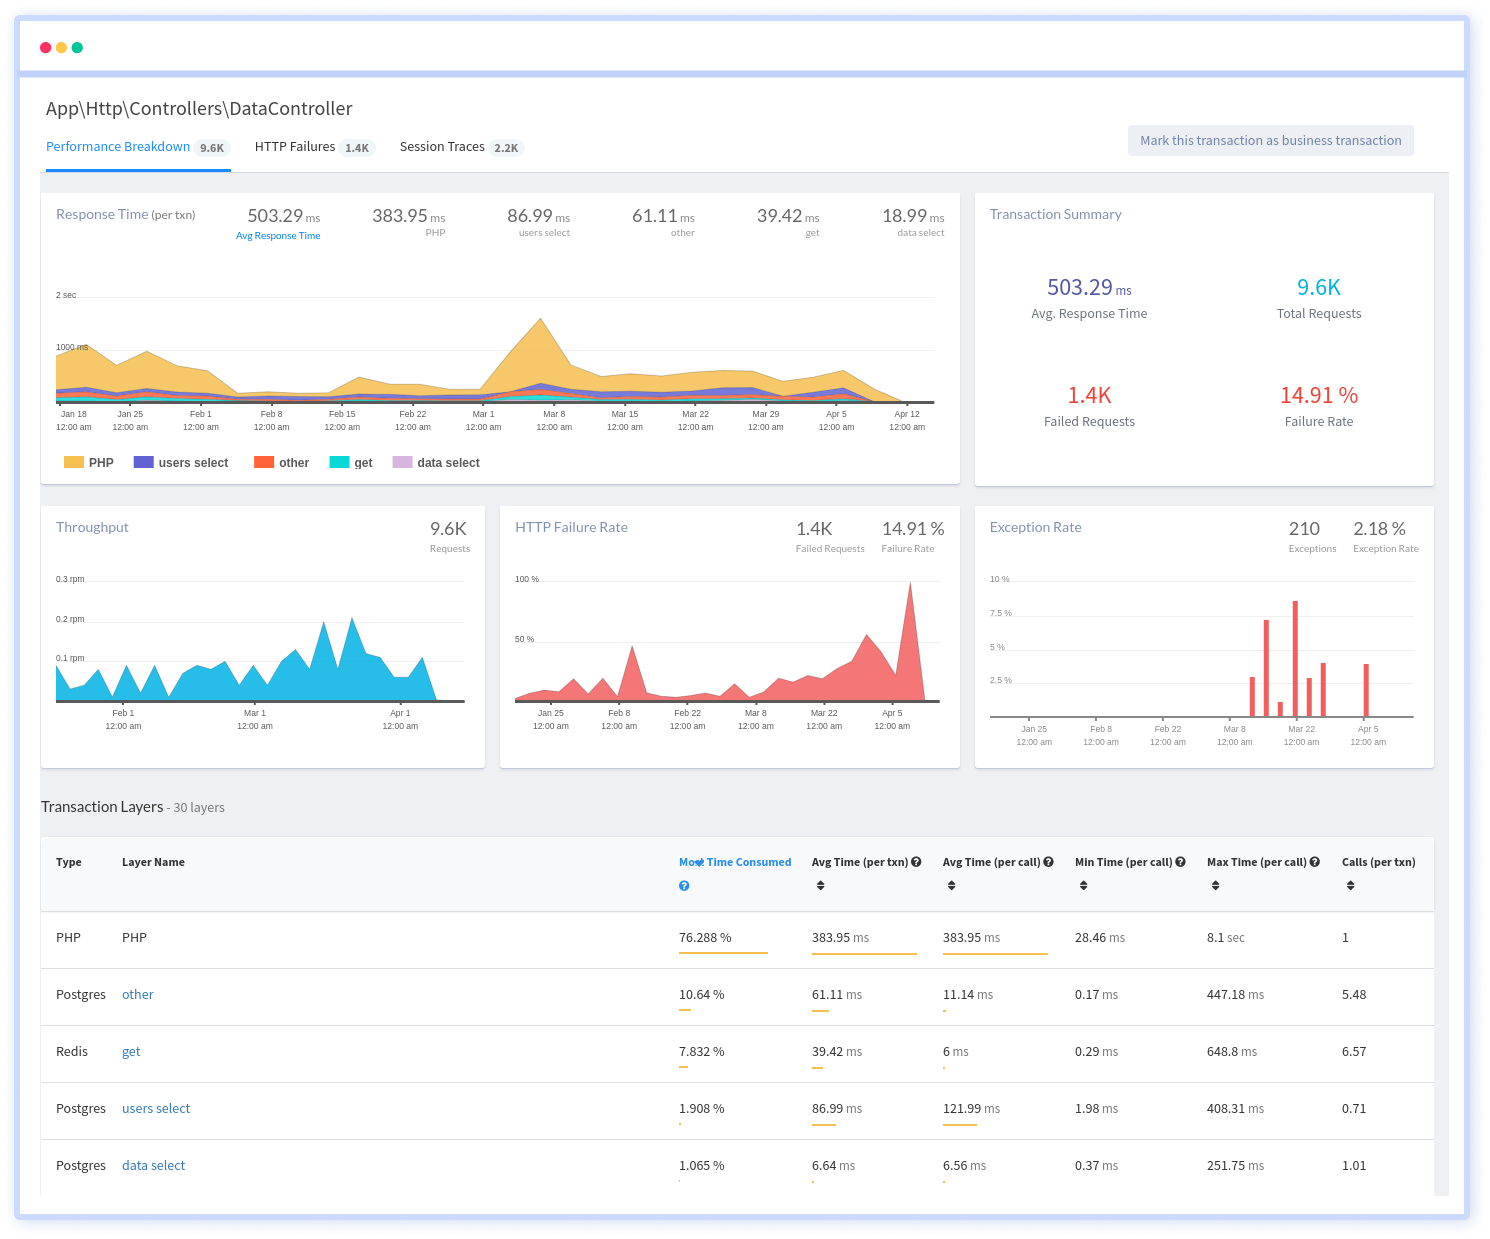
Identify performance bottlenecks immediately with individual breakdown of each request, along with apdex score, user satisfaction report, HTTP failures, Traces and more. Get actionable insights to resolve issues and root cause problems faster.

Recognize anomalies that slow your app
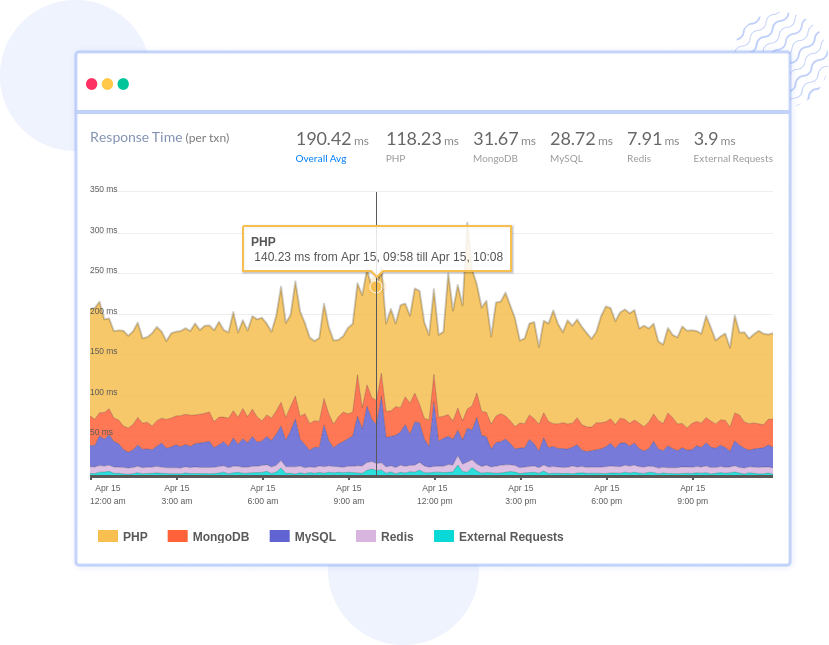
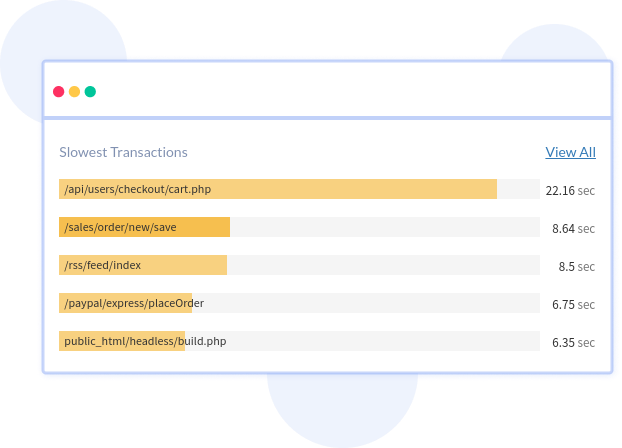
Immediately get an overview of the slowest transactions along with breakdown of slow requests by time spent in code, CPU, database queries, third party network calls and more. Dig deeper into each trace to determine the cause of the issues, tie them with custom data, request parameters and what caused them.


 +1-760-465-2330


