atop - Analyze Linux Server Performance

The "atop" is an advanced system and process monitor used in the Linux environment to analyze the server performance. It is necessary to analyze the performance of the server continuously.
It is a performance monitor which gives us a report on all the activities of processes running on a server.
Installation of Atop:
For Debian/Ubuntu, use the following command to install,
$ apt install atopFor RHEL/CentOS/Fedora, use the following command to install,
$ yum install atopStarting Atop:
To start Atop, use the following command,
$ atopOther key combinations
Some of the other commands are explained below:
| Command | Description |
|---|---|
| atop -1: | This command is used for displaying average-per-second total values. |
| atop -a: | This command is used for displaying only the processes which are active. |
| atop -c: | This command is used to launch the command line per process. |
| atop -d: | This command is used for displaying disk info. |
| atop -m: | This command is used for displaying memory info. |
| atop -n: | This command is used for displaying network info. |
| atop -s: | This command is used for displaying scheduling info. |
| atop -v: | This command is used for displaying various info like ppid, user, time, etc. |
| atop -y: | This command is used for launching with individual threads. |
The output of ATOP:
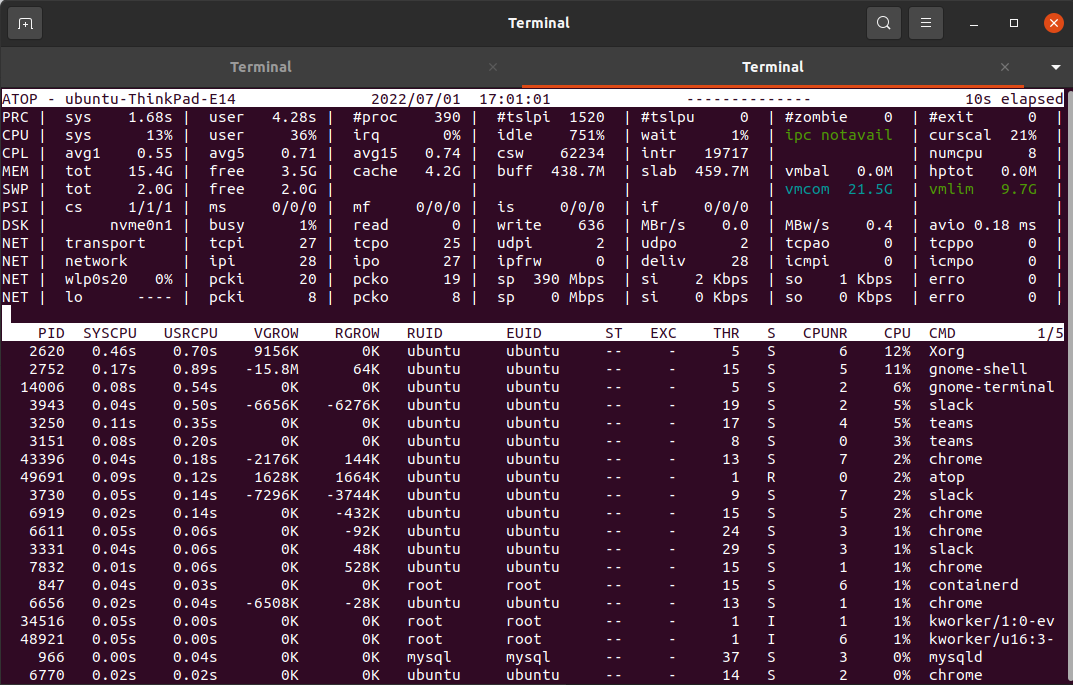
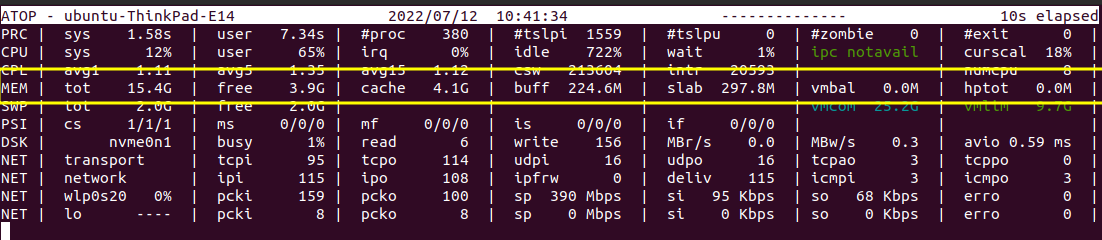
The whole layout can be divided into two sections. The upper section provides the cumulative statistics and the lower section about system resources used by each process. Let us see in detail the parameters in the output of the atop command.
The whole layout can be divided into two sections. The upper section provides the cumulative statistics and the lower section about system resources used by each process. Let us see in detail the parameters in the output of the atop command.
Cumulative statistics
The cumulative statistics section contains the statistics related to process, performance, memory, disk, and network.
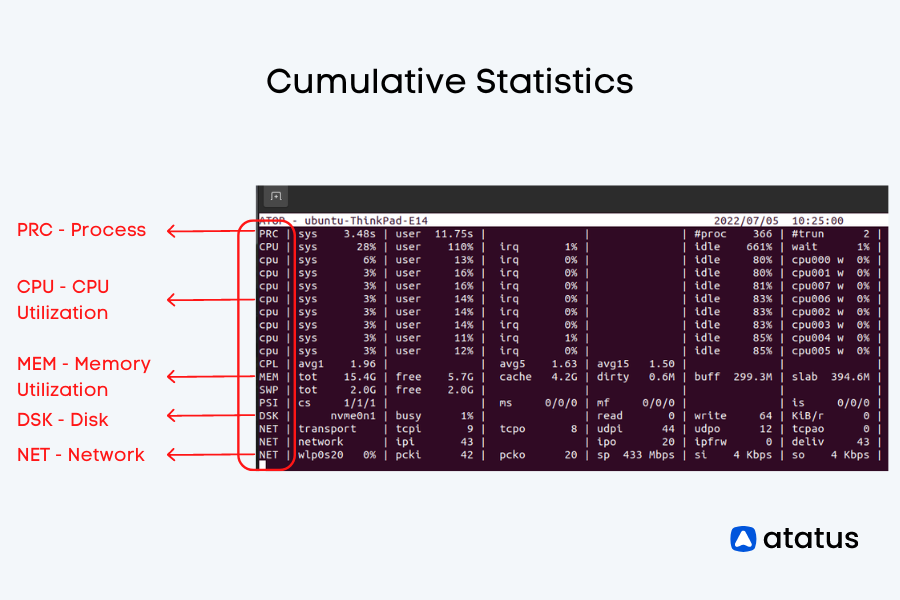
Let us see each section separately and the parameters in it.
a.) Process-related Statistics
The first line of the output explains the process and displays the statistics on the time consumed by the total number of processes and other parameters. Let us see the parameters displayed in the output.
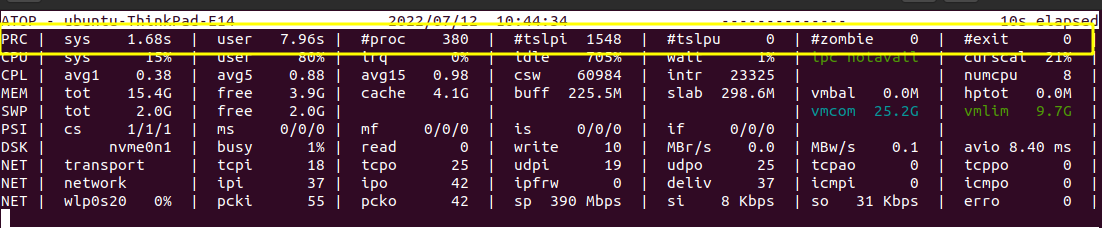
This is how the process related statistics parameters were displayed in the terminal. Let us see the abbreviations and explanation of the parameters below:
PRC - Short for “Process”.

- sys - The time consumed by the system.
- user - The time consumed by the user.
- #proc - The total number of processes.
- #tslpi - The number of threads that are currently sleeping and interruptible.
- #tslpu - The number of threads that are currently sleeping and uninterruptible
- #zombie - The number of zombie processes.
- #exit - The number of processes that ended during the elapsed time.
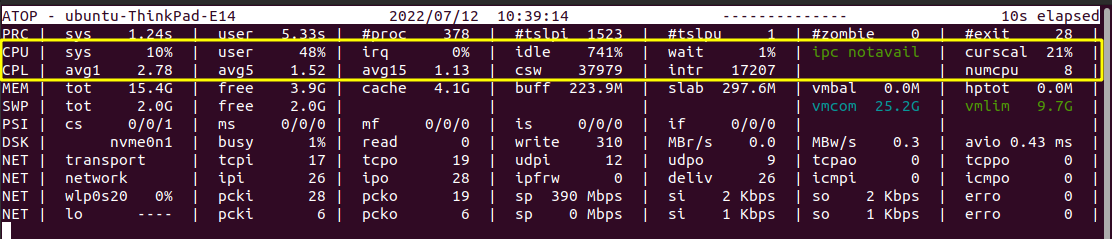
b.) Performance-related Statistics
The second and third line of the output, which starts with CPU and CPL, displays us with the performance-related statistics like the CPU percentage, waiting time., etc. The parameters displayed in the output are explained below.
CPU - Denotes the CPU Utilization.

- sys, user - The percentage of utilization of the cores by the system and user.
- irq - Percentage of CPU used for interrupt requests.
- idle - Idle percentage of all the cores.
- wait - The waiting time each CPU core needs to do.

- CPL - Denotes the CPU Load.
- avg1, avg5, avg15 - Average loads with periods of duration like 1, 5, and 15 minutes.
- csw - Represents the context switches.
- intr - Denotes the number of interrupts.
- numcpu - Denotes the number of CPUs.
c.) Memory-related statistics
The MEM line in the command window shows us the memory-related statistics, which include the free memory, used memory, total amount of memory available, etc..
We can see that the memory related statistics parameters are displayed above. Let us see the abbreviations and explanation of the parameters below.
MEM - Stands for Memory Utilization.

- tot - Represents the total physical memory supported.
- free - Represents the memory that is free currently.
- cache - Represents the cached memory.
- buff - Represents the amount of memory consumed in filesystem metadata.
- slab - Represents the sum of memory for kernel’s memory allocation.
- SWP - Represents the Swap Memory.
d.) Disk-related statistics
The usage of the disk, the number of reading and writing requests., etc are all displayed in this section. We can see that the Disk related statistics parameters are displayed below. Let us see the abbreviations and explanation of the parameters as follows.
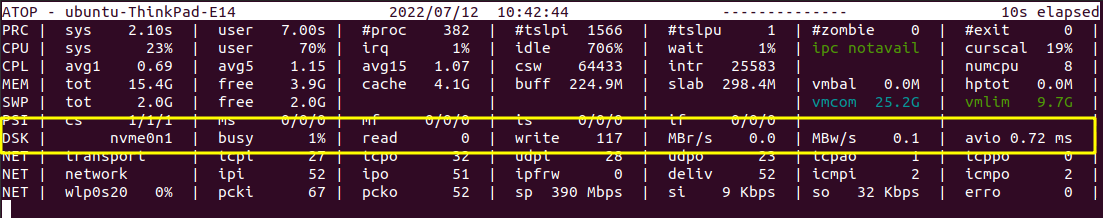
DSK - Represents the disk usage.

- busy - Represents the percentage of time the system is busy handling the requests it receives.
- read - Represents the reading requests issued.
- write - Represents the writing requests issued.
- MBr/s - Represents the rate at which data is read per request in megabytes(MB).
- MBw/s - Represents the rate at which data is written per request in megabytes(MB).
- avio - Represents the average number of milliseconds spent handling the requests.
e.) Network-related statistics
The network-related statistics section reports us the network statistics from the transport and the network layer.
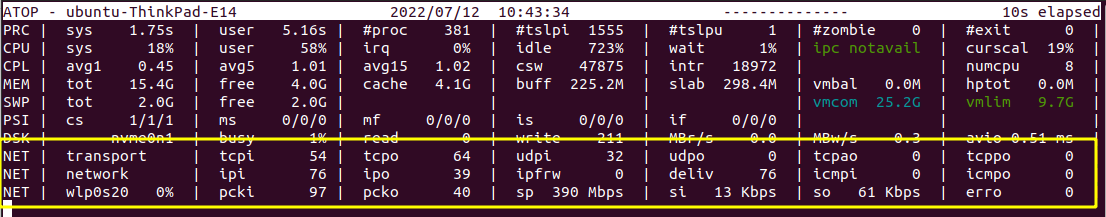
The transport layer statistics report is displayed below.
i.) NET | transport
- transport - Denotes the transport layer, which is one layer in the OSI model, which manages the delivery of data packets.
- tcpi - represents the number of segments received by the system.
- tcpo - represents the number of segments transmitted.
- udpi , udpo - stands for UDP in and UDP out.
- tcpao - Represents the number of TCP open connections which are active.
- tcppo - Represents the number of TCP open connections which are passive. Opposite to tcpao.
ii.) NET | network - Represents the network statistics at the network layer.

- network - Denotes the network layer which is also one of the layers in the OSI model, which deals with the transmission of data.
- ipi - Denotes the number of IP packets received by network interfaces.
- ipo - Denotes the number of IP packets transmitted out by network interfaces.
- ipfrw - Representation of quantity of IP packets forwarded to other interfaces.
- deliv - Denotes the number of IP packets delivered successfully.
- icmpi ,icmpo - Representation of the ICMP packets received and transmitted by the network interfaces.
iii.) NET | wlp0s20
- wlp0s20 - Represents the name of the interface.
- pcki, pcko - Represents the packets received and transmitted by a particular interface.
- sp - Represents the network speed.
- si, so - Represents the rate at which bits are transmitted and received.
- erro - Represents the number of errors in the packet received.
System resource consumed by each process
Let us see what are the parameters in the system resource consumed section explain to us in detail.
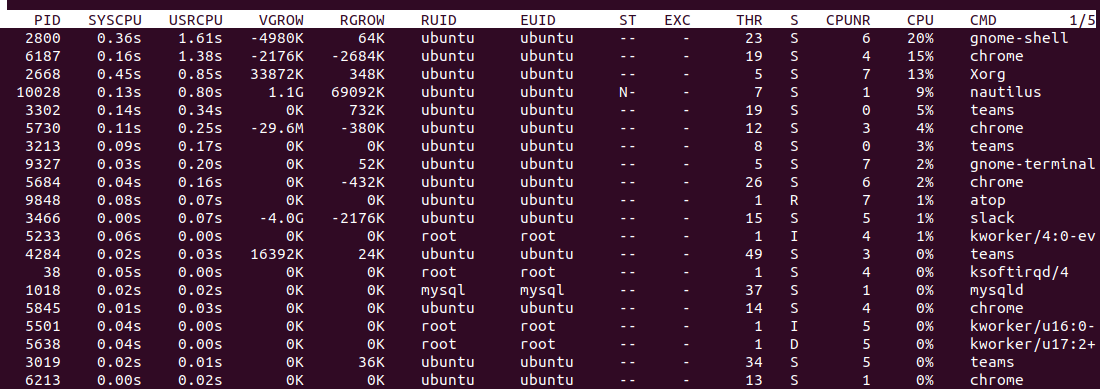
- PID - represents the process ID.
- SYSCPU - represents the amount of CPU consumed during system handling.
- USRCPU - represents the amount of CPU consumed during user mode.
- VGROW - represents the amount of virtual memory that the process has occupied since the last update.
- RGROW - represents the amount of physical memory gained since the last update.
- RUID - represents the real user ID.
- EUID - represents the effective user ID.
- ST - represents the current status of the process.
- EXC - represents the exit code once the process gets terminated.
- THR - denotes the number of threads within the process.
- S - represents the current status of the primary thread in the process.
- CPU - denotes the percentage of utilization of CPU for the whole process.
- CMD - Indicates the name of the process.
Advantages of using Atop
Atop is a performance monitor which records resource usage data for analysis. Now let us see the advantages of Atop.
- It gives attention only to threads that are in the process and ignores the processes which are not in use.
- We can get the report on the usage of resources for all the processes such as running, completing, or even closing.
- The report of the Atop includes the detail on Disk I/O and network utilization.
- The critical resources are highlighted using the color red which makes them stand out from others and paves the way for the useful and easy way of finding out the critical resources and keeping track of them.
- Even if the size of the display window changes, it adds and removes columns automatically according to its size.
Conclusion
The topics we have discussed in this blog are:
- Installation of the system and the key combinations to be used.
- The detailed information about the statistics generated by atop, the command for monitoring the performance of a Linux system.
- Finally, the advantages of the atop command.
There are other commands like htop, top and iotop, which are more preferably used by Linux users to monitor the processes in the Linux System to analyze the resource usage and reduce the slowness of the system. And these commands are mostly practiced by Linux users.
ATOP, if mastered, has its own advantages and can be helpful in monitoring the system resources of the Linux system like the other mostly used commands.
Monitor Your Entire Application with Atatus
Atatus is a Full Stack Observability Platform that lets you review problems as if they happened in your application. Instead of guessing why errors happen or asking users for screenshots and log dumps, Atatus lets you replay the session to quickly understand what went wrong.
We offer Application Performance Monitoring, Real User Monitoring, Server Monitoring, Logs Monitoring, Synthetic Monitoring, Uptime Monitoring and API Analytics. It works perfectly with any application, regardless of framework, and has plugins.

Atatus can be beneficial to your business, which provides a comprehensive view of your application, including how it works, where performance bottlenecks exist, which users are most impacted, and which errors break your code for your frontend, backend, and infrastructure.
If you are not yet a Atatus customer, you can sign up for a 14-day free trial .
#1 Solution for Logs, Traces & Metrics
![]() APM
APM
![]() Kubernetes
Kubernetes
![]() Logs
Logs
![]() Synthetics
Synthetics
![]() RUM
RUM
![]() Serverless
Serverless
![]() Security
Security
![]() More
More