New Relic vs Sentry - Which Monitoring Tool to Choose? [2026]
![New Relic vs Sentry - Which Monitoring Tool to Choose? [2026]](/blog/content/images/size/w960/2024/10/VS--1-.png)
New Relic and Sentry are both popular monitoring tools but they're built for very different problems. If you put them side by side and expect a fair fight, you'll quickly find they don't really compete on the same ground.
Sentry is built for developers who want to know exactly what broke, where, and why. It's precise, code-first, and excellent at error tracking. New Relic is built for engineering teams who need to see the full picture such as infrastructure, application performance, logs, and user experience in one place.
The question most teams face isn't 'which is better?' It's 'which one solves the problem I actually have right now?' A startup debugging a Node.js API has different needs than a platform team managing 40 microservices on AWS.
In this comparison, we tested both tools hands-on - setup, APM, error monitoring, session replay, and pricing. By the end, you'll know exactly which one fits your team, and we'll also introduce a third option worth considering if neither fully hits the mark.
In this blog post:
- Tool overview
- Product Overview
- New Relic vs Sentry: Key Differences and Common Features
- Initial Setup
- Application Performance Monitoring(APM)
- Error Monitoring
- Session Replay
- Pricing
- When to Choose New Relic vs Sentry
- An alternative to New Relic and Sentry: Atatus
Tool Overview
What is New Relic?
New Relic is a full-stack observability platform built for engineering teams that need visibility across applications, infrastructure, and logs in a single interface. It covers APM, real user monitoring, infrastructure monitoring, log management, synthetic monitoring, and AI-powered anomaly detection under one roof.
It's best suited for mid-size to large teams who need to correlate performance issues across multiple services and layers of their stack. With 750+ integrations and support for 50+ languages, it fits into virtually any environment. The tradeoff is complexity and cost. New Relic is a comprehensive platform, and getting the most out of it requires configuration and familiarity with the UI.
What is Sentry?
Sentry is a developer-first error tracking and performance monitoring platform. Its core strength is giving developers precise, actionable information about what broke in their code like full stack traces, source code mapping, release tracking, and user context, so bugs can be diagnosed and fixed fast.
Sentry is intentionally narrower in scope than New Relic. It doesn't monitor infrastructure or provide deep log analytics. What it does, it does very well: capturing, grouping, and contextualizing application errors with minimal setup. It's available as both a cloud-hosted service and a self-hosted open-source deployment, which makes it appealing for teams with data residency requirements.
Product overview
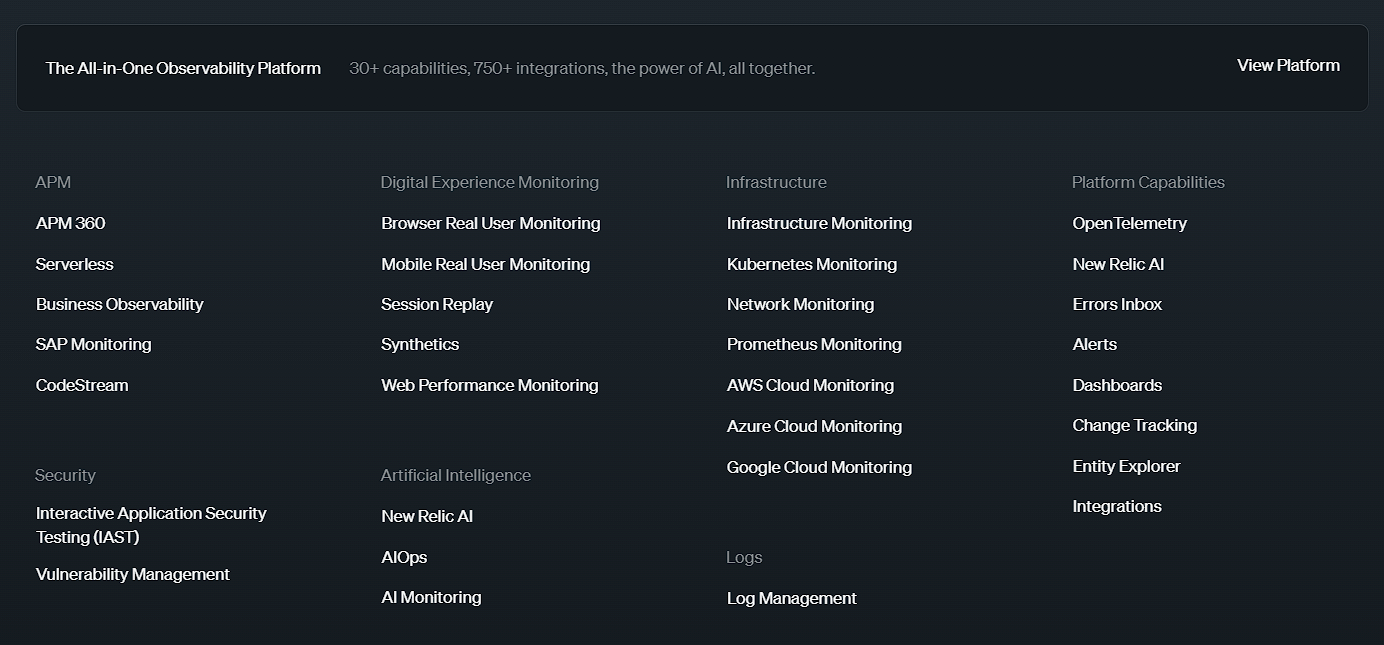
New Relic: Product overview
- APM (Application Performance Monitoring): Monitors the performance and availability of applications to ensure optimal functionality and user experience.
- Digital Experience Monitoring: Tracks and analyzes user interactions with digital platforms through real user monitoring, synthetics, web performance, and session replay.
- Infrastructure: Oversees the health and performance of infrastructure components including servers, Kubernetes, networks, and cloud services (Google Cloud, Azure, AWS).
- Security: Provides integrated monitoring to detect and respond to security threats and vulnerabilities.
- Artificial Intelligence: Utilizes AI to deliver insights and detect anomalies in application and system performance.
- Logs: Aggregates and analyzes log data from various sources to support troubleshooting and performance monitoring.
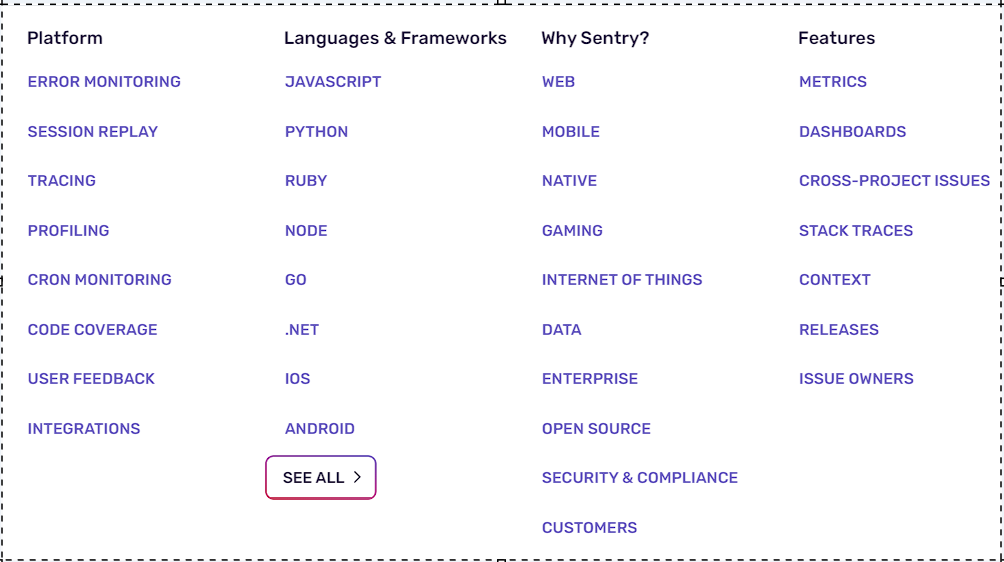
Sentry: Product overview
- Error Monitoring: Provides actionable insights to track, debug, and resolve code-related issues across any language or framework.
- Session Replay: Allows you to quickly identify issues by replaying real user sessions with privacy controls.
- Tracing: Follows the complete path of a request through systems and services to identify the specific function or API call causing issues.
- Profiling: Delivers code-level performance insights for your application while it's in production.
- Cron Monitoring: Alerts you to failed or flaky cron jobs, helping you identify and fix issues in your code.
- Code Coverage: Highlights untested or partially covered code directly in your stack trace to prevent future errors.
- User Feedback: Gathers real-time user feedback with debugging context, including session replay and device tags, to diagnose issues and their impact.
New Relic vs Sentry: Key Differences and Common Features
The table above shows the feature gap clearly: New Relic covers significantly more ground (infrastructure, RUM, log management), while Sentry has depth in areas New Relic lacks (code profiling, cron monitoring, code coverage). Neither tool is objectively better, the right choice depends on what your team needs most.
| Feature | New Relic | Sentry |
|---|---|---|
| APM | ✅ | ✅ |
| Infrastructure Monitoring | ✅ | ❌ |
| Log Management | ✅ | 🟡 |
| Real User Monitoring | ✅ | ❌ |
| Error Monitoring | ✅ | ✅ |
| Cron Monitoring | 🟡 | ✅ |
| Session Replay | ✅ | ✅ |
| Tracing | ✅ | ✅ |
| Profiling | ❌ | ✅ |
| Alerting | ✅ | ✅ |
| OpenTelemetry Support | 🟡 | 🟡 |
| Free Trial | ✅ | ✅ |
Initial Setup
New Relic
Getting started with New Relic is straightforward for a platform of its size. Sign up for a free account, select your language or framework, and follow the guided APM installation, a code snippet installs the language agent and optionally the infrastructure agent with logging enabled. The automated installer handles most of the configuration. Within a few minutes of generating traffic, data starts flowing into the APM Summary dashboard with no manual setup required.
The initial experience is well-designed, but the platform's breadth can be overwhelming at first. New Relic has dozens of capabilities, and new users will likely need time to navigate the interface before they know where to look for what they need.
Sentry
Sentry's setup is the fastest of any monitoring tool in this category. Create a project, choose your platform, and you get a DSN key and a code snippet. Add the SDK and the key to your app — that's it. Unhandled exceptions are captured and reported automatically from that point on, with no additional configuration needed.
For handled errors, Sentry provides explicit capture methods (e.g., Sentry.captureException()). Adding user context and custom tags takes a few extra lines but meaningfully enriches the error data. The whole setup, including initial configuration, can be done in under 10 minutes for most frameworks.
Application Performance Monitoring(APM)
New Relic
New Relic's APM is one of the most comprehensive available. The APM 360 summary view shows issues, deployments, service levels, and vulnerabilities in a single dashboard, no screen-switching required. It captures transaction traces, slow database queries, external service calls, and error rates in real time.
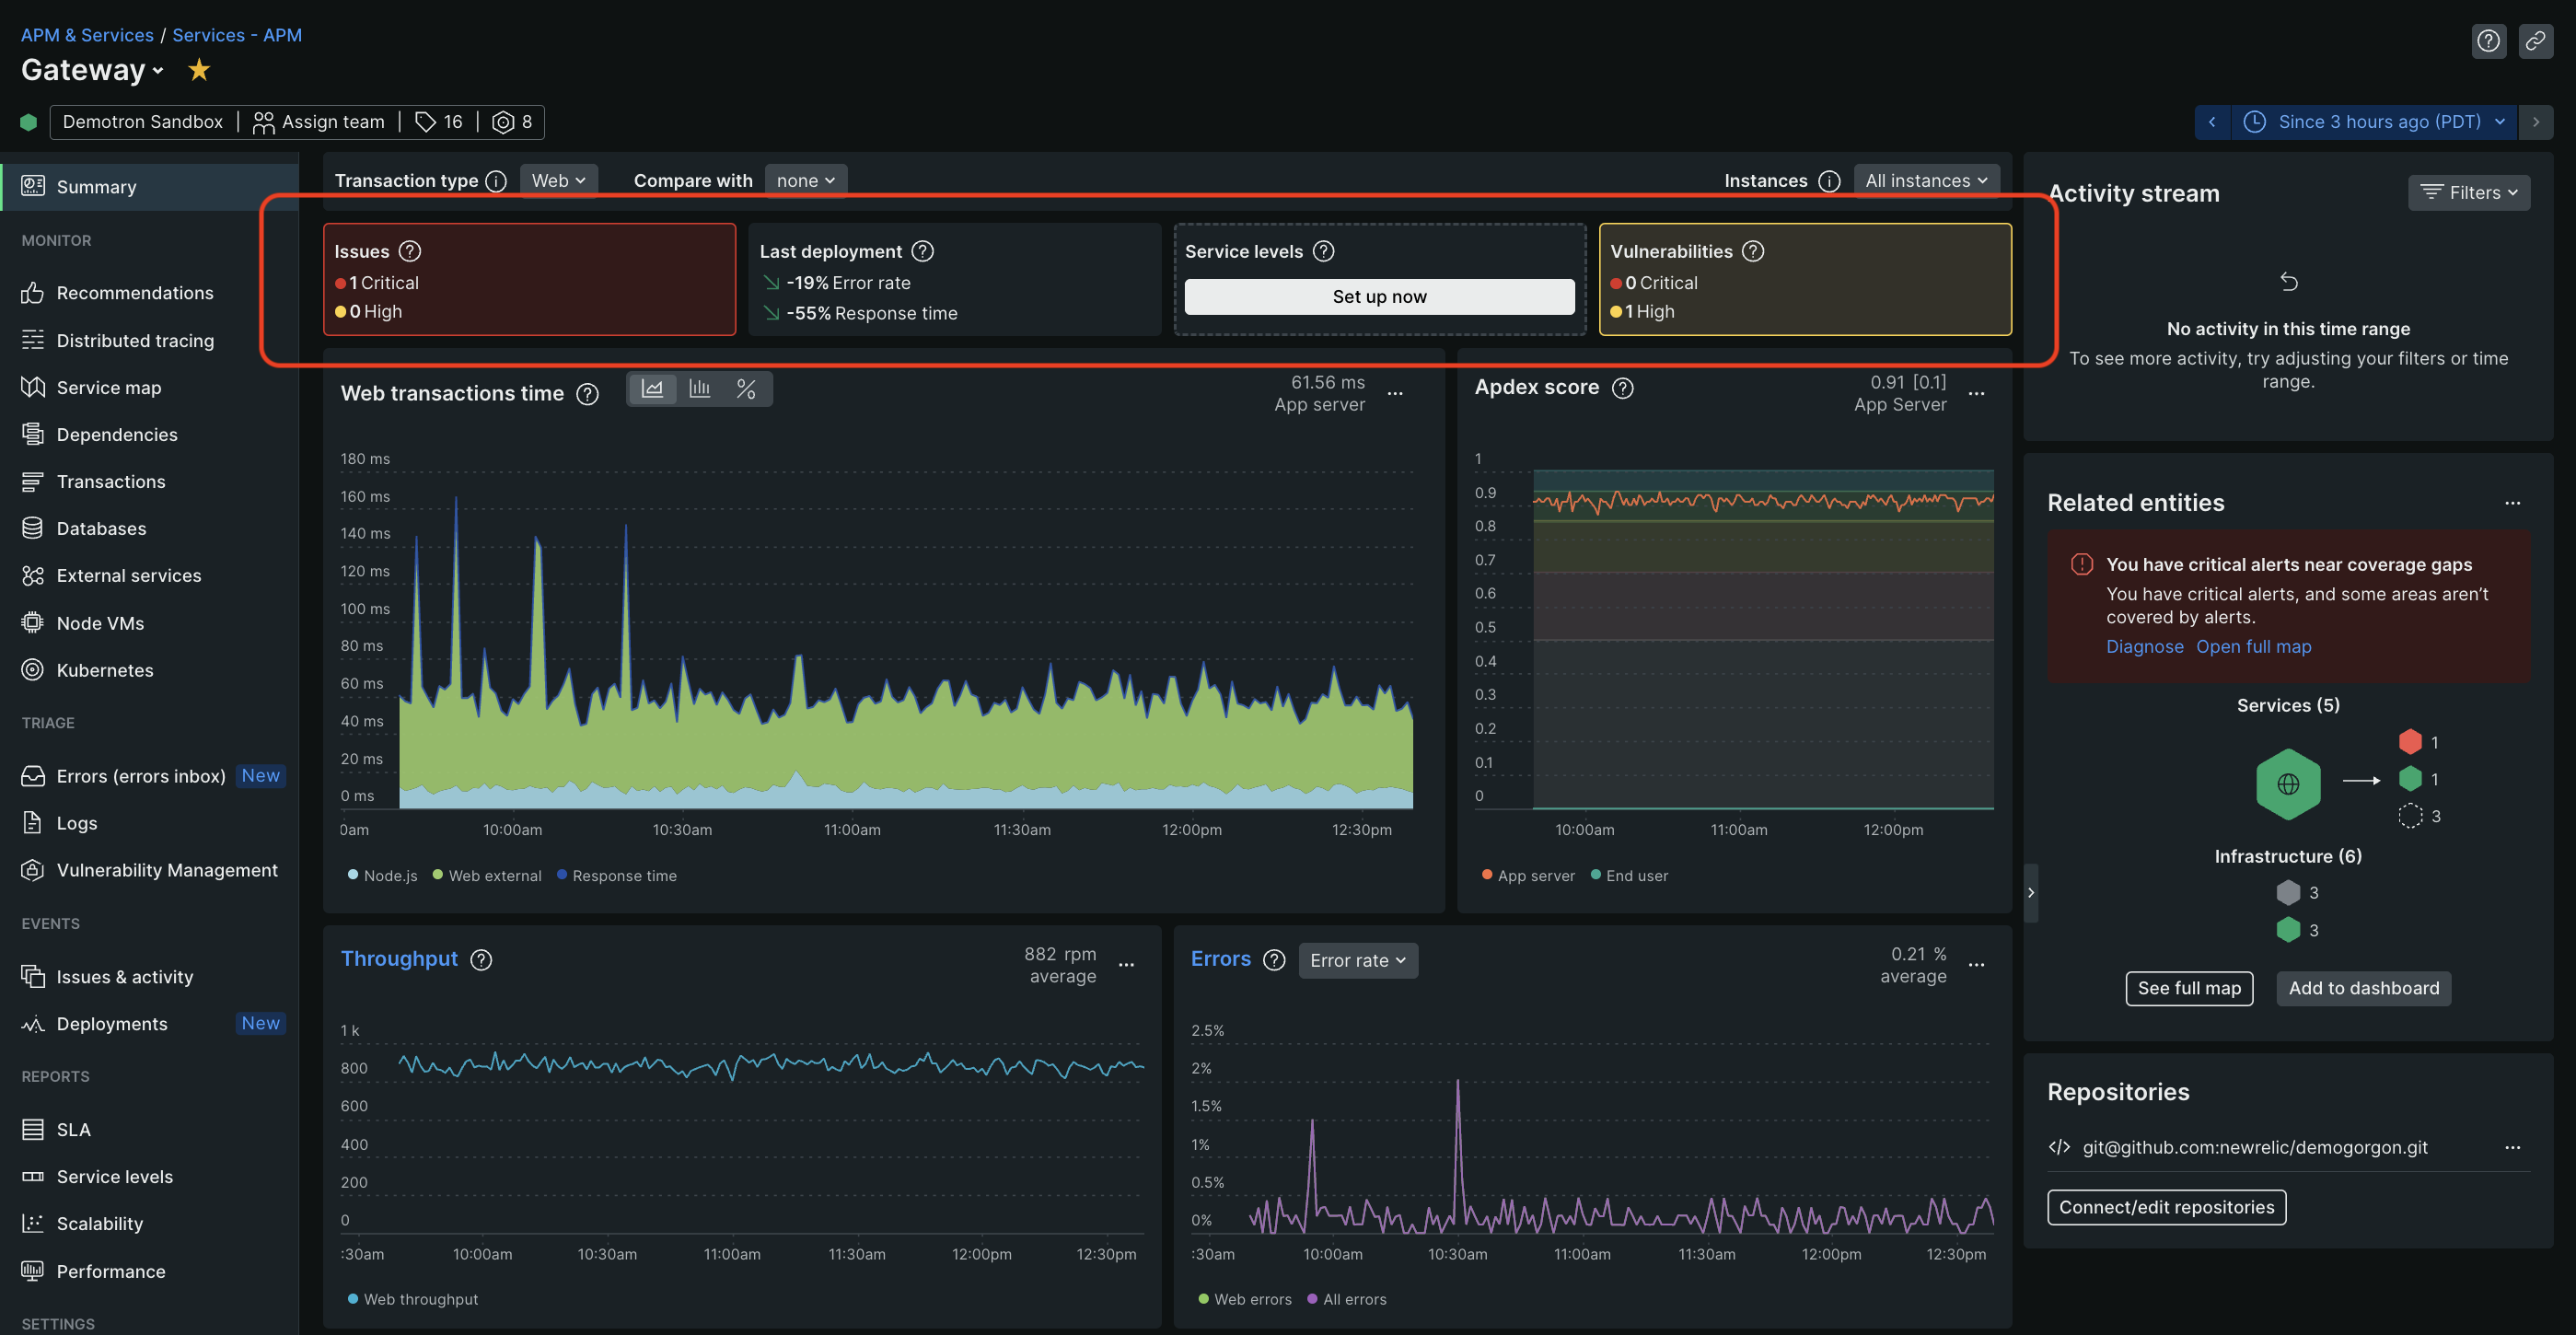
What makes New Relic's APM stand out is its breadth of context. Because it also monitors infrastructure and logs, you can trace a performance issue from the application layer down to the host, container, or database causing it. This cross-layer correlation is something Sentry simply can't do.
Sentry
Sentry's performance monitoring covers throughput, latency, and distributed tracing across transactions and spans. It automatically detects and groups common performance issues — N+1 queries, slow API calls, and large file loads — similar to how it handles errors. The Performance page offers detailed filtering so you can focus on specific transactions or time ranges.
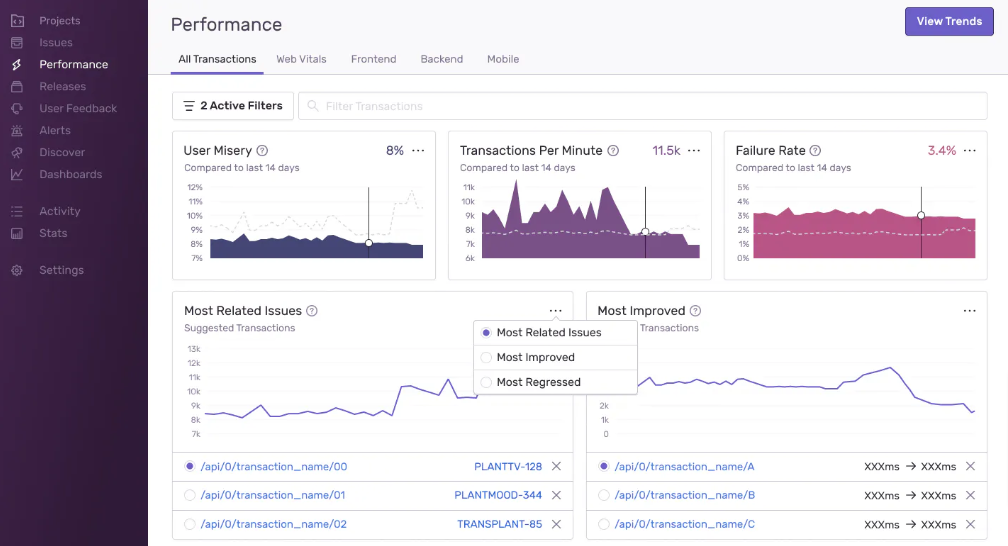
Sentry's APM is solid for application-level insights, but it stops at the application boundary. There's no visibility into the infrastructure running your app, no host-level metrics, and no log correlation. If a slow endpoint is caused by a database running out of memory on its host, Sentry won't tell you that.
Error Monitoring
New Relic
New Relic's Errors Inbox groups errors by fingerprint, events sharing the same root cause are consolidated into a single error group, keeping the inbox manageable even under high error volume. Each group stores long-term metrics, activity logs, and discussion threads alongside full error context. Clicking into a group opens a detailed view with timestamps, affected users, host details, and related logs.
The fingerprinting system is rule-based and managed by New Relic, which works well in most cases but offers less customization than Sentry's grouping controls. Integration with APM means errors are always viewed alongside performance context.
Sentry
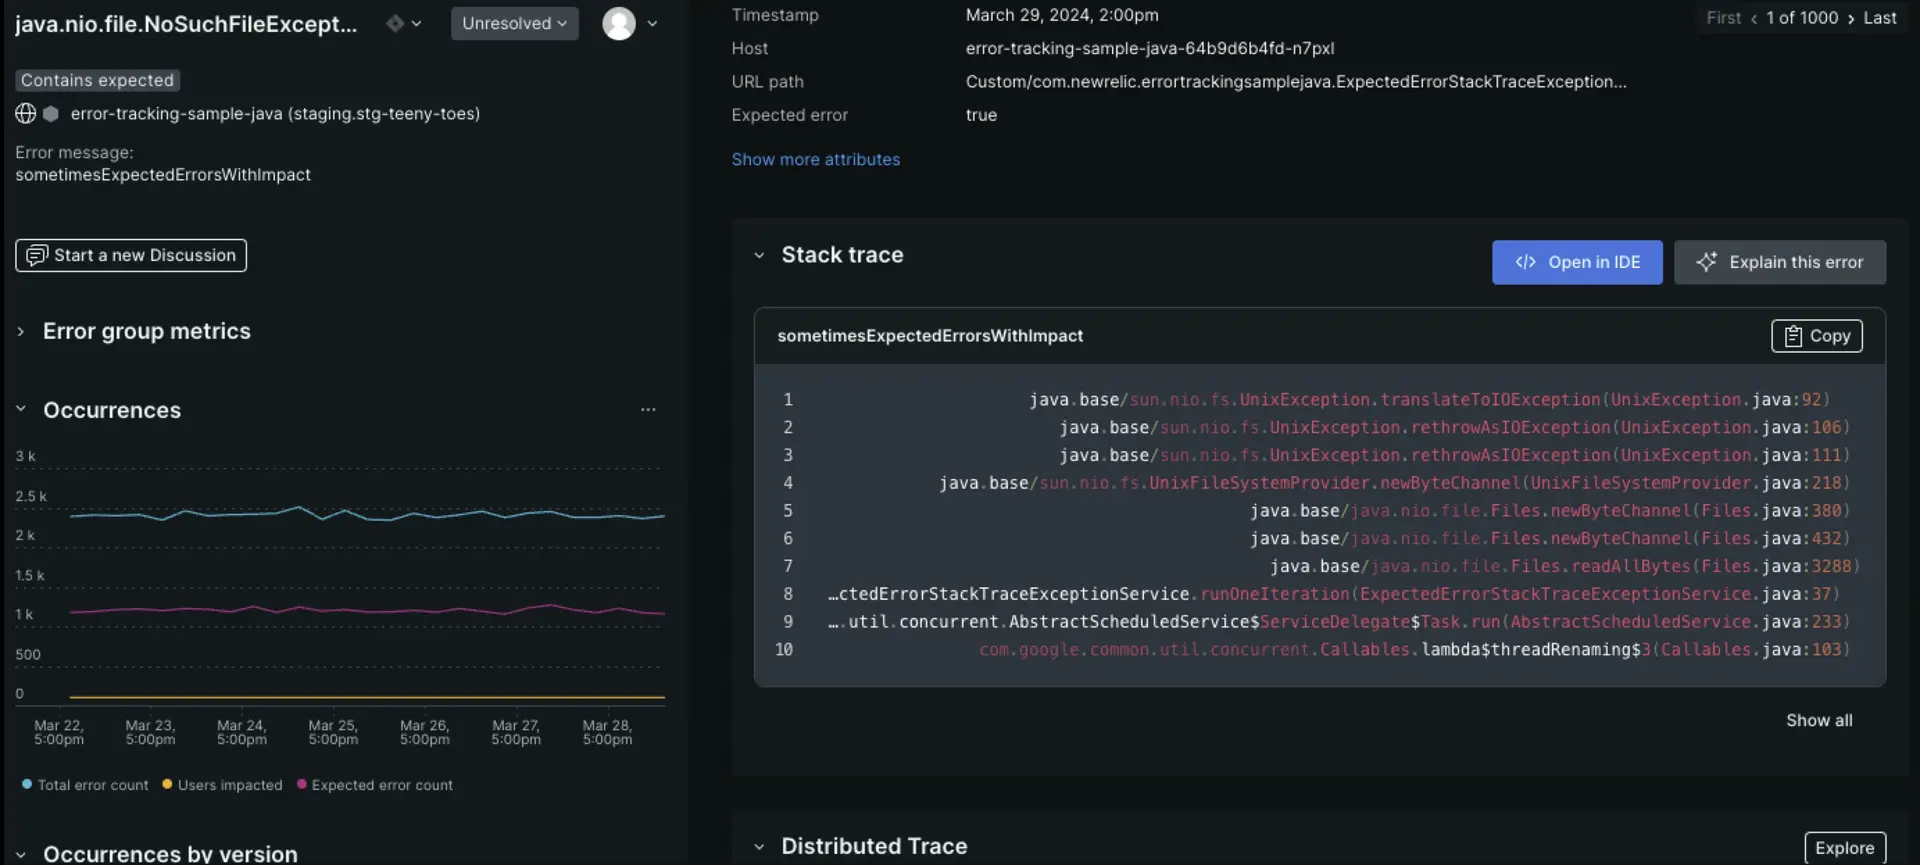
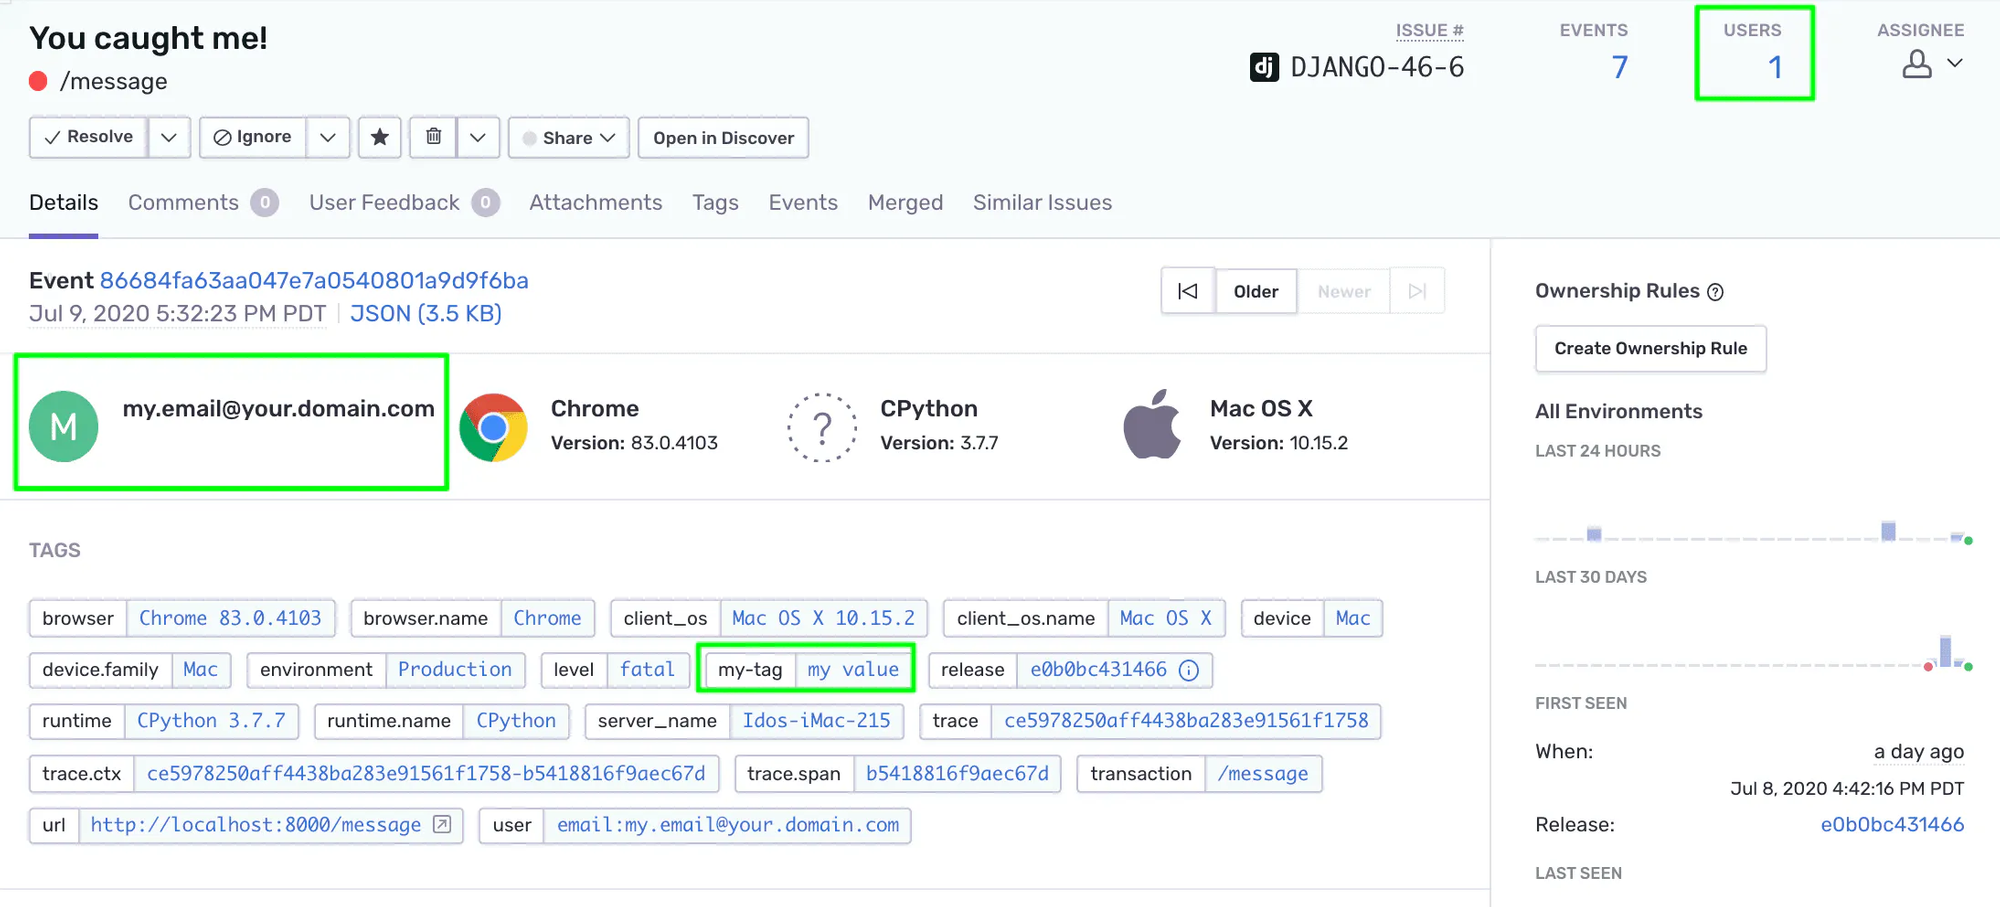
Error monitoring is where Sentry is most mature. It captures unhandled exceptions automatically and gives developers immediate access to full stack traces, source-mapped to the original code.
Custom tags and user context can be attached to any error, and Sentry's issue grouping is highly configurable, teams can write custom fingerprinting rules or accept AI-suggested groupings.
Session Replay
New Relic
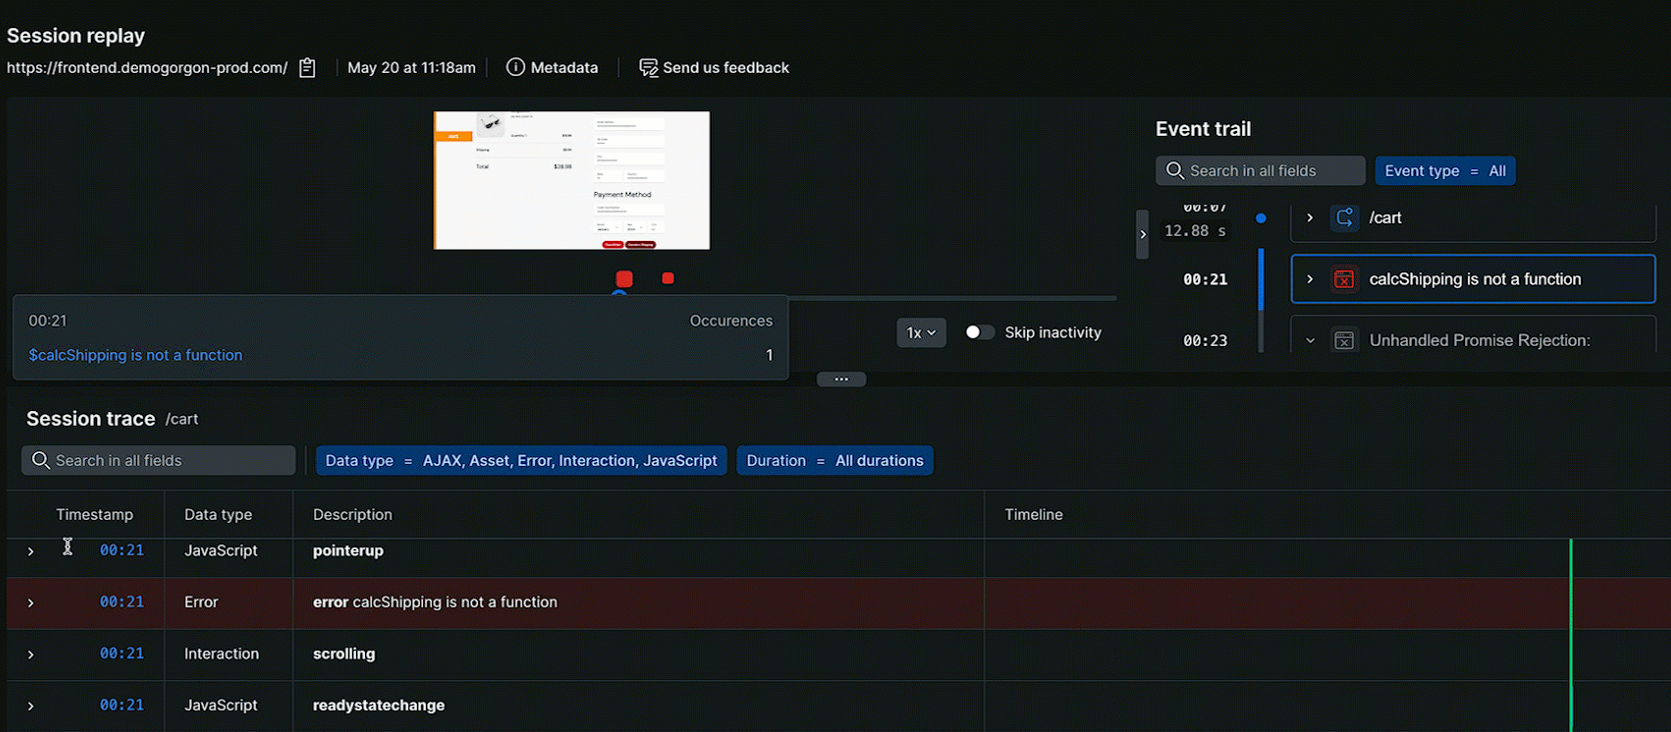
New Relic's session replay is accessible directly from the Browser monitoring section, no extra SDK installation needed beyond the standard Browser agent. Session replays appear in two places: the dedicated Session Replay page and inline on the Errors Inbox page, where you can watch the exact user session that triggered a specific error. This integration between replays and errors is genuinely useful and speeds up root-cause analysis.
Sentry
Sentry's session replay requires the browser SDK or a framework-specific package (e.g., @sentry/react) to be installed and configured before it works. The setup is more involved than New Relic's, but once in place, the replay quality is strong. You get video-style playback of user interactions alongside breadcrumbs showing exactly what the user did before the error occurred. Advanced privacy controls let you mask sensitive input fields automa
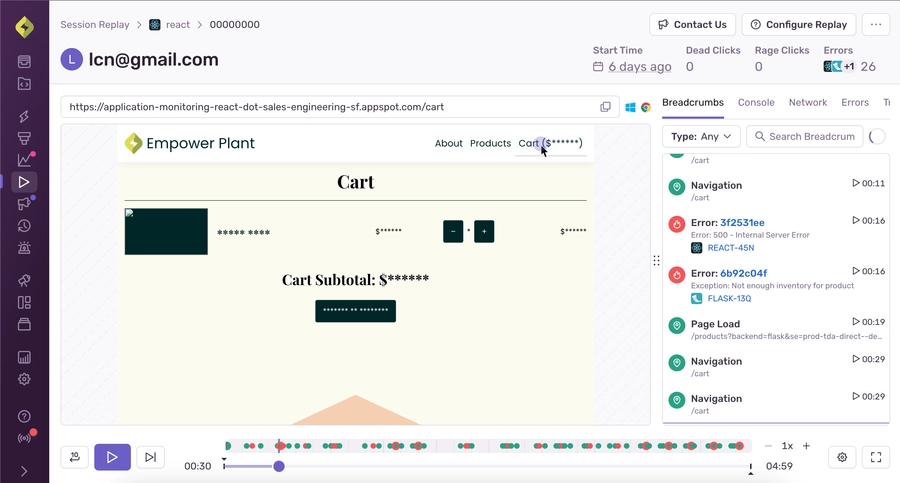
tically.
Pricing
New Relic Pricing
New Relic uses a usage-based pricing model with two main cost dimensions: data ingest and user seats.
The free tier is generous - 100 GB of data ingest per month covers many small to mid-size applications. Costs scale with data volume and team size, which can be unpredictable as usage grows. A 10-person team with full platform access can expect to pay $990-$1,200/month in user seats alone before data costs.
Sentry Pricing
Sentry's pricing is based on event volume (errors, transactions, replays) and user seats, with a tiered plan structure.
Sentry's event-volume model is predictable for teams with stable traffic, but can spike unexpectedly during incidents, exactly when you need the tool most. The Team plan at $26/month is an accessible entry point for small teams. Costs increase as you add error volume, performance monitoring, and session replays.
When to Choose New Relic vs Sentry?
Choose New Relic if:
- You need full-stack visibility: New Relic connects application errors to infrastructure health, logs, and user experience in a single platform. If you need to answer 'why is this slow?' at every layer of your stack, New Relic is the stronger tool.
- You're running microservices or cloud infrastructure: New Relic's infrastructure monitoring, Kubernetes support, and distributed tracing make it well-suited for complex cloud-native environments.
- Your team is large or cross-functional: New Relic's dashboards and alerting work well for DevOps, SRE, and platform engineering teams who need shared visibility across services.
- You want AI-powered anomaly detection: New Relic's AI surfaces issues proactively, before they escalate into incidents, useful for teams that can't manually watch every metric.
Choose Sentry if:
- Error debugging is your primary need: Sentry's source-mapped stack traces, release tracking, and custom tagging make it the best tool for developers who want to fix bugs fast.
- You're a small team or startup: Sentry's free plan is generous, setup is fast, and the core error tracking workflow is intuitive, ideal for teams that need value without complexity.
- You need code-level performance insights: Sentry's profiling feature provides production code profiling that New Relic doesn't offer, helping you find slow functions at the code level.
- You have self-hosting or data residency requirements: Sentry's open-source, self-hostable architecture is a strong advantage for teams that can't send data to a third-party SaaS platform.
Consider both if:
Some teams run Sentry for developer-facing error tracking and New Relic for infrastructure and platform observability, using each where it's strongest. This is more common in larger organizations with dedicated platform teams.
An alternative to New Relic and Sentry: Atatus
If you've read this far and neither New Relic nor Sentry fully fits your needs. New Relic is too expensive or complex, Sentry is too narrow, Atatus is worth a close look.
Atatus is a full-stack observability platform that sits in between these two tools in terms of scope and price. It covers the key capabilities that make New Relic powerful such as APM, real user monitoring, infrastructure monitoring, and log management, but at a significantly lower and more predictable price point. And it handles error monitoring with the same depth and code-level context that makes Sentry valuable.
How Atatus compares to New Relic and Sentry directly:
The key advantage of Atatus is pricing clarity. Unlike New Relic's user-seat model (which scales steeply with team size) or Sentry's event-volume model (which spikes during incidents), Atatus charges per host, a model that scales predictably as your infrastructure grows.
Atatus also includes log management natively and correlates logs directly with APM traces and errors, giving you the cross-layer visibility New Relic offers at a fraction of the cost, without the complexity.
New to Atatus? Try it out with a 14-day free trial.
#1 Solution for Logs, Traces & Metrics
![]() APM
APM
![]() Kubernetes
Kubernetes
![]() Logs
Logs
![]() Synthetics
Synthetics
![]() RUM
RUM
![]() Serverless
Serverless
![]() Security
Security
![]() More
More


