Mastering NGINX Monitoring: Comprehensive Guide to Essential Tools

NGINX, is a versatile open-source web server, reverse proxy, and load balancer, stands out for its exceptional performance and scalability. Monitoring Nginx is pivotal for maintaining its optimal functionality.
By tracking and analysing performance, including real-time insights into server health, resource utilization, and user requests, administrators can proactively identify issues. This monitoring process is essential not only for optimizing server performance but also for ensuring a seamless web application experience.
To facilitate Nginx monitoring, various tools come into play. In this blog, we will explore some of the essential tools for monitoring NGINX. NGINX monitoring tools play a crucial role in providing administrators with the necessary insights and analytics to efficiently manage and optimize NGINX servers.
From real-time metrics to proactive issue identification, these tools contribute to a robust monitoring strategy, ensuring the reliability and performance of web applications.
- NGINX Monitoring
- Importance of NGINX Monitoring
- NGINX Monitoring Tools
- Key Considerations for Choosing an NGINX Monitoring Solution
NGINX Monitoring
Nginx, pronounced stands as a versatile and powerful open-source web server that has evolved beyond its initial role to encompass various critical functions in web infrastructure. Conceived by Igor Sysoev, the first public release of Nginx occurred in October 2004. Originally developed to address the C10k problem, which pertains to the challenge of efficiently handling 10,000 concurrent connections, Nginx has since become a pivotal component in modern web hosting and deployment.
Its primary role as a web server is augmented by its multifaceted capabilities as a reverse proxy, HTTP cache, and load balancer. Nginx's architecture emphasizes performance, scalability, and resource efficiency, making it exceptionally well-suited for serving static content and efficiently managing a large number of simultaneous connections. This adaptability extends to its role as a reverse proxy, where Nginx excels in optimizing communication between clients and backend servers. Additionally, its function as an HTTP cache enhances response times by storing frequently accessed content.
As a load balancer, Nginx excels in distributing incoming web traffic across multiple servers, ensuring optimal resource utilization and preventing any single server from becoming a bottleneck. The software's modular design and flexibility have propelled its widespread adoption, becoming a cornerstone in the architecture of many websites and applications, providing a robust and scalable foundation for handling diverse workloads. Overall, Nginx stands as a reliable, high-performance solution for modern web infrastructure needs.
Importance of NGINX Monitoring
NGINX serves as the entry point for applications, any errors or performance issues it allows can result in substantial revenue loss or a breach of your application's service level indicators. Therefore, monitoring NGINX is crucial. By setting up alerts for emerging issues, you can promptly diagnose and address problems. In essence, NGINX monitoring is a preventive strategy to detect and resolve issues before they escalate.
Additionally, monitoring NGINX is vital for optimal web performance, helping identify bottlenecks, optimize resource usage, and enhance security. It ensures server availability, aids in capacity planning, and contributes to a seamless user experience. Troubleshooting is expedited through detailed metrics, and as a load balancer, NGINX optimization is facilitated. This continuous monitoring guides decisions for sustained high performance.
NGINX Monitoring Tools
NGINX monitoring tools are essential for ensuring the optimal performance and reliability of NGINX servers. These tools provide real-time insights into key metrics like server health, traffic, and response times, enabling administrators to identify issues and proactively address potential bottlenecks. Here are some of the tools discussed below that facilitate improved server management, efficient troubleshooting, and configuration optimization for a seamless web hosting experience.
1. Atatus
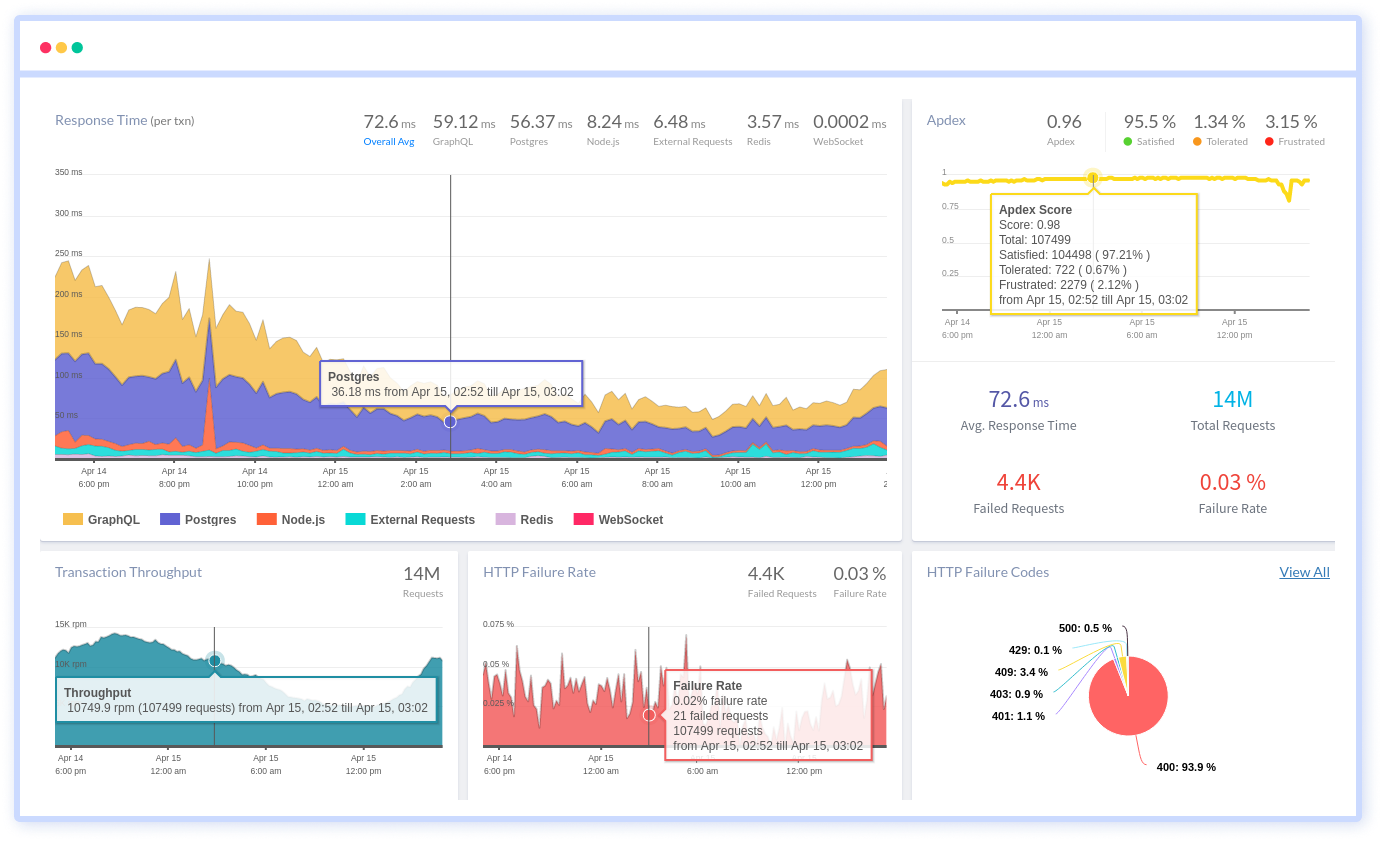
Atatus now includes Nginx monitoring as a plugin in its infrastructure monitoring offering, it's a valuable addition for users managing Nginx web servers.
This integration likely allows users to track and analyse key metrics related to Nginx server performance, request handling, and resource utilization within the Atatus platform.
The NGINX module is included with the Atatus Infra agent by default, please follow the below steps to enable.
- Copy the NGINX example configuration file.
cd /etc/atatus-infra-agent/conf.d/nginx.d/
sudo cp nginx.yml.template nginx.yml- Update the file
/etc/atatus-infra-agent/conf.d/nginx.d/nginx.ymlwith below configurations.
# Metrics section
metrics:
      # Nginx hosts
    - hosts: ["http://127.0.0.1"]

      # Path to server status. Default nginx_status
#status_path: "nginx_status"- Restart the atatus infrastructure agent.
sudo service atatus-infra-agent restartBenefits
- User-Friendly Dashboards
- Security Monitoring
- Quick issue detection and resolution
2. Sematext
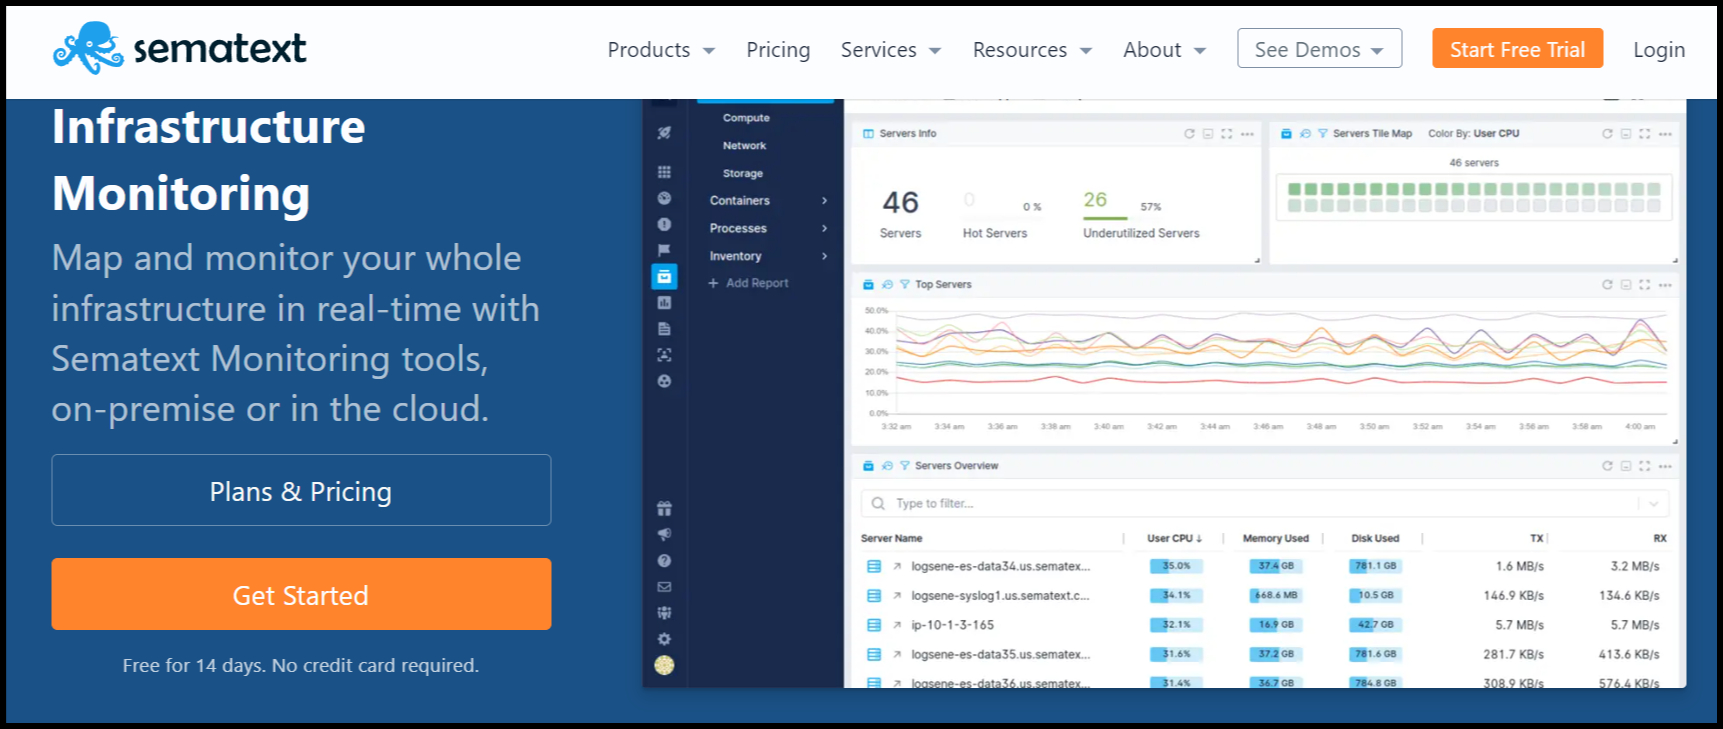
Sematext Monitoring is a versatile infrastructure monitoring tool that excels in real-time NGINX performance monitoring, encompassing key metrics like requests per second, upstream response details, caching, and SSL offloading.
With Sematext Nginx Monitoring, users can easily identify performance bottlenecks, troubleshoot issues, and optimize server configurations to ensure optimal web server performance. Sematext incorporates advanced functionalities that expedite troubleshooting, including features like alerting, anomaly detection, and log correlation.
The cost for metrics collection stands at $3.6 per container host per month, with Pro pricing set at $5.76 per container host monthly. Standard pricing for integrations is $10.08 per agent per host, while the Pro tier is priced at $15.12 per agent per host.
Benefits
- Effortless Integration
- Flexible Data Handling
- User-Friendly Dashboards
Limitations
- Absence of Network Maps
- No Self-Hosted Option
3. New Relic
The New Relic Nginx quickstart introduces comprehensive monitoring features, including proactive dashboards that track vital metrics like requests per second and active connections. With automatic on-host integration instrumentation, it seamlessly supports both NGINX Open Source and NGINX Plus.
Serving as a complete Nginx performance monitoring tool, it collects and transmits inventory and metrics to the New Relic platform, enabling users to derive valuable insights, query data, and establish alert conditions. The integration also delivers aggregated error reports for HTTP error responses, providing early warnings for potential issues.
Compatible with NGINX on Ubuntu servers, Kubernetes, or Amazon ECS, this tool facilitates efficient monitoring and optimization for a healthy NGINX server, ensuring a seamless user experience for web applications.
Benefits
- Pre-built Dashboards
- Auto-discovery of NGINX boxes
- SSL Handshake Metrics
Limitations
- No Self-Hosted Solution
- Cost Implications
- Limited Upstream Metrics
4. Datadog
Datadog offers a comprehensive and customizable monitoring solution by enabling users to build graphs and set up alerts based on various parameters such as hosts, services, processes, and metrics. This flexibility allows users to monitor specific subsets of their infrastructure, whether it be NGINX hosts, those within a designated availability zone, or focus on a singular key metric shared across hosts with a specific tag.
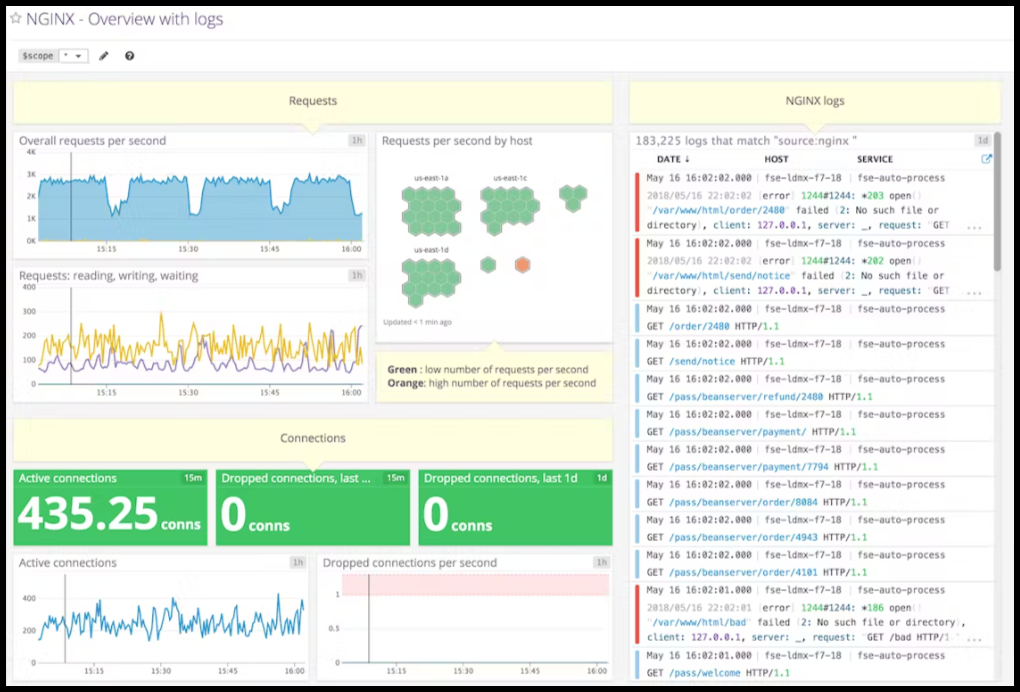
This capability ensures that users can seamlessly integrate NGINX performance metrics into their overall monitoring strategy, gaining a holistic view alongside other systems. Moreover, Datadog supports the monitoring and analysis of NGINX logs, providing users with a complete understanding of their system's behaviour.
Benefits
- Users can customize to their specific needs
- AWS Lambda Support
Limitations
- Costly with Limited Custom Metrics
- Steep learning curve for new users
5. SolarWinds Server & Application Monitor
SolarWinds Server & Application Monitor (SAM) is a robust NGINX performance monitoring tool, meticulously tracking key metrics like requests per second, connection status, and server errors.
Beyond network oversight, SAM provides quality metrics like round-trip time. It prevents server overloads by offering insights into NGINX statistics, covering load balancing, client connections, CPU, and memory usage. SAM visualizes dependencies, facilitating quick comprehension of cross-server communication.
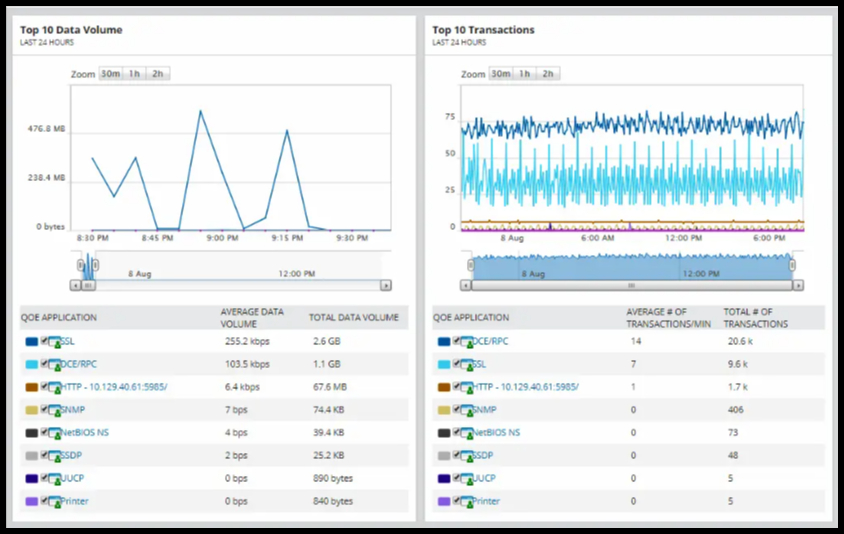
Its standout feature is cross-stack IT data correlation for in-depth troubleshooting. SAM empowers users with intelligent alerts, ensuring swift detection and resolution of web server issues, fostering an efficient and responsive monitoring environment.
Benefits
- Easy setup
- Comprehensive Performance Metrics
- Increased stability
Limitations
- Absence of built-in support for Kubernetes or container platforms
- Overkill for small-scale deployments with limited infrastructure
6. Dynatrace
Dynatrace offers comprehensive web server monitoring with deep visibility into process groups, applications, and services. The anomaly-detection engine swiftly identifies and correlates issues by analysing host and network metrics, coupled with web-server specific data. The interactive infographic provides meta information, availability metrics, and events like deployments.
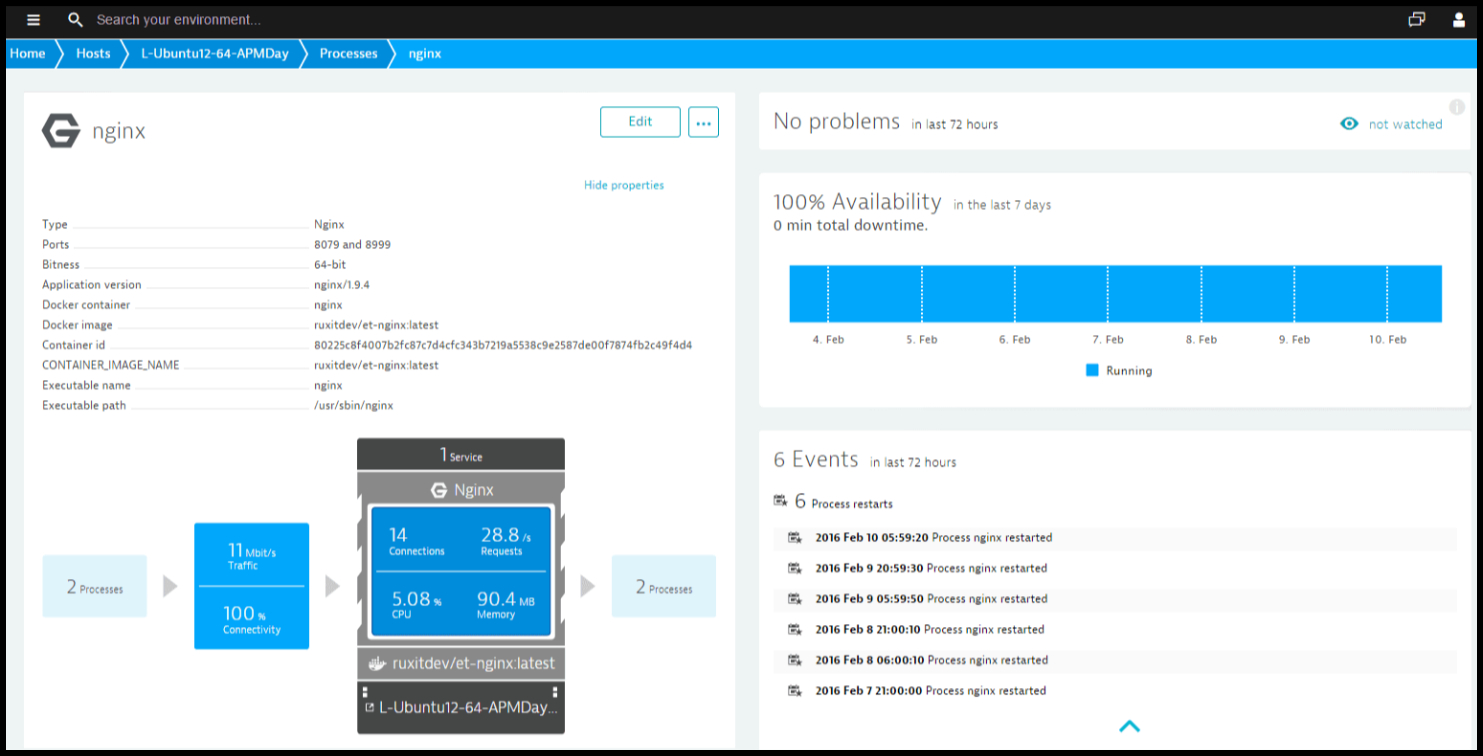
Dynatrace covers Nginx details, including requests, response sizes, connections, and system performance metrics. With Nginx Plus, additional functionalities like server zones, upstreams, and cache metrics are available. The full stack monitoring auto-detects Nginx servers, offering a holistic view of application topology. AI-driven notifications address root causes efficiently.
Benefits
- Dynatrace provides end-to-end visibility, from web servers to dependencies, enabling a comprehensive understanding of application performance.
- The AI-driven anomaly detection and single-notification approach streamline the troubleshooting process, saving time and facilitating quicker issue resolution.
Limitations
- Dynatrace's extensive features may be overwhelming for smaller applications, leading to a steeper learning curve.
- The advanced functionalities come with a cost, potentially making Dynatrace a less budget-friendly option for some organizations.
7. AppDynamics
AppDynamics is a comprehensive application performance monitoring (APM) solution that helps organizations monitor and optimize the performance of their applications and infrastructure. When it comes to Nginx, a popular web server and reverse proxy server, integrating AppDynamics can provide valuable insights into its performance.
AppDynamics empowers users to generate precise alerts with granular control, allowing for their dissemination through various channels such as email, PagerDuty, and Webhook. Additionally, the platform supports seamless integration with the Elasticsearch API and AWS Lambda, enabling the ingestion of metrics. This versatile alerting mechanism ensures that critical notifications reach the right stakeholders through preferred communication channels, enhancing the platform's adaptability to diverse operational workflows.
Benefits
- The platform's pre-built dashboards are user-friendly, requiring minimal customization.
- AppDynamics supports scalability planning for effective capacity management.
- It provides holistic end-to-end visibility across the application stack for effective issue resolution.
- User experience monitoring tools in AppDynamics enhance overall satisfaction.
Limitations
- The platform may have a learning curve, particularly for users new to it.
- The free version of AppDynamics may lack access to advanced features.
- Dependency on third-party integrations introduces potential complexities.
- Cost implications may pose challenges for smaller organizations.
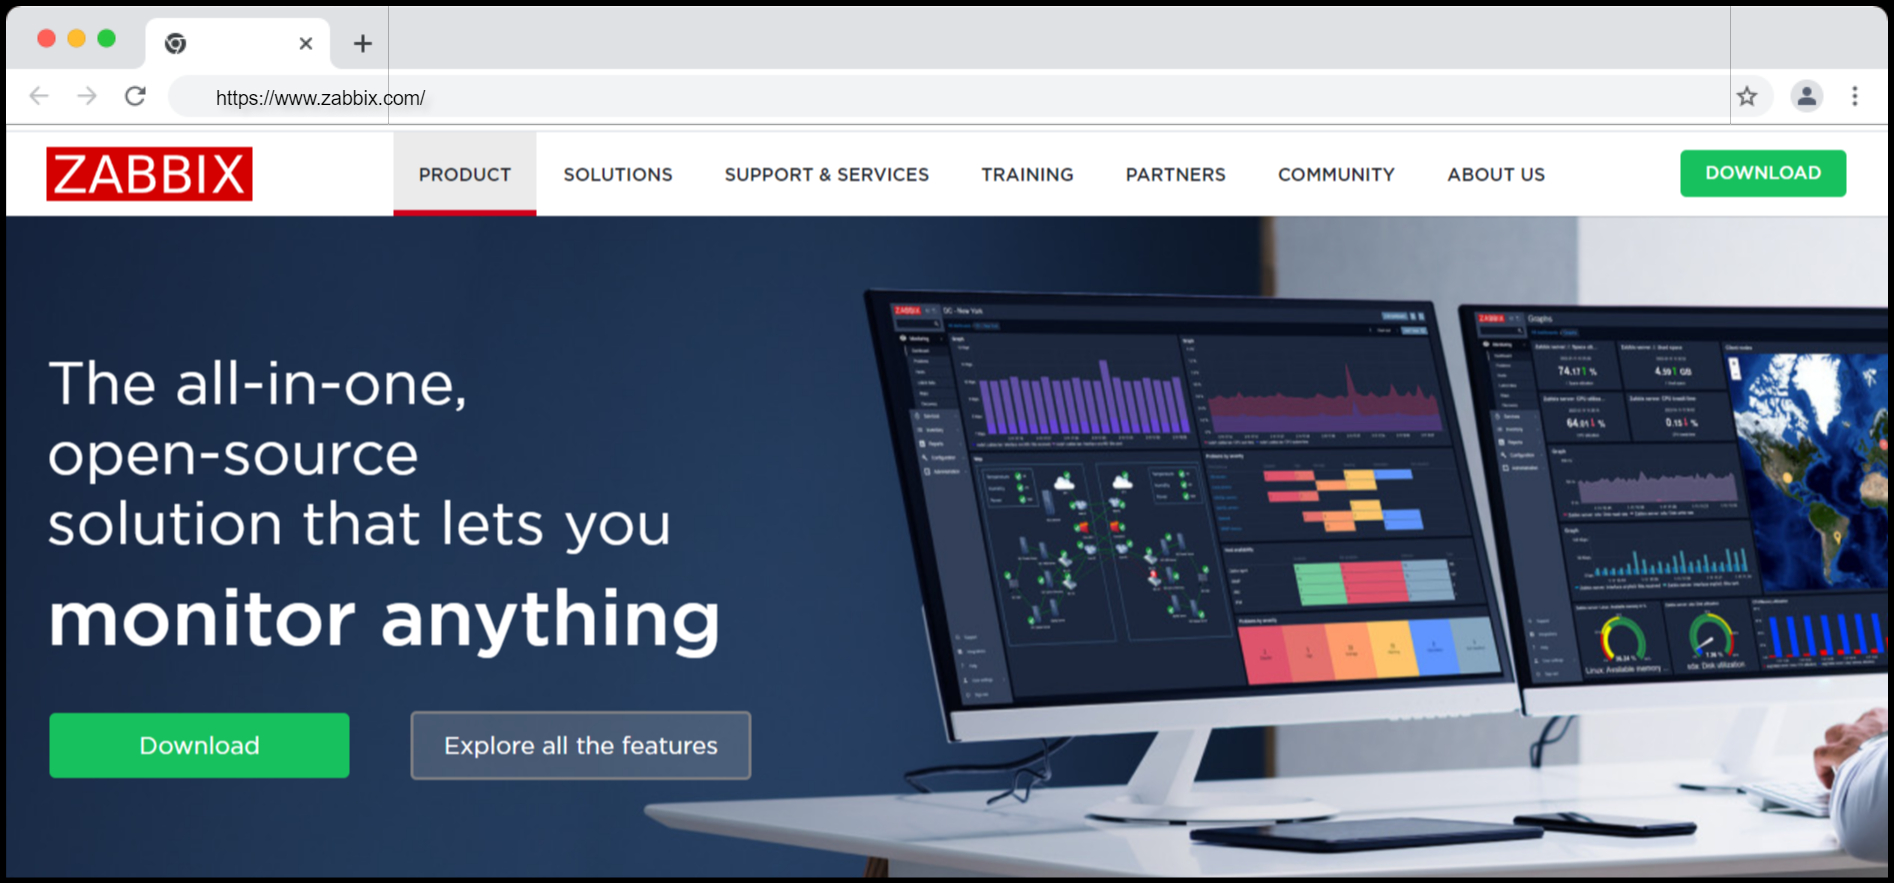
Zabbix
Zabbix stands as a powerful, adaptable open-source monitoring solution, empowering organizations to vigilantly oversee and administer their IT infrastructure, notably including pivotal components such as Nginx web servers. Nginx, celebrated for its high-performance web-serving capabilities, experiences a notable augmentation in capability through its integration with Zabbix's monitoring expertise.
Zabbix's Nginx monitoring guarantees the ongoing health and peak performance of web servers by actively gathering and scrutinizing essential metrics. Through Zabbix, administrators acquire real-time insights into crucial aspects of Nginx, such as resource utilization, response times, and error rates. This capability enables a proactive stance in issue resolution and the optimization of performance.
Additionally, Zabbix's historical data storage and reporting features empower administrators to delve into comprehensive analysis and generate performance reports, facilitating capacity planning and trend forecasting. This collaborative integration between Zabbix and Nginx monitoring establishes a resilient solution that not only guarantees the dependability and accessibility of web services but also equips organizations to make well-informed decisions for ongoing enhancement and scalability.
Benefits
- Comprehensive monitoring of diverse IT components.
- Real-time insights for prompt issue resolution.
- User-friendly dashboards with customization options.
- Proactive alerting minimizes downtime risks.
- Historical data analysis aids in planning and forecasting.
Limitations
- Complex setup with a learning curve.
- Resource-intensive, especially in larger deployments.
- Steep learning curve for advanced features.
- Limited native integrations for specific technologies.
- Requires regular maintenance for optimal performance.
Key Considerations for Choosing an NGINX Monitoring Solution
Choosing the right NGINX monitoring solution requires careful consideration of several key criteria. Firstly, prioritize solutions that offer ease of installation and configuration to streamline the setup process. Ensure compatibility with your NGINX version and look for real-time monitoring capabilities to swiftly identify and address issues. The monitoring tool should collect essential metrics such as request rate, response time, error rate, and resource utilization.
Regular updates and maintenance ensure the monitoring solution remains secure and up-to-date. Popular NGINX monitoring tools, including Atatus, Datadog, New Relic, and Dynatrace, each offer unique features catering to diverse monitoring needs. Here are some criteria to consider when choosing an NGINX monitoring solution,
- Ease of Installation and Configuration: Opt for a solution with a user-friendly setup process to save time and minimize misconfiguration risks.
- Compatibility: Ensure the chosen monitoring tool offers timely updates to support the latest NGINX versions.
- Real-time Monitoring: Look for a solution providing real-time insights into NGINX performance, traffic, and error rates.
- Metrics and Data Collection: Select a solution capable of collecting key metrics, including request rate, response time, error rate, CPU and memory usage, and network activity.
- Alerting Capabilities: Choose a monitoring solution that offers customizable alerting features for timely issue identification.
- Security Features: Prioritize solutions with robust security features to safeguard both monitoring data and infrastructure.
- Scalability: Ensure the monitoring solution can scale to handle a growing number of servers, sites, and requests.
- Cost and Licensing: Consider the cost and licensing model, with options ranging from open-source to subscription-based solutions.
Ultimately, the choice depends on your infrastructure size, monitoring preferences, and budget constraints.
Conclusion
Atatus emerges as a compelling choice for NGINX monitoring, particularly due to its user-friendly dashboards, security monitoring capabilities, and quick issue detection and resolution.
The seamless integration of the NGINX module into the Atatus Infra agent simplifies the monitoring setup, ensuring administrators can effortlessly track and analyze key metrics related to server performance, request handling, and resource utilization.
With a focus on providing a valuable addition to users managing NGINX web servers, Atatus stands out for its commitment to delivering a robust monitoring strategy, ultimately contributing to the reliability and optimal performance of web applications.
Sematext offers real-time performance insights with advanced troubleshooting features, while New Relic provides comprehensive monitoring for NGINX on various platforms.
Datadog offers flexibility but can be costly, and SolarWinds SAM provides robust monitoring with easy setup. Dynatrace offers end-to-end visibility but may be overwhelming for smaller applications. Ultimately, the best fit depends on the balance between features, cost, and the scale of the infrastructure.
Enhance Your Server's Performance with Atatus Nginx Monitoring
Nginx performance monitoring offers essential insights into your web server's efficiency and reliability by providing real-time tracking and in-depth analysis of critical Nginx metrics. This continuous monitoring empowers you to proactively address issues, optimize resource allocation, and improve the overall performance and user experience of your web applications.

By closely monitoring request rates, error codes, and server load, you can pinpoint areas for improvement and optimization. Identifying bottlenecks and addressing them promptly ensures that your web server operates at its best, delivering a seamless user experience. It also streamlines resource management, reducing costs and improving scalability for efficient and budget-friendly server operations.
#1 Solution for Logs, Traces & Metrics
![]() APM
APM
![]() Kubernetes
Kubernetes
![]() Logs
Logs
![]() Synthetics
Synthetics
![]() RUM
RUM
![]() Serverless
Serverless
![]() Security
Security
![]() More
More