How to Identify Memory Leaks

You may not be familiar with thinking about the memory usage of your applications as a software developer. Memory is plentiful and usually relatively fast in today's development world. Likely, the programming language you're using doesn't require you to allocate or free memory on your own. However, this does not mean you are safe from memory leaks.
Memory leaks can occur in any application written in any language. Sure, older or "near to the metal" languages like C or C++ have more of them. However, it only takes one visit to a badly optimized web page to realize that even a language like JavaScript can suffer from memory leaks.
In this article, we will explain memory leaks, consequences, how to find memory leaks, ways to prevent them, and More.
We will go over the following:
- What is Memory Leak?
- Memory Leaks in the Business: What Are the Consequences?
- Is There a Way to Tell a Memory Leak?
- How to Prevent Memory Leaks?
- Effects of Memory Leaks
- Using the Resource Monitor in Windows
- Limitations of Window's Resource Monitor
What is Memory Leak?
A memory leak occurs when a programmer produces vast amounts of memory but fails to release any of it. When we talk about memory, we're referring to random-access memory (RAM) rather than long-term storage. If an application demands more memory without releasing any, the server's memory pool will be drained over time. As a result, the application may crash if it uses more memory in the future.
However, even if you have enough RAM and aren't running resource-intensive software, there may be times when all of your RAM is utilized up and performance suffers. This is referred to as a memory leak, and it occurs when the software fails to properly manage the available RAM.
When the computer is in regular operation, the software dynamically uses RAM, and memory resources are allocated as needed. When a piece of software no longer needs RAM, it is returned so that it can be reassigned to the next application when it is needed. When there is a memory leak, RAM is allotted to the software but not released when it is no longer required.
Memory leaks were common in the past when developers mainly used C and C++. The reason for this is that the developers had to manually free the memory of the application after each use. For developers who had other more important duties to prioritize, this was a stressful habit.
As the application runs, more memory is consumed, and old data is accumulated in the registers. The software eventually comes to a halt, and memory is purposefully freed. However, there are situations when the program will stop working because the application has crashed.
Fortunately, programming languages provide facilities that can automatically remove unused memory, addressing this issue. The garbage collector, or GC, is one of them. The garbage collector can only do so much in terms of releasing unused data. Memory leaks are caused by unreferenced objects passing through the collector untouched.
Memory Leaks in the Business: What Are the Consequences?
Memory leaks can have a severe impact on your company. Leaks are less noticeable than typical program defects. Consider it a quiet assassin for your application. It works its way through the system, progressively destroying the application.

The incident with Amazon in 2012, which involved a maintenance procedure gone wrong, is a clear example of how a memory leak can have a significant impact on a corporation. Amazon chose to update its data gathering server, but some machines' configurations were incorrect, resulting in memory leaks. The leak became uncontrollable, and the afflicted service was brought to a halt, affecting millions of users.
- Availability and Reliability
Memory leaks can have a significant impact on an application's availability and dependability since they slow down the application's performance. - Performance Deterioration
Memory leaks do not affect the behavior of your software. However, due to system memory exhaustion, repeated leaks add to the application's performance decline. Remember that the user experience is critical to the success of your business. If your application has a bad user experience, it is doomed to fail.
Is There a Way to Tell a Memory Leak?
Running out of memory is the simplest way to identify a memory leak, and it's also the most common approach to uncovering one. That's also the most inconvenient way to find a leak.

You'll probably notice your system slowing down before you run out of RAM and crash your application. If this is the case, it's time to start going through your code to see what's eating up all of your RAM.
You'll most likely achieve this with the help of a profiling tool. Modern IDEs, like Visual Studio, have capabilities that show you how much memory is being used by particular components of your application.
A profiling tool isn't a solution: it won't tell you which areas of your software are leaking memory right immediately. It will inform you of which areas of your application are using the most memory.
You can also monitor which portions of the application utilize more memory over time if you run them for a long time. With this information, you may focus your search on leaky code in your application.
Another way for detecting memory leaks is to employ intelligent logging. A memory leak is sometimes caused by incorrect code, but it is often caused by your users. Perhaps a user has uploaded a huge file to your servers and is attempting to access it.
If you're putting the entire file into memory, you can accidentally exhaust the application's RAM. Memory leaks in running applications are frequently detected by automated tools in mature software companies.
To check your codes, you'll need a third-party application like Atatus. With centralized logging, code profiling, error tracking, and real-time user monitoring, this product goes beyond traditional Application Performance Management (APM).

You can apply Atatus to your coding system if you see that your application is lagging down. It will tell you which code is going in the wrong direction or which code is eating a lot of memory.
Yes, it isn't a simple approach to locating the memory leak. It is, nevertheless, a significant step forward. The information you collect can help you narrow down your search for the source of the leak.
How to Prevent Memory Leaks?
As previously said, several popular programming languages now incorporate tools to help developers with autonomous memory management. They use a garbage collector system to free up memory that the application doesn't require.
Garbage collectors are complex pieces of software. If you want to avoid a wide range of memory leaks, you should familiarise yourself with your language's garbage collection methods. Garbage collectors come in a few different kinds. Understanding how garbage collection works in your application is critical to avoiding memory leaks.
Writing code that disposes of unused resources is another key method to avoid memory leaks. Almost all languages have resource types that aren't freed by default. Filehandles and networked resource connections are examples. You must create a particular code to inform the application that the resource's work is complete.
You can utilize the brute force method of removing memory leaks in the most extreme cases: restarting the process.

However, you should only use this as a temporary fix.
This is like a doctor surgically removing your arm because you smashed your thumb with a hammer. By being more cautious, you can avoid the source of the problem and avoid the need for such harsh steps.
Effects of Memory Leaks
There will normally be no immediate symptom if a program has a memory leak and its memory usage is progressively increasing. Every physical system has a limited quantity of memory, and if a memory leak is not addressed (for example, by restarting the leaking program), it will eventually cause issues.
Main memory, which is physically held in RAM microchips, and secondary storage, such as a hard drive, are both present in most modern consumer desktop operating systems. Memory is allocated on a per-process basis, with each process receiving the amount of memory it requests. Active pages are moved to main memory for quick access, while inactive pages are moved to secondary storage to save up space.
When a single process consumes a big quantity of memory, it tends to take up more and more main memory, forcing other programs to secondary storage and drastically slowing down the system's performance. Even if the leaking program is ended, other programs may need some time to swap back into the main memory, and performance may take some time to recover to normal.
Any attempt to allocate extra memory on a system when all of the memory on the system is exhausted will fail. The program attempting to allocate memory will normally terminate or generate a segmentation fault as a result of this. Some programs are meant to help people get back on their feet after being in this situation.
The operating system will most likely fail if the memory leak is in the kernel. A persistent memory leak can also cause computers with less sophisticated memory management, such as embedded systems, to fail.
If an attacker identifies a sequence of actions that can cause a leak, publicly accessible systems such as web servers or routers are vulnerable to denial-of-service (cybersecurity) attacks. An exploit is a term for a sequence like this.
Using the Resource Monitor in Windows
To find a memory leak, look at how much RAM the system is using. The Resource Monitor in Windows can be used to accomplish this.
In Windows 7, you can:
Start>>All Programs>>Accessories>>System Tools>>Resource Monitor
In Windows 8.1 and Windows 10:
To open the Run dialogue, press Windows+R, then type "resmon" and click OK.
Select the Memory tab in Resource Monitor once it's open.
To be sure there isn't a hardware issue, check that the correct amount of Physical Memory is reported as installed. Examine the quantity of accessible memory as well as the amount in use. This will reveal whether the system is running out of RAM or has plenty.
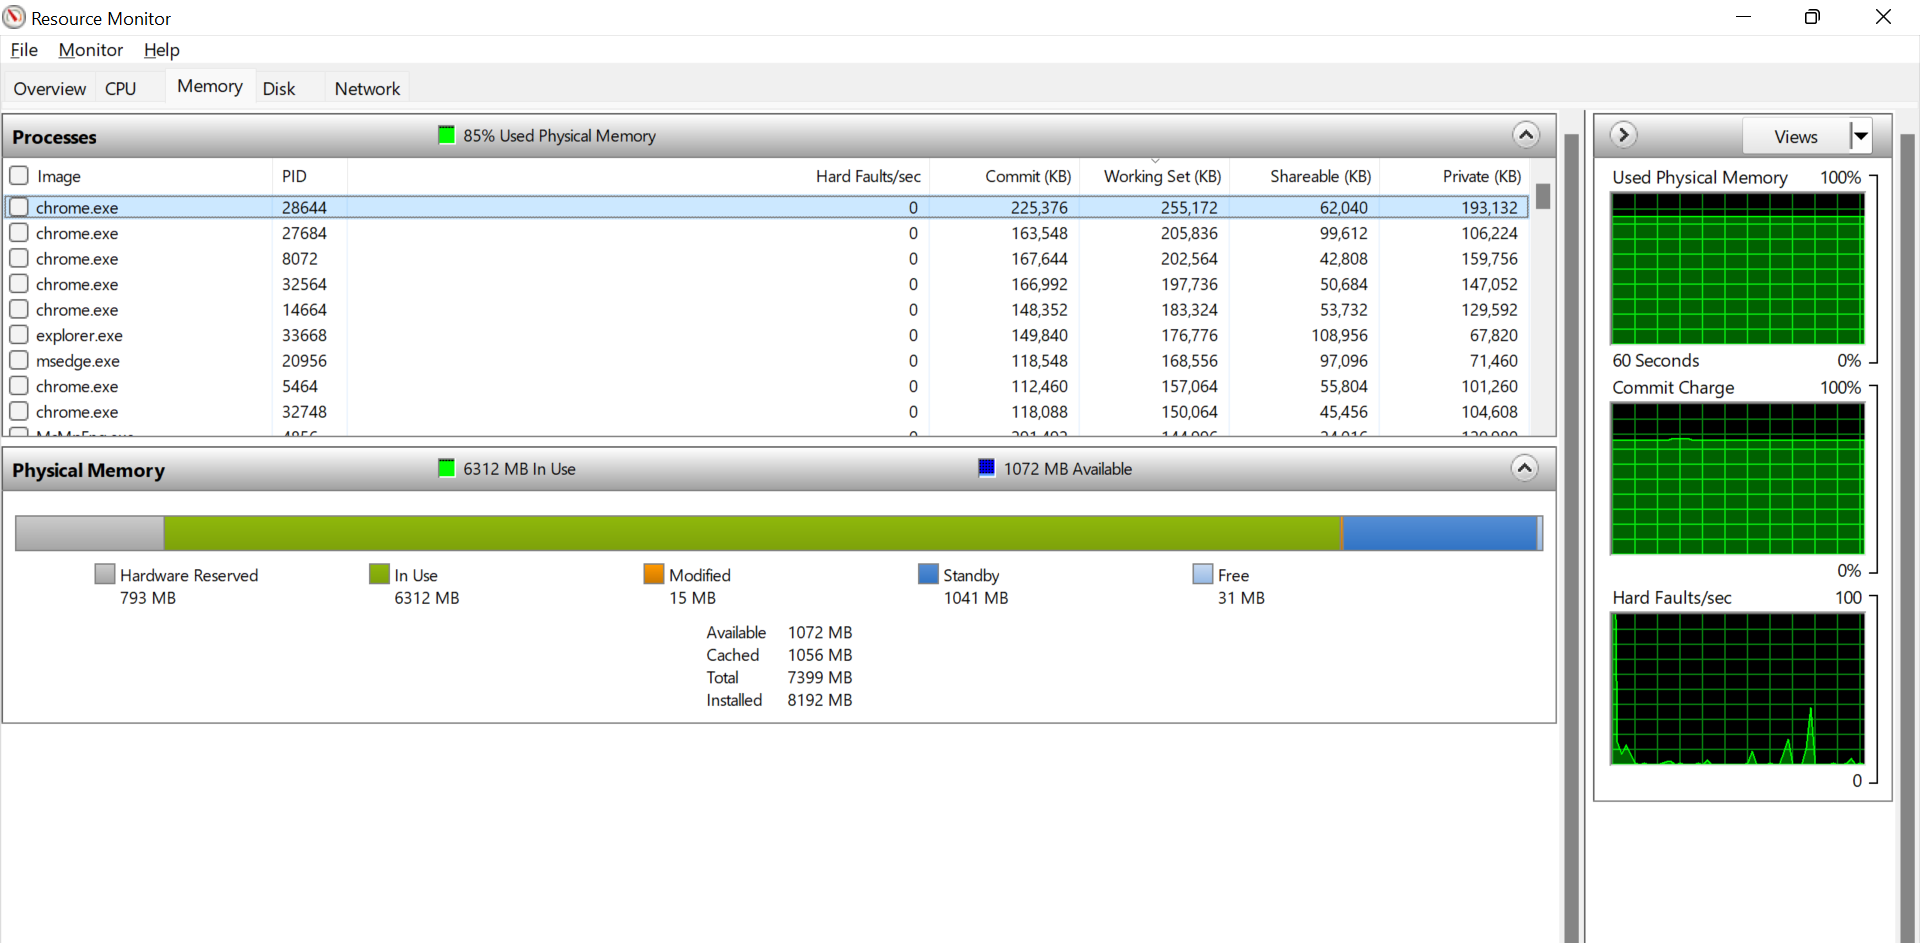
After that, we'll look at the processes that are now using memory. Rather than reading through the entire list, select "Commit (KB)," which will reorder it so that the activities that use the most memory are at the top.
This makes it simple to identify which applications are consuming the most RAM. It's "chrome.exe" in the example above, which is the Google Chrome browser. Also note that 85% of physical memory was used at the top of the Processes, showing fewer memory reserves for additional processes.
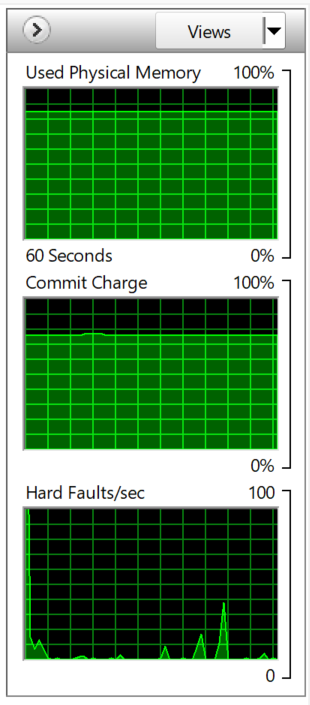
The three monitors over time, which show the last 60 seconds, are displayed on the right side of the screen. The "Used Physical Memory" in the top panel is increasing somewhat with time, but there is still a small portion of memory remaining, allowing the system to remain stable.
Limitations of Window's Resource Monitor
It's worth keeping an eye on the Window's Resource Monitor, as it can show you how much RAM is available and which processes are using the most resources.

However, it has numerous serious drawbacks.
The first is that it isn't monitored regularly. It requires that you open the Resource Monitor, and it does not operate in the background. Windows Gadgets, which debuted in Windows Vista and were continuing in Windows 7, included a gadget that accomplished this.
As it turned out, these devices were vulnerable (as is most software), therefore Microsoft discontinued them and they are no longer accessible. While we never expected to pine for Vista, this was a very useful feature that was removed far too quickly.
Another limitation is that it can only go back 60 seconds. If a memory leak occurs and the software is closed, it is unlikely that it will be detected and appropriately identified as the source of the problem.
Conclusion
Memory leaks are common in application code since the person writing them isn't aware of the risks. This can make it harder to locate them. It's quite difficult to figure out where the leak is coming from because the developer who understands the code best doesn't know what's causing it.
If you discover a memory leak in your code, don't consider it a software failure. Instead, use it as an opportunity to improve your skills and grow as a team. By applying the techniques we've discussed here, you'll discover that you naturally write code that protects your applications from memory leaks as you advance in your talents.
Monitor Your Entire Application with Atatus
Atatus is a Full Stack Observability Platform that lets you review problems as if they happened in your application. Instead of guessing why errors happen or asking users for screenshots and log dumps, Atatus lets you replay the session to quickly understand what went wrong.
We offer Application Performance Monitoring, Real User Monitoring, Server Monitoring, Logs Monitoring, Synthetic Monitoring, Uptime Monitoring, and API Analytics. It works perfectly with any application, regardless of framework, and has plugins.

Atatus can be beneficial to your business, which provides a comprehensive view of your application, including how it works, where performance bottlenecks exist, which users are most impacted, and which errors break your code for your frontend, backend, and infrastructure.
If you are not yet an Atatus customer, you can sign up for a 14-day free trial.
#1 Solution for Logs, Traces & Metrics
![]() APM
APM
![]() Kubernetes
Kubernetes
![]() Logs
Logs
![]() Synthetics
Synthetics
![]() RUM
RUM
![]() Serverless
Serverless
![]() Security
Security
![]() More
More

![New Relic vs Splunk - In-depth Comparison [2025]](/blog/content/images/size/w960/2024/10/Datadog-vs-sentry--19-.png)
![New Relic vs Sentry - Which Monitoring Tool to Choose? [2025]](/blog/content/images/size/w960/2024/10/VS--1-.png)