PHP Profiling: Find Slow Code in Your Application
Over the course of two decades, a lot of data has been made available online in order to fully realise PHP's potential. It is one of the most widely used programming languages, and some consider it to be one of the easiest to learn.
Even the most advanced languages require some assistance. Many PHP tools available in its vast ecosystem can be of assistance. The most valuable tool is a PHP profiler.
In general, profilers are beneficial to all levels of developers. They used it to track down errors and improve performance. In terms of profiler categorization, however, a programmer's mindshare is relatively limited.
We will cover the following:
- What is Profiling?
- Types of Profilers
- How does APM Works?
- Profiling vs. Tracing
- Steps of Profiling PHP Code
- Additional Factors to Consider While Creating a More Comprehensive Profile
What is Profiling?
When it comes to optimising any application, the first step is to profile it. Profiling tools keep track of essential details like how long statements and functions take to run, how many times they're called, and so on. The output can be examined to determine where bottlenecks exist.
During peak load testing, it keeps a close eye on the memory, CPU, and network usage of each component. Any procedure or software component that consumes an excessive quantity of resources could result in a bottleneck.
Code is growing increasingly complex these days. In 2014, the term "full-stack" became popular precisely because no one can know the whole stack anymore by default. In general, there's a massive explosion of new technologies, layers, and devices out there. It's not just your own stack either. Other platforms provide microservices, API calls, and serverless tasks.
Developers, on the other hand, can use profiling to gain a better knowledge of how their web applications are working. And they may do it query by query, function by function. In a word, profiling gives your insight into the performance of your web application.
Types of Profilers
There are three categories of profilers:
- Standard profilers
- Tracing profilers
- Application performance monitoring (APM) tools
Let me go over things in a little more detail.
#1 Standard PHP Profiler
The most frequent sort of PHP profiler is a standard method and line-level profiler, but it's also the one you'll use the least. To put it another way, everyone has used a standard profiler, although you may only use it once or twice a year.
Standard profilers can help you figure out what's wrong with your application if it's causing you problems. Standard profilers keep track of their application's stack traces on a regular basis. These samples provide a snapshot of key data such as CPU utilisation, memory consumption, time spent per line of code, and method call frequency.
Advantages:
- The use of a standard method and a high level of performance memory leaks and performance issues that cause high memory utilisation can be tracked down with a PHP profiler. Standard profilers are the answer if memory use is an issue.
- Determine the source of high CPU utilisation and optimise application performance so that it operates at a normal CPU level. This style of performance optimization is ideal for standard profilers.
Disadvantages:
- Since application snapshots are only taken on a regular basis, they may not capture the entire picture of the problem. A typical PHP profiler does not run indefinitely.
- Standard profilers consume a lot of resources and slow down developers. They are not light, which needs a development halt before they can run.
- Some standard profilers, such as Xdebug, need the usage of extra tools to examine the profiler data, as previously indicated. Developers' time-to-insight is also slowed as a result of this.
#2 Tracing Profilers
Tracing profilers are lightweight than standard profilers, and they can be utilised while coding. Tracing profilers, unlike standard profilers, can be used on a daily basis without slowing you down. These are intended to catch errors in real-time while you're creating, rather than after they've occurred. Tracing profilers can be thought of as your first line of defence in the bug battle.
Advantages:
- Tracing profilers can be used on a daily basis to catch errors as they occur. Developers can debug in any environment, including production.
- During run-time, allows developers to track PHP execution, function calls, and information requests.
- Tracing profilers help you find errors fast and simply because they're used while coding. There's no need to put a halt to progress.
- Many tracing profilers are available for free.
Disadvantages:
- Tracing profilers can only provide limited information, such as recognising heavy-load issues and defects. Prefix, for example, only keeps track of issues with web requests.
- They are unable to detect difficulties with CPU or memory use.
- They do not, like APMs, provide full-stack performance monitoring.
#3 Application Performance Monitoring (APM) Tools
Throughout the development lifecycle, APM tools keep track of your complete web stack. They provide fundamental server metrics such as CPU and RAM, as well as comprehensive, code-level insights into the performance of your application. Transaction tracing and logging metrics are also provided by some APM tools.
APMs do more than only discover code issues, unlike a normal or trace PHP profiler. They assist you in identifying inefficiencies and opportunities for improvement throughout the entire web stack. They're an essential component of any PHP project.
Advantages:
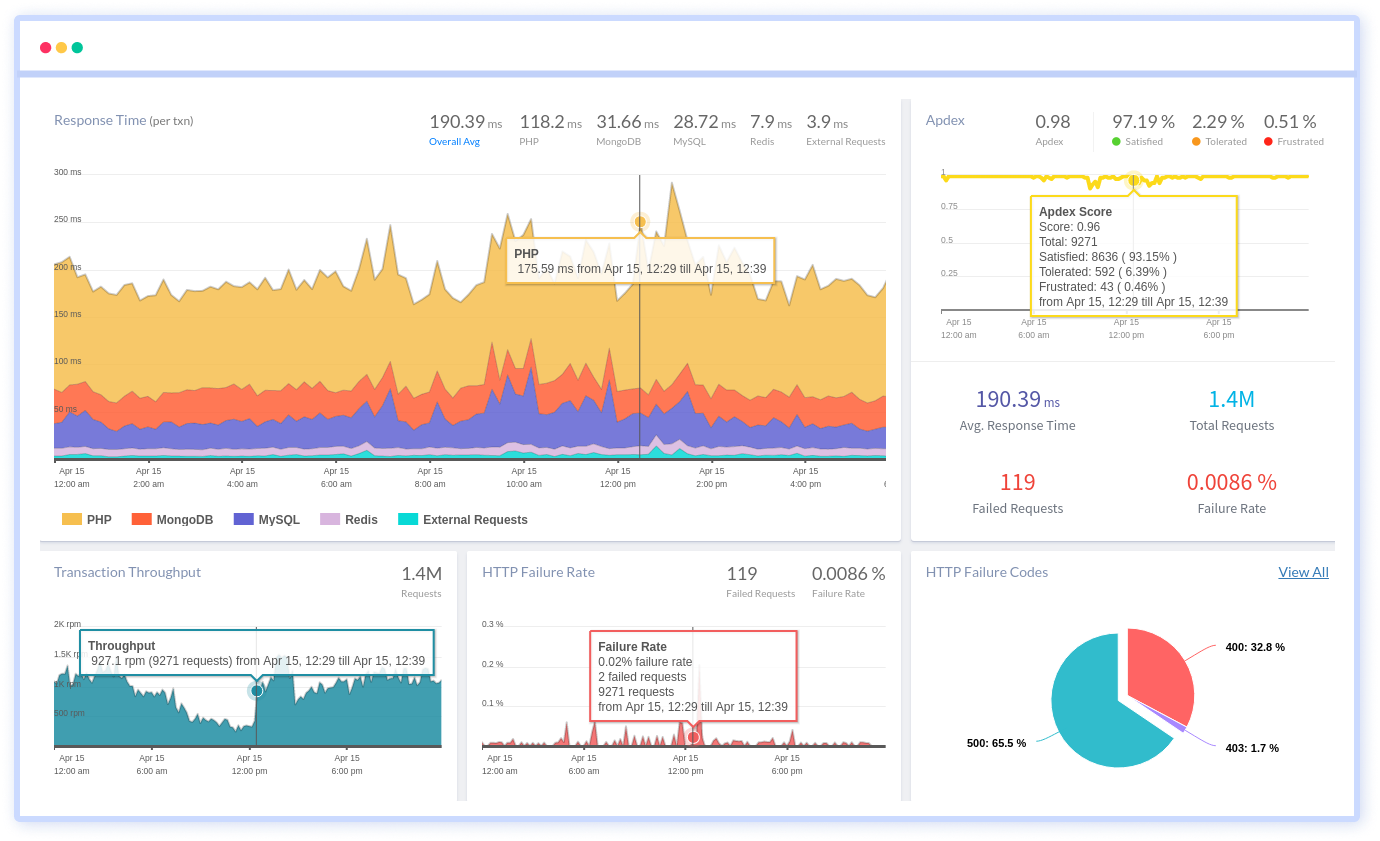
- The most comprehensive and in-depth profiling is provided by APM tools. They monitor the performance of your server, database, logs, web requests, and code to help you pinpoint the slowest sections of your stack.
- They give you a user's perspective on your application by tracking customer satisfaction, the most popular web requests, and SQL query performance.
- APMs are always running, so developers are always aware of performance issues.
- After discovering high-level performance issues, APMs use code-level tracing to help you find the source of the problem.
Disadvantages:
- Typically, APMs are priced per server. Some APMs, on the other hand, are more affordable.
How does APM Works?
A full-featured approach to application performance management, according to Gartner, should contain some variation of at least these five particular steps:
- End-User Experience Monitoring
End-user experience monitoring would detect an issue as it affects the application's user as a first step. - Discovery, Modelling, and Visualisation of Runtime Application Architecture
The application's runtime architecture would be generated and/or surveyed as a second phase to determine the problem's probable scope. - User-Defined Transaction Profiling
In a third phase, user-defined transactions would be analysed as they flow across a subset of the runtime architectural graph's potential paths to determine which nodes in that network are the sources of the end-user problem. - Component Deep-Dive Monitoring in an Application Context
Deep-dive monitoring of those nodes is performed as a fourth stage, based on the outcomes of the previous three steps. - IT Operations Analytics
In the fifth and final stage, analytics are used to establish root cause in the midst of the massive amounts of data created in the previous four steps, as well as to better anticipate and plan for future end-user experience issues.
Profiling vs. Tracing
A profile keeps track of all of the execution's performance events and times. In a strict sense, this disregards the events' sequence. Nothing is timestamped, and the report as a result does not state if one event occurred before another in a strict sense. A profile can keep track of the relative order of occurrences.
A trace is a long-term record of the chronology, frequently containing timestamps. With the passage of time, the amount of data in the trail grows. As a result, in order to limit the memory usage of the tracer, the data must be written to a disk or network on a regular basis.
When selecting a tool to extract performance information from parallel code, it's important to understand the difference between profiling and tracing. A trace is typically used to look into the details of timing issues in a code. A profile can often be used to identify load imbalances caused by problem breakdown and/or the source of excessive communication time.
Profiling and tracing can be used to examine a program's dynamic behaviour. A profile (or trace) reveals performance difficulties by indicating which parts of a code take the longest to complete. You can then concentrate your efforts on researching and developing those parts. If your program runs longer than expected, profiling is one of the first steps to figuring out what's wrong.
Steps of Profiling PHP Code
To demonstrate how to use Atatus to perform simple profiling to discover slow-performing queries and functions, we'll utilise a real PHP code project. Let's get going!
Step 1: Install the Software on the Development Machine
Begin by signing up and installing the software. Starting with the local development environment is a good way to begin with PHP profiling. You'll get the best of both worlds: limiting the danger to the production environment while executing code profiling.
After you've chosen the configuration that best suits your needs. Copy and paste the installation command. On the Atatus Docs page, you will also find the installation command.
Here's everything you'll need to get started:
#1 Install the Atatus PHP agent as follows
a.) Get the most recent Debian agent from:
// Download Debian tarball
wget https://s3.amazonaws.com/atatus-artifacts/atatus-php/downloads/atatus-php-1.12.0-x64-debian.tar.gz
b.) Extract the agent files from the zip file.
tar -xzvf atatus-php-1.12.0-x64-debian.tar.gz
cd atatus-php-1.12.0-x64-debian
#2 Set up the PHP agent
sudo ATATUS_LICENSE_KEY="APM_LIC_KEY" ATATUS_APP_NAME="YOUR_APP_NAME" bash install.sh- APM_LIC_KEY - add the Atatus APM License key
- YOUR_APP_NAME - add the name of the application
Step 2: Restart all Services
All of your services should be restarted. That will be the following in my case:
sudo service php-fpm restart
sudo service nginx restart
Depending on your Linux distribution and the services you use, your commands may differ. You can see install steps for other Linux Distribution and services here.
Step 3: Go to the service and profile the PHP code
Now that we have completed the installation and setup, we are ready to begin profiling. The following are the next steps:
- Go to the Atatus dashboard and choose the application
- Select the APM tab
Step 4: Drill into the Code
Now evaluate whether we want to look at the requested action that takes up the most time in the PHP section.
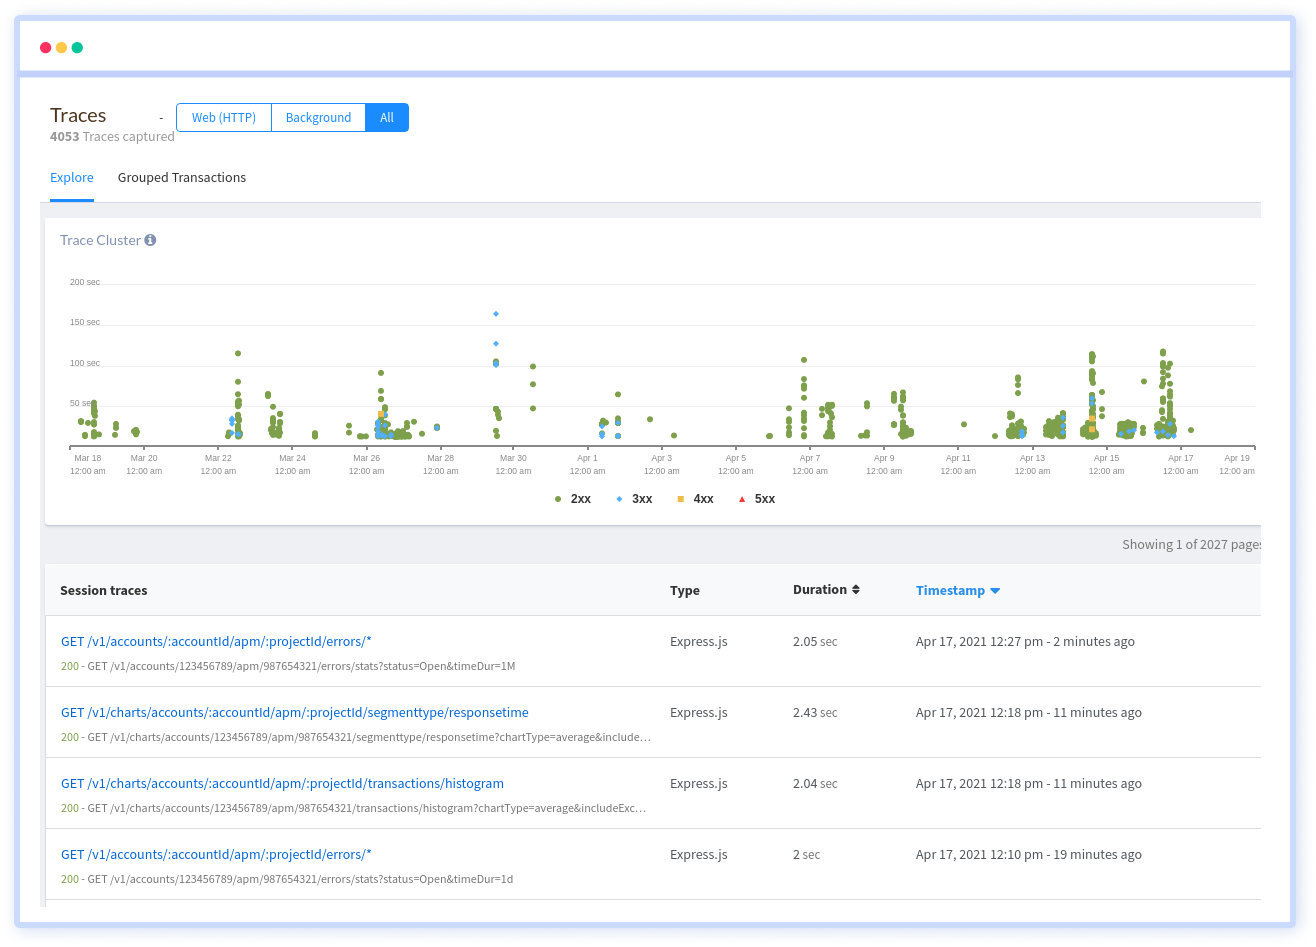
Clicking on "Traces" is another fantastic option to dive down.
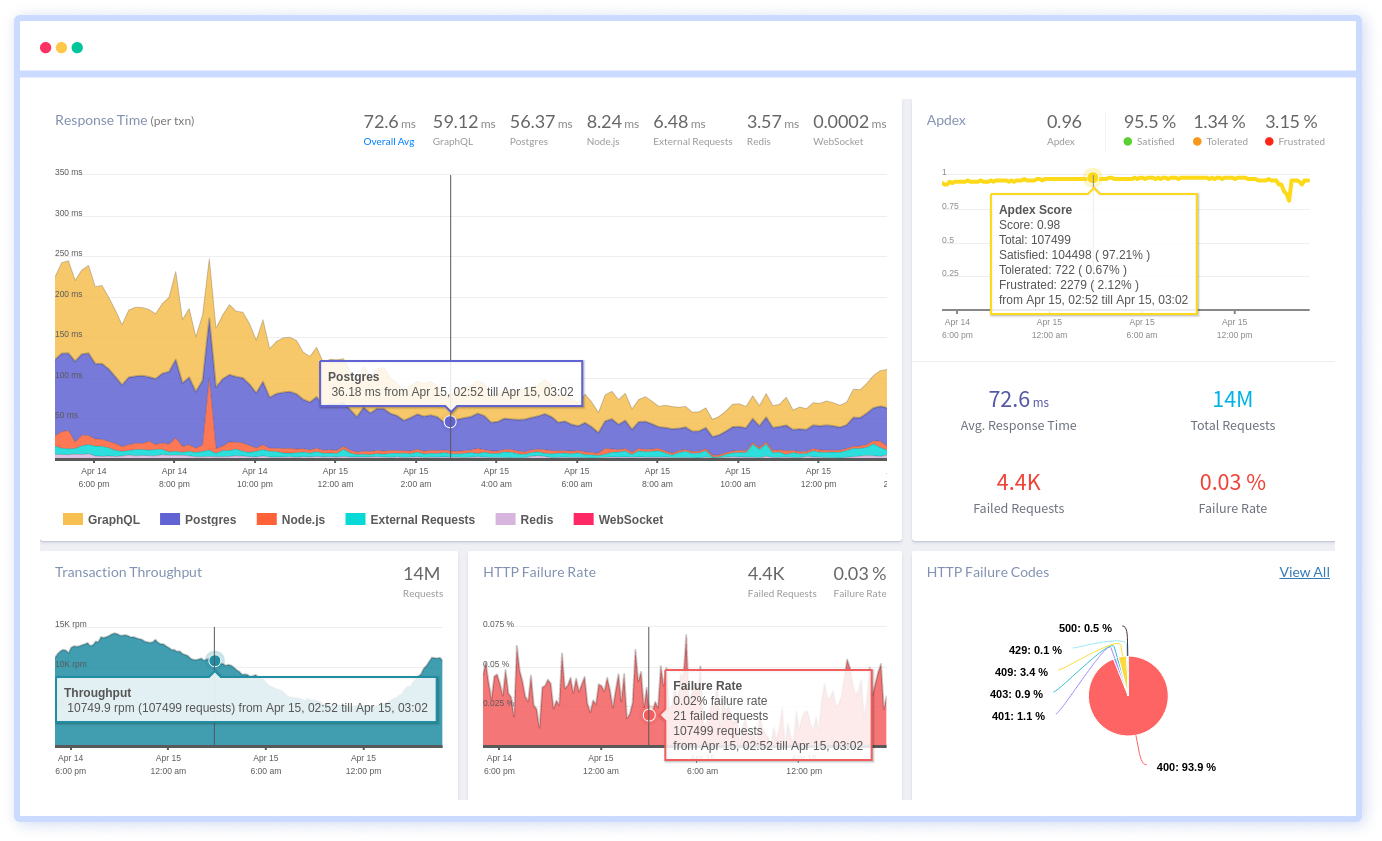
Step 5: Time to Optimize
You can see how long each function or query takes in seconds (sec).
To deal with this, you should concentrate on the queries that take the longest. Begin by focusing on the queries that are the most inefficient.
Another wonderful technique to improve performance is to go through all of your slow queries and eliminate the ones that are no longer needed. The best code isn't any code at all.
Additional Factors to Consider While Creating a More Comprehensive Profile
You might be wondering what else we can do now that we've looked at how to optimise a requested operation in a PHP codebase.
As we indicated previously, a profile creates a collection of performance events. Atatus allows you to handle logs in addition to tracking the performance of the queries and functions used in your application's calls.
Keeping Track of Logs
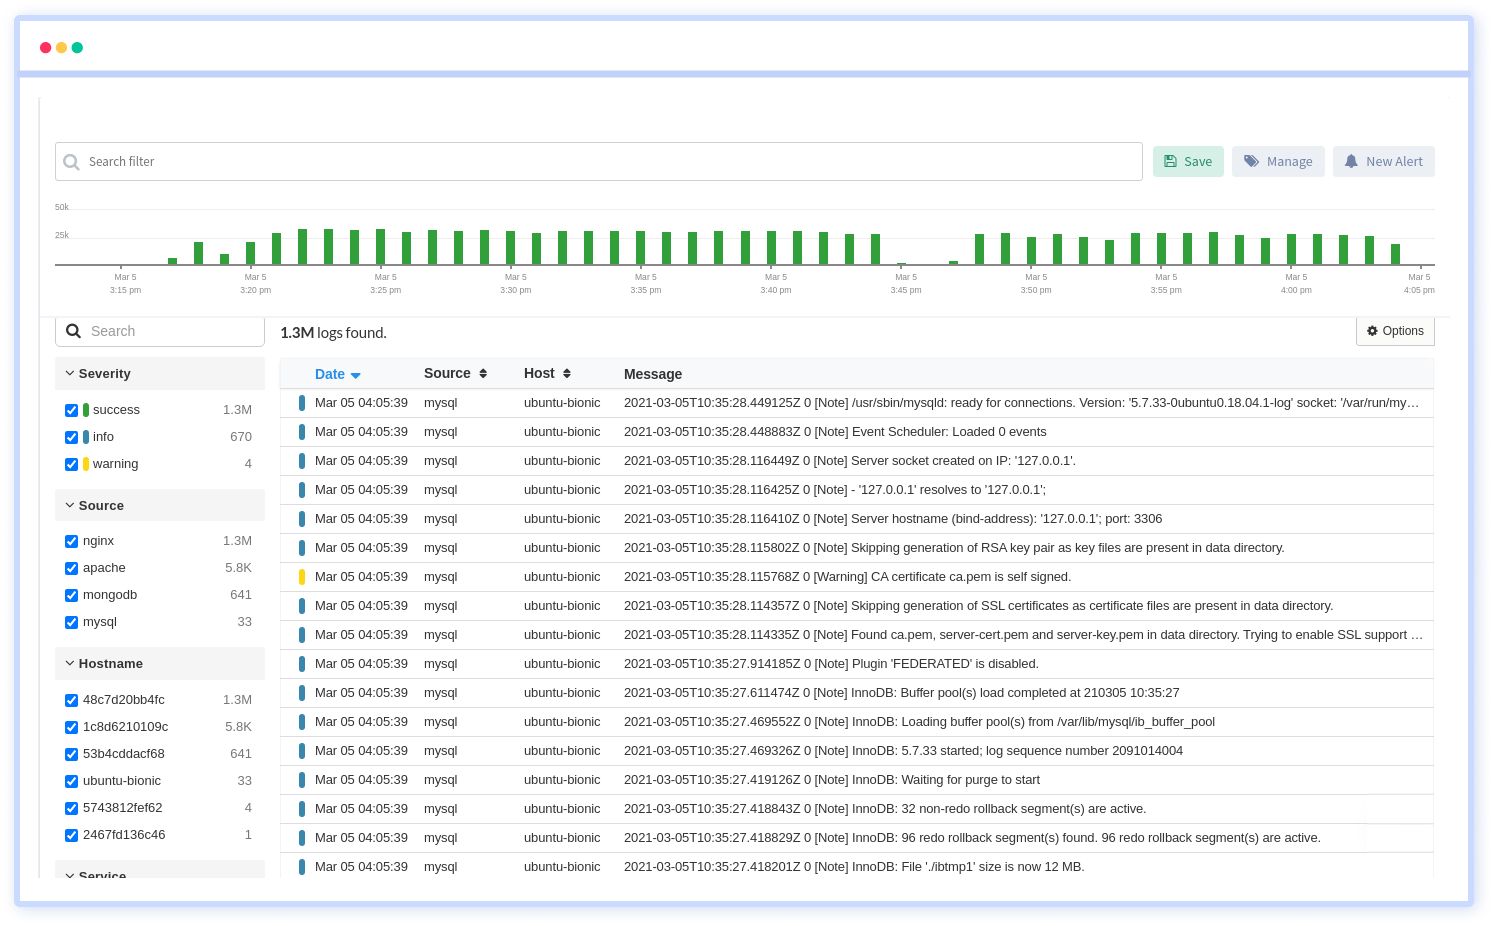
Popular logging frameworks can readily send logs with a simple setup modification. As a result, logs like the ones below can help you develop a thorough picture of your PHP application's performance health:
- Application logs
- Syslog
- Windows events
- Web server logs (IIS, Apache, NGINX)
In Atatus, logs are displayed as follows:
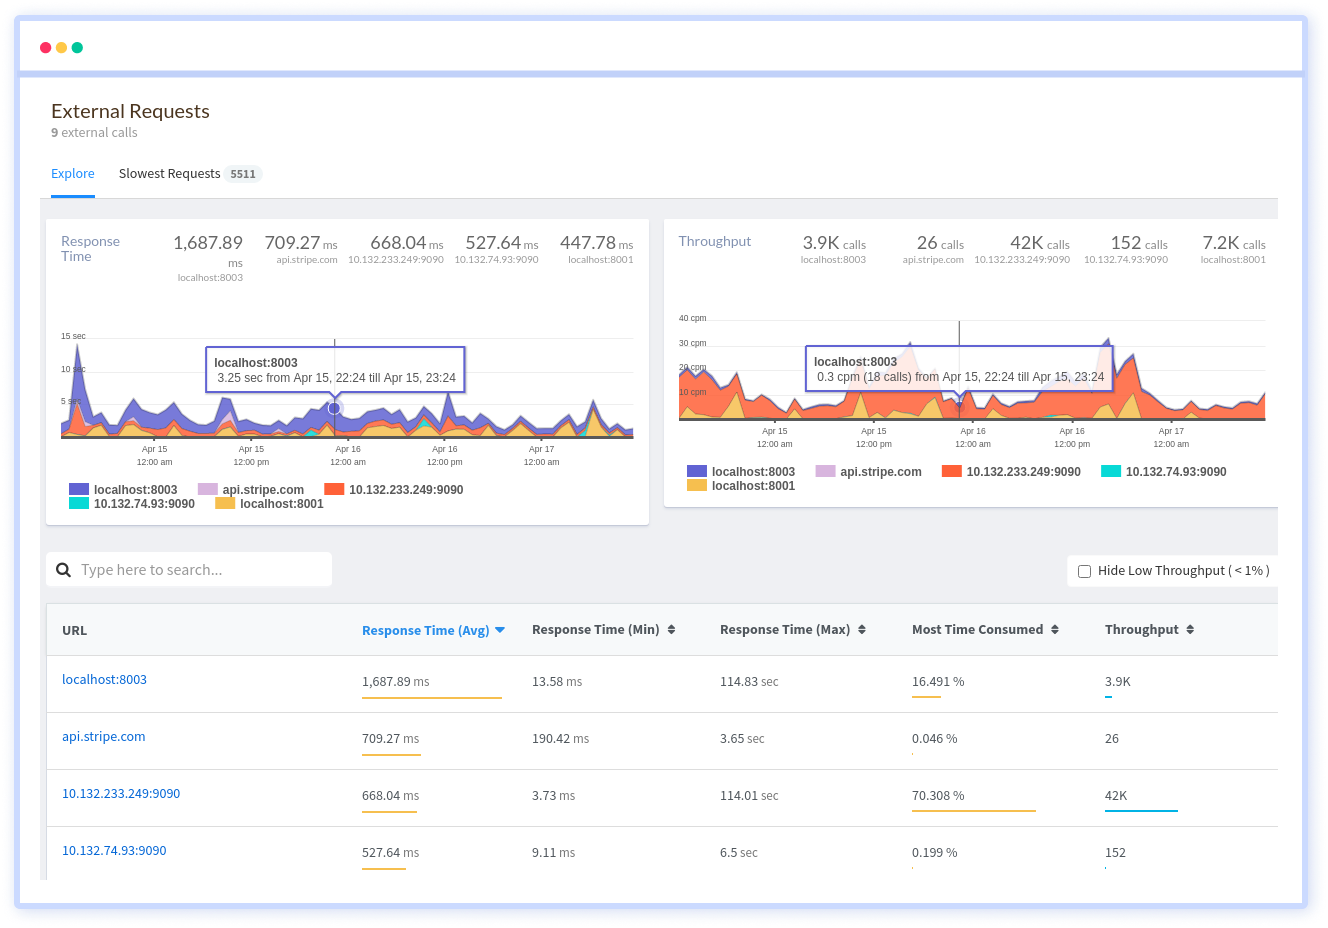
Tracking External HTTP Calls
We discussed how the complexity of microservices and platforms that provide API calls is increasing. This means that if your application uses a lot of external services, it's even more important to keep track of its performance. As a result, in-depth tracing, even to the point of external calls, becomes increasingly important.
Server Performance Monitoring
Atatus not only tracks performance at the application layer but also keeps an eye on server performance.
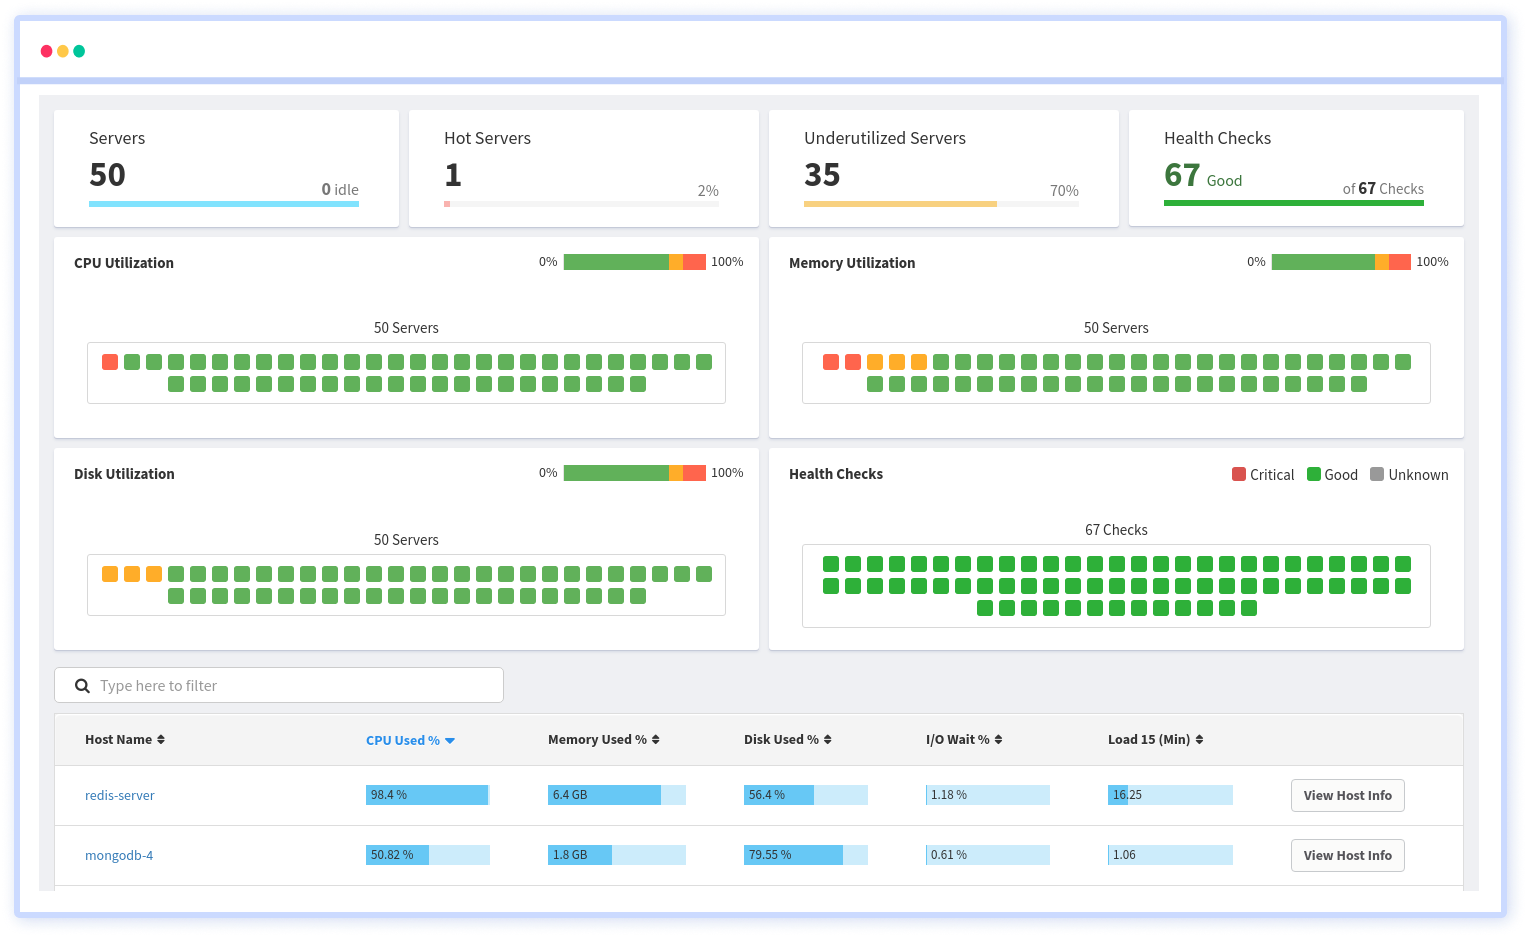
You can also obtain an overview of the network, storage, and other relevant server information by going down into the single server instance:
Monitoring Specific Requests/Transactions
You might come across a situation where you have a few challenging requests or transactions that you can't immediately optimise now and then. In a production environment, you must keep a closer eye on the situation for a longer time. The ability to identify key transactions can truly shine in this situation.
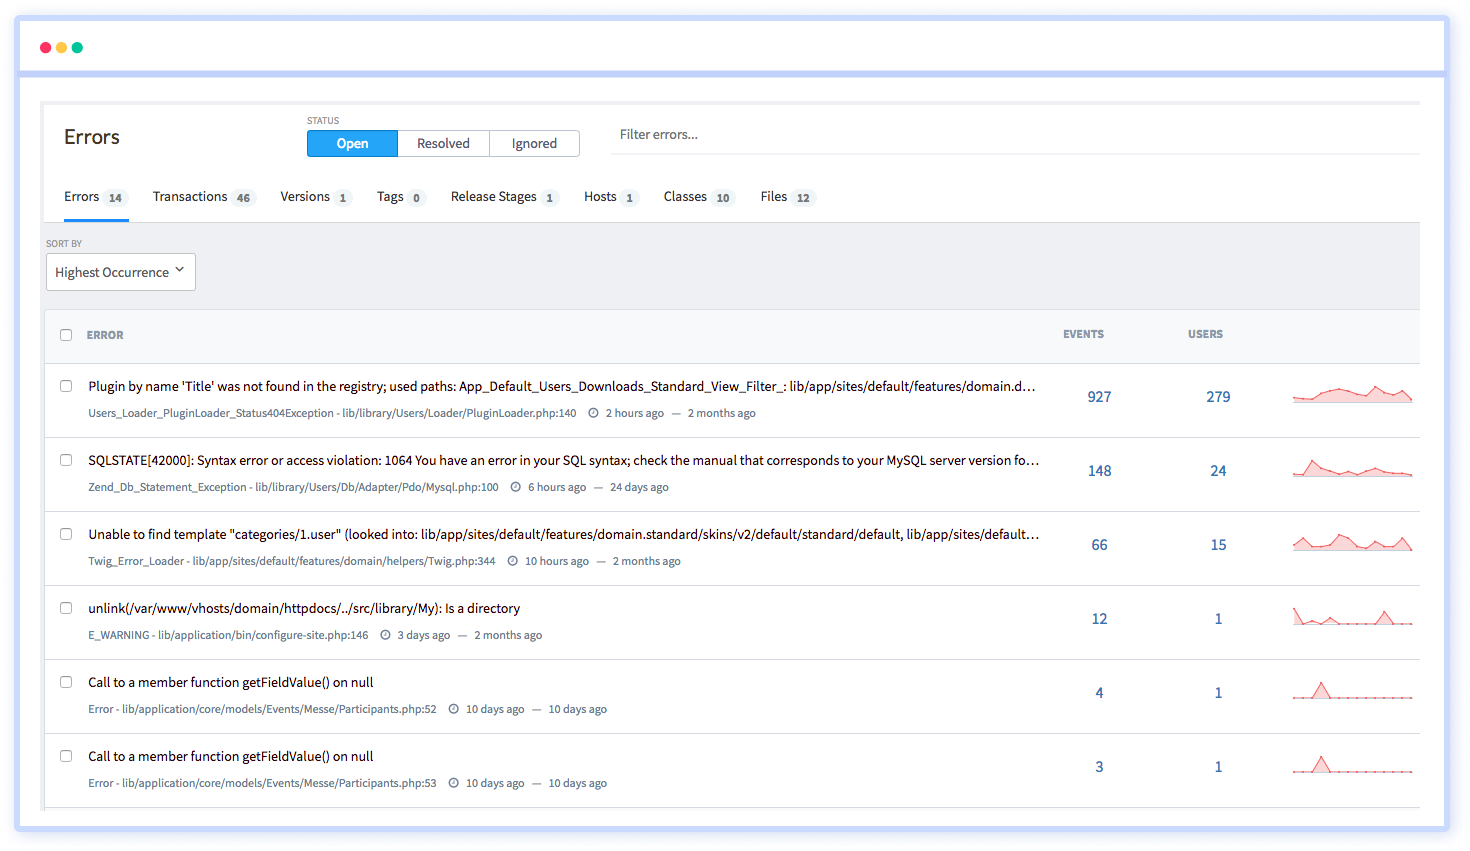
Real-life users manage to find errors no matter how thoroughly we test our application using both automated and manual testing methods. They have a hard time describing how they created the errors or bugs when we ask them.
Without relying on your non-technical users, you can get a clear view of how errors occur and what they are with error tracking.
Wrapping It!!!
Given the rising complexity of technology, this article discussed the theoretical aspects of a profiling tool as well as the compelling reasons why you should include profiling in your developer toolset. Then we went into detail about how we used PHP profiling to make a PHP codebase visible and optimise it. We also investigated the impact of profiling on code performance.
Following that, we learn the five steps for an actual desired action, from installation to optimization. Other information needed to develop a more thorough profile of your PHP application was also discussed in this article.
Target the low-hanging fruit once your profiling has revealed the inefficient section of your code. Identify the slowest paths and eliminate those that are no longer required. And believe me when we say that all codebases will contain some unwanted details. Run a code profile to find and trim them, you'll be glad you invested the time and effort.
Atatus: PHP Performance Monitoring and Log Management
Atatus is an Application Performance Management (APM) solution that collects all requests to your PHP applications without requiring you to change your source code. However, the tool does more than just keep track of your application's performance. It monitors logs from all of your PHP applications and systems into a centralized and easy-to-navigate user interface, allowing you to troubleshoot faster.
We give a cost-effective, scalable method to centralized PHP logging, so you can obtain total insight across your complex architecture. To cut through the noise and focus on the key events that matter, you can search the logs by hostname, service, source, messages, and more. When you can correlate log events with APM slow traces and errors, troubleshooting becomes easy.
We offer Application Performance Monitoring, Real User Monitoring, Serverless Monitoring, Logs Monitoring, Synthetic Monitoring, Uptime Monitoring, and API Analytics. It works perfectly with any application, regardless of framework, and has plugins.
#1 Solution for Logs, Traces & Metrics
![]() APM
APM
![]() Kubernetes
Kubernetes
![]() Logs
Logs
![]() Synthetics
Synthetics
![]() RUM
RUM
![]() Serverless
Serverless
![]() Security
Security
![]() More
More