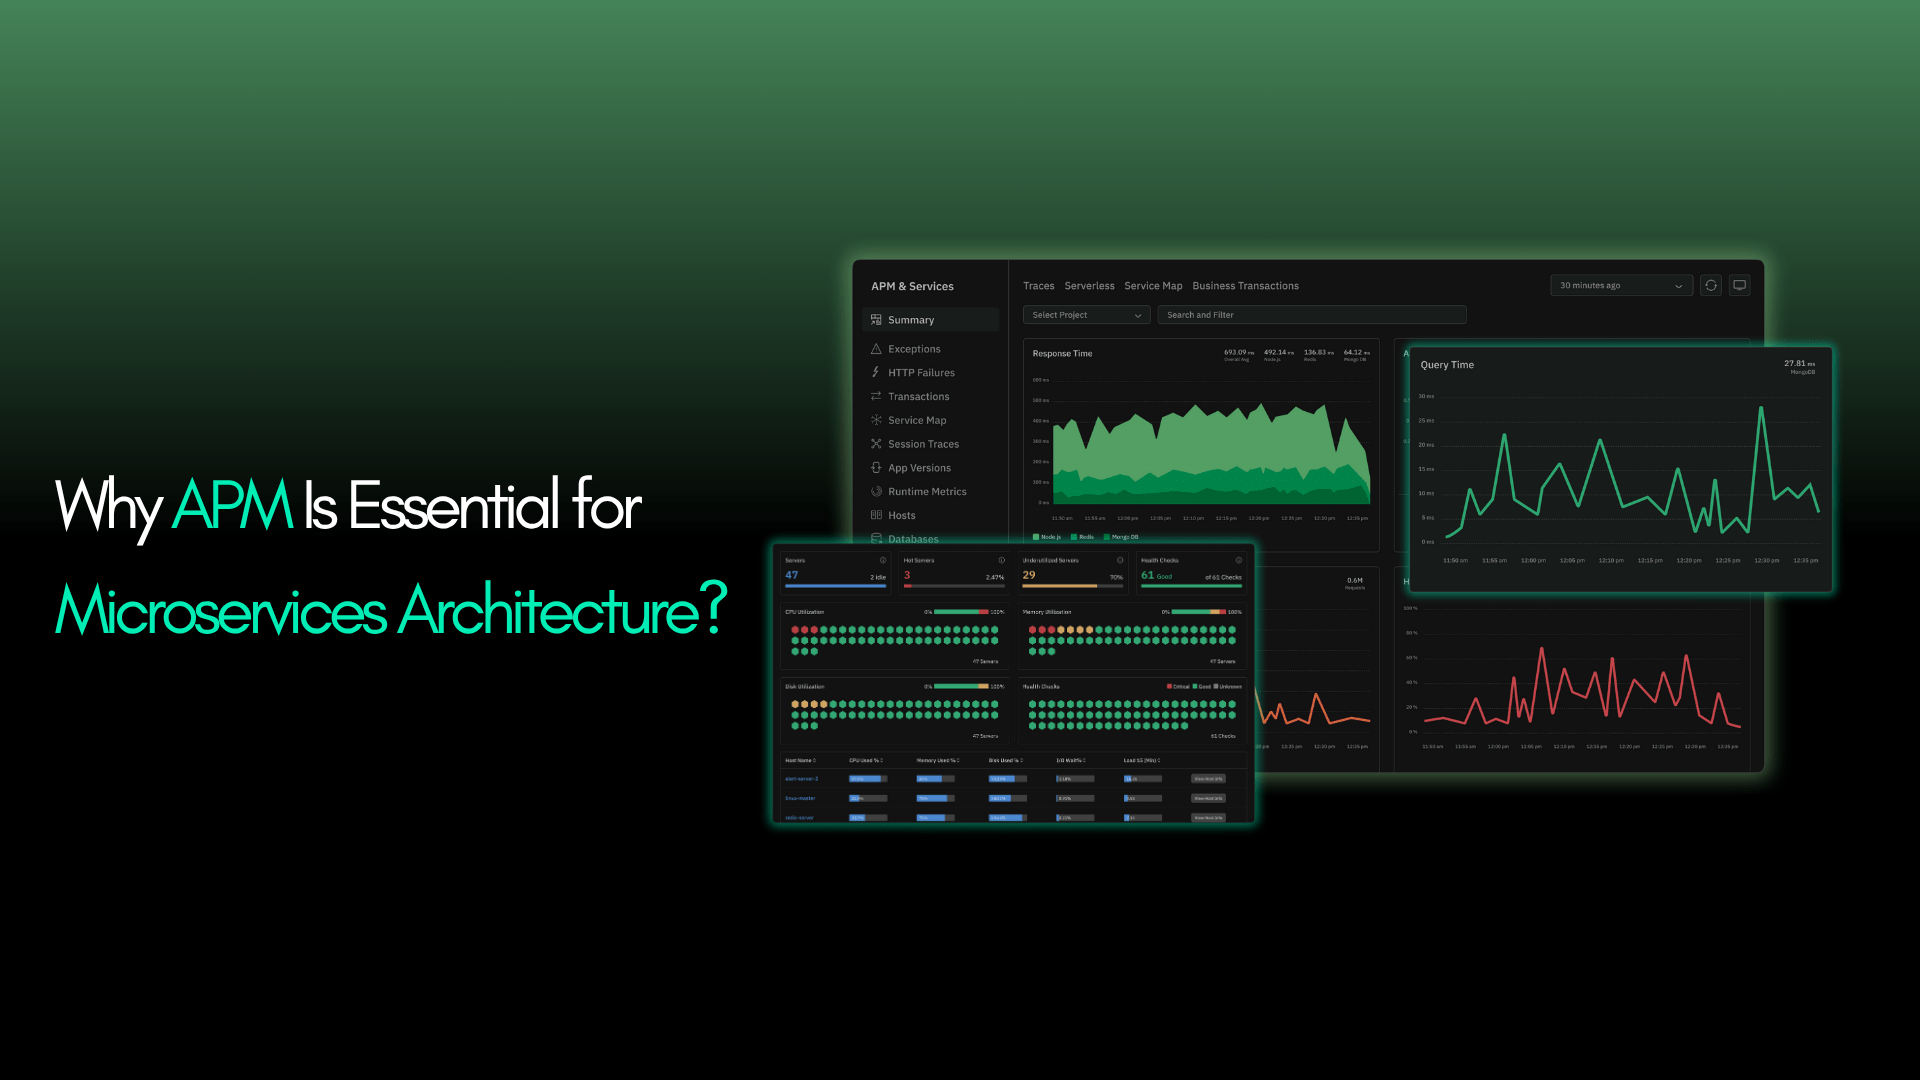
Why APM Is Essential for Microservices Architecture?
According to Statista, over 85% of large enterprises and nearly 50% of small to midsize businesses will have adopted microservices as part of their software architecture. The shift is clear: organizations of all sizes are moving away from monolithic applications toward microservices to accelerate development cycles, improve scalability, and support continuous delivery. But this architectural freedom comes with a hidden cost, which increases operational complexity.
Unlike monoliths, microservices distribute functionality across many independently deployable services. While this allows teams to iterate and scale faster, it also introduces new challenges in monitoring and debugging. Traditional tools, which were built for single-process, tightly coupled systems, simply can’t keep up with the dynamic, distributed nature of microservices.
You may have hundreds of services written in different languages, deployed on Kubernetes, behind service meshes, or communicating via asynchronous queues. In such an environment, logs alone won’t cut it. Metrics don’t tell the full story. What teams truly need is end-to-end visibility, powered by a modern Application Performance Monitoring (APM) solution designed for microservices observability.
If your systems are built with microservices but your monitoring isn't, you’re setting yourself up for blind spots, delayed resolution times, and frustrated engineering teams.
That’s where this blog comes in. Let’s explore why APM is essential for microservices architecture, what features matter most, and how a tool like Atatus can gain full control over their distributed systems.
In this blog, we will learn:
- Challenges in Microservices Monitoring
- Real-World Example: E-commerce App Built with Microservices
- The Role of APM in Microservices
- How Application Performance Monitoring (APM) Helps?
- Why APM Is Essential for Microservices Architecture?
- Key Features to Look For in APM Tools for Modern Applications
- Why Atatus is an Outstanding APM Tool for Microservices?
- Conclusion: Why APM Is a Must-Have for Microservices
- FAQs on APM for Microservices Architecture
Challenges in Microservices Monitoring
Before diving into why Application Performance Monitoring (APM) is essential, let’s understand the real-world challenges teams face in microservices observability:
1. Observability Gaps
Each microservice might be written in a different language, use different frameworks, and be deployed across various infrastructure platforms. Observing what’s happening across these services in real time is not an easy task. Gaps in observability lead to blind spots, especially during outages or performance degradation.
2. Service Sprawl
Microservices grow organically. What starts as 5 services can quickly become 50 or 500. Managing and monitoring this sprawl manually is nearly impossible. You need tooling that scales with your architecture.
3. Debugging Complexity
An error in one microservice can cause a chain reaction across several others. Without distributed tracing in microservices, identifying the root cause becomes like finding a needle in a haystack.
These challenges don’t just slow down troubleshooting, they impact customer experience, engineering productivity, and cloud costs.
Real-World Example: E-commerce App Built with Microservices
Consider a modern e-commerce application structured around a microservices architecture. Key services might include:
- User authentication service
- Product catalog service
- Cart and checkout service
- Inventory management service
- Payment gateway integration
- Order tracking and notification service
Now imagine a scenario during a high-traffic event like a holiday sale. Customers begin reporting that their orders aren’t being confirmed. On the surface, everything appears functional:
- The payment gateway logs show successful transactions
- The frontend reports no errors
- Server health dashboards appear “green”
But users are still seeing order failures.
After hours of debugging across multiple services, the operations team discovers the issue: the inventory management service was experiencing a delay in updating stock levels due to a database contention problem. This delay silently caused the checkout service to time out before confirming orders even though no explicit error was logged in either service.
Without end-to-end visibility into how requests flow through these services, such an issue would be nearly impossible to detect quickly. And by the time it's discovered, the business has already lost orders, revenue, and customer trust.
This is the reality of challenges in microservices monitoring. Small issues can snowball into user-facing incidents. Distributed architectures demand deeper observability, not just broader monitoring.
Let’s now explore how Application Performance Monitoring (APM) solves these challenges and why it is necessary for today’s engineering teams.
The Role of APM in Microservices
Application Performance Monitoring in microservices goes beyond just uptime checks. It gives DevOps teams and engineers a lens into the internal workings of every transaction, service call, and system resource.
How Application Performance Monitoring (APM) Helps?
- Distributed Tracing: Understand how a request moves across services. Identify slow spans, failed calls, and bottlenecks with trace-level precision.
- Real-Time Metrics: Monitor throughput, latency, error rates, and more across all services and infrastructure components.
- Root Cause Detection: Automatically identify anomalies, slow endpoints, or misbehaving services affecting performance.
In short, APM translates complex service-level interactions into actionable insights.
Why APM Is Essential for Microservices Architecture?
Let’s break down exactly why modern teams can't skip APM when working with microservices.
1. Visibility and Troubleshooting
- Distributed Tracing
Each user request can trigger multiple service calls across different systems. Without distributed tracing, you're flying blind.
- Bottleneck Detection
An underperforming service slows everything down. APM detects these chokepoints, even when traditional monitoring shows "green."
- Faster Root Cause Analysis
Shorter MTTR (Mean Time to Resolve) means happier users and less stress on your SREs. With centralized trace data and smart diagnostics, APM accelerates resolution.
2. Performance Optimization
- Resource Utilization
Monitor CPU, memory, I/O, and network usage per service. Avoid overuse or underutilization. Pinpoint resource-hungry services.
- Auto-Scaling Support
Feed performance insights into auto-scaling logic. Ensure services scale based on real demand and real performance metrics.
- Continuous Improvement
Use historical data to compare deployments, identify regressions, and improve each release. This supports CI/CD best practices and agile operations.
3. Enhanced User Experience
- Faster Response Times
APM helps teams find and fix slow services, resulting in smoother, faster applications.
- Reduced Downtime
With proactive alerting and real-time visibility, outages can be caught before users even notice.
- Increased Customer Satisfaction
Performance issues directly affect churn, support costs, and conversion rates. An optimized system keeps customers engaged, reduces abandonment during critical flows like checkout or onboarding, and builds long-term loyalty.
4. Cost Management
- Resource Optimization
Identify inefficient services that consume excessive resources. Use Application Performance Monitoring (APM) insights to tune them or decommission unnecessary capacity.
- Preventing Over-Provisioning
Don’t throw more servers at the problem. Solve the real issue by identifying poorly optimized code, memory leaks, or inefficient database queries.
Key Features to Look For in APM Tools for Modern Applications?
Not all Application Performance Monitoring (APM) tools are created equal. When evaluating APM for microservices, look for these features:
- Auto-Instrumentation: Reduce developer effort with automatic code instrumentation across popular languages and frameworks.
- Service Maps: Visualize dependencies between services, databases, and external APIs.
- Custom Dashboards & Alerting: Stay on top of anomalies and performance dips with configurable alerts.
- Real-Time & Historical Metrics: Combine short-term responsiveness with long-term trend analysis.
- Anomaly Detection: Use machine learning or threshold-based alerts to proactively detect issues.
Conclusion: Why APM Is a Must-Have for Microservices?
Microservices make your application more agile but they also make it more difficult to monitor, troubleshoot, and optimize. Traditional monitoring tools weren’t built for this level of complexity. You need deep visibility, real-time insights, and the ability to trace issues across service boundaries.
That’s what Application Performance Monitoring (APM) provides and why it’s essential for any team running microservices at scale.
Why Atatus is an Outstanding APM Tool for Microservices?
If you're looking for a solution that simplifies the complexity of monitoring microservices and brings clarity to distributed systems, Atatus is an outstanding APM tool to consider. It’s trusted by engineering and DevOps teams to deliver reliable, actionable observability without the overhead.
Whether you're scaling a modern application or maintaining critical microservices in production, Atatus helps you stay in control when performance matters most.
If you’re ready to take the guesswork out of performance issues and build a more reliable, efficient system, it’s time to try Atatus for Free!
FAQs on APM for Microservices Architecture
Why is APM important in a microservices architecture?
APM is crucial in microservices architecture as it helps trace requests across services, detect performance bottlenecks, and reduce downtime. It provides end-to-end visibility, making it easier to resolve issues quickly in complex distributed systems.
How does APM improve microservices performance?
APM tools provide real-time metrics, distributed tracing, and alerting to help teams monitor and optimize each service independently.
Can Application Performance Monitoring (APM) handle distributed tracing in microservices?
Yes, modern APM tools support distributed tracing to visualize the full request lifecycle across multiple services and dependencies.
What are the challenges of monitoring microservices without APM?
Monitoring microservices without an APM tool leads to significant visibility gaps. Teams are forced to rely on fragmented logs and siloed metrics, making it difficult to trace how requests behave across multiple services. This results in blind spots, delayed detection of performance issues, and a complex, time-consuming root cause analysis process. Without centralized observability, even minor issues can escalate into major outages before teams can identify what went wrong or where it started.
How does distributed tracing work in APM tools?
Distributed tracing records the path of a request as it flows through multiple microservices. APM tools stitch together these traces to show latency, error points, and the exact flow of execution. This is especially useful in microservices where traditional logs can’t connect the dots between services.
Is Atatus a good APM solution for microservices?
Yes, Atatus is a highly regarded APM tool for microservices. It’s known for its simplicity, powerful distributed tracing, and real-time visibility. Teams use Atatus to reduce downtime, accelerate debugging, and maintain performance across complex service architectures.
#1 Solution for Logs, Traces & Metrics
![]() APM
APM
![]() Kubernetes
Kubernetes
![]() Logs
Logs
![]() Synthetics
Synthetics
![]() RUM
RUM
![]() Serverless
Serverless
![]() Security
Security
![]() More
More


![New Relic vs Splunk - In-depth Comparison [2026]](/blog/content/images/size/w960/2024/10/Datadog-vs-sentry--19-.png)