Introducing Atatus Synthetic Monitoring
A high-performance customer experience might spell the difference between business success and failure in today's always-on, competitive digital economy. However, in today's complex application environment, ensuring optimal performance across digital services and applications has become increasingly difficult.
As a result, application performance management (APM) must adapt to provide real-time visibility into the application landscape and to reveal precisely what is affecting user experiences. Synthetic Monitoring is the major technology used to measure application performance at the moment.
In short, synthetic monitoring proactively monitors your services and helps you understand your users' experiences, and optimize website performance. By simulating the user experience, synthetic monitoring is the best technique to observe how systems and applications perform. It's easier to manage your SLAs and SLOs and assure uptime across your environment when you can look at services and applications "from the outside in."
You'll be able to answer questions like these with synthetic monitoring:
- Is my website up and running?
- How fast is my site right now?
- Are the transactions going well?
- Is my performance cost-effective?
- Where is the slowness or failure if it exists?
Introducing Synthetic Monitoring
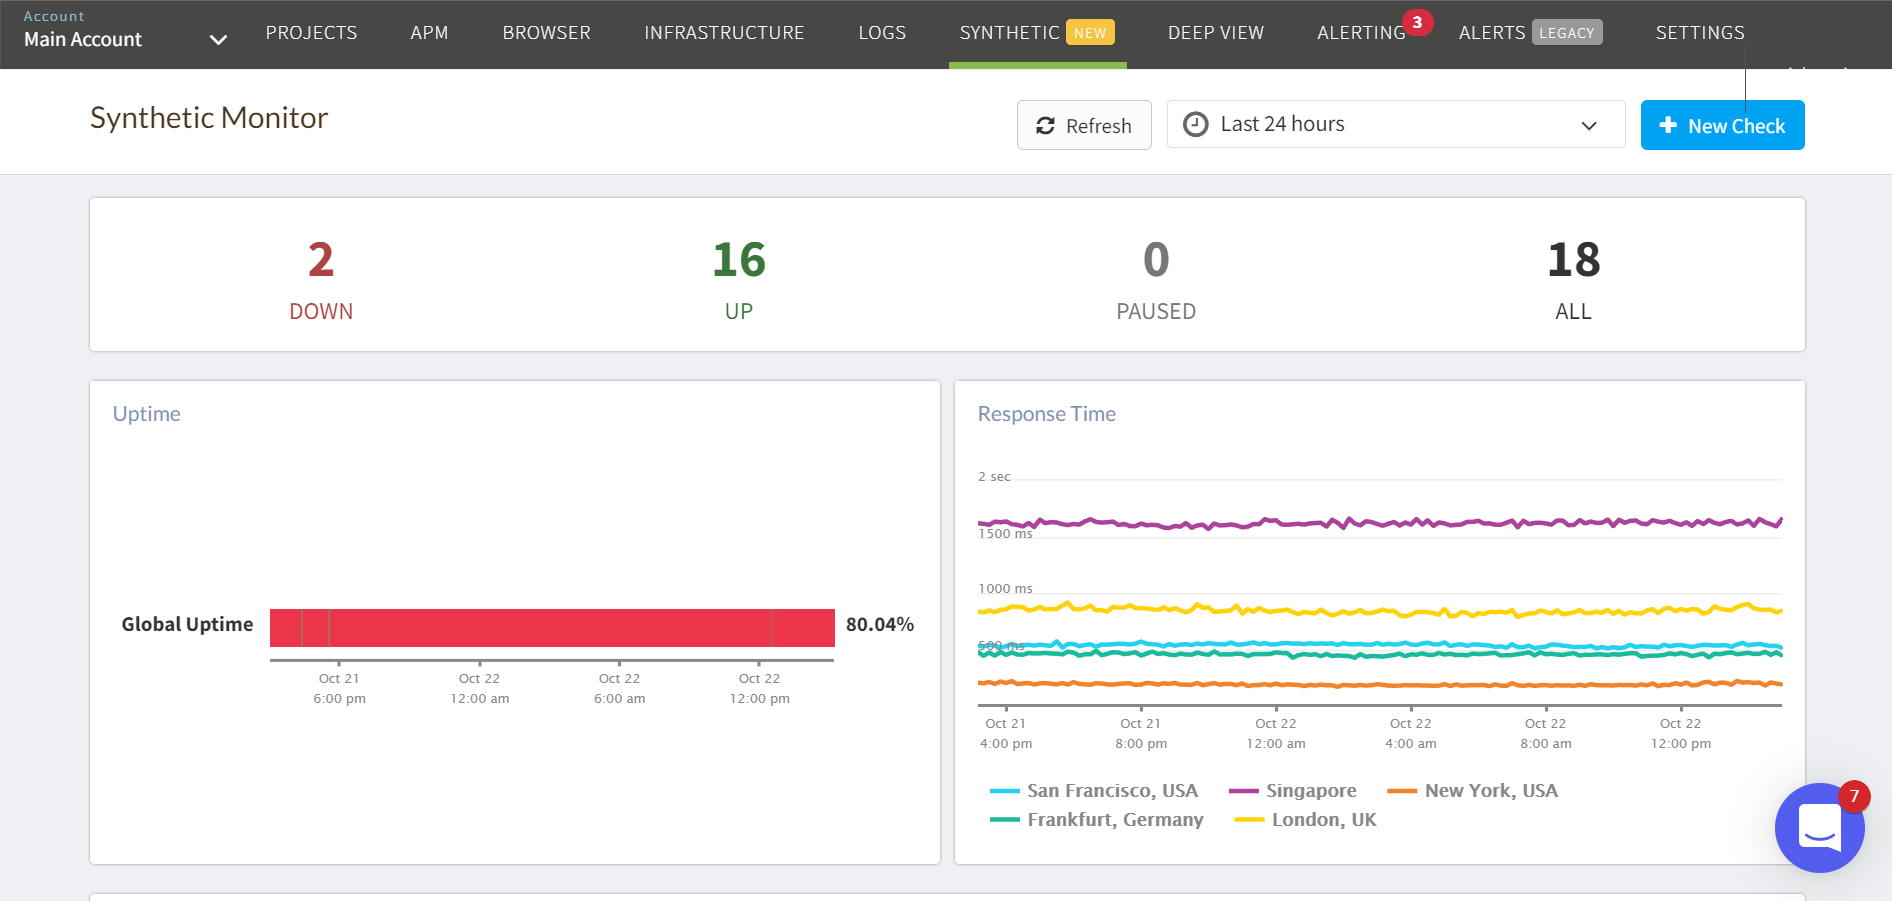
Synthetic Monitoring, a whole new layer of visibility on the Atatus platform, is now available. Synthetic Monitoring ensures uptime, identifies regional issues, tracks application performance, and manages SLAs and SLOs by monitoring your applications, API endpoints, and critical business flows via simulated user requests.
Atatus allows you to watch how all of your systems are working as experienced by your users by combining Synthetic Monitoring with the rest of your metrics, traces, and logs.
Synthetic Monitoring allows you to evaluate the performance of your systems and applications by simulating requests and actions from across the world. Atatus monitors the performance of your webpages and APIs in a regulated and steady manner, from the backend to the frontend, and at multiple network levels, warning you in the event of erroneous behavior such as regression, broken feature, high response time, unexpected status code, and so on.
Your development teams can proactively ensure that no bad code makes it to production with end-to-end testing in production and CI environments.
#1 API Tests and Multistep API Tests
API testing allows you to run verifications on your critical systems at multiple network levels by launching single or chained requests.
Depending on whether you want to perform the test from outside or inside your network, tests can be run from both managed and private locations. Also, it can be scheduled, executed on-demand, or integrated straight into your CI/CD processes.
- HTTP Test
HTTP tests allow you to submit HTTP calls to the API endpoints of your applications to validate replies and set conditions like total response time, expected status code, header, or body content. - SSL Test
SSL tests enable you to keep track of the validity and expiration of your SSL/TLS certificates to ensure secure connections between your critical services and users. If your certificate is set to expire or has been compromised, Atatus will send you an alert with details on the failure, allowing you to immediately identify and resolve the problem. - TCP Test
TCP tests allow you to see if low-level TCP connections can be created on a particular host's ports, assuring the availability of important services like SSH (22), SMTP (25), DNS (53), VPN over HTTPS (443), and any custom services that use other ports. Track the performance of your network applications with built-in response time data and receive notifications in the event of unexpected slowness. - DNS Test
Using any nameserver, DNS tests allow you to monitor the resolvability and lookup times of your DNS records in real-time. Atatus sends you an alert with details on the issue if the resolution is unusually slow or a DNS server responds with unexpected issues, allowing you to quickly identify and fix the problem's primary cause. - ICMP Test
ICMP tests make it simple to keep track of your hosts' availability and troubleshoot network communication issues. Atatus can detect connectivity issues, above-quota latency for round trip timings, and unexpected changes in security firewall configuration by asserting the values received from one or more ICMP pings to your endpoint. The tests may also keep track of the number of network hops necessary to connect to your host, as well as view traceroute findings to learn more about each network hop along the way.
You may also use multistep API tests to chain HTTP requests to validate critical service workflows from beginning to end. Synthetic Monitoring provides comprehensive coverage for debugging system performance at each network layer, allowing you to ensure that not only are your services performing optimally, but also that any conditions you specify, such as response or lookup times, HTTP response code, network hops, and more, are met.
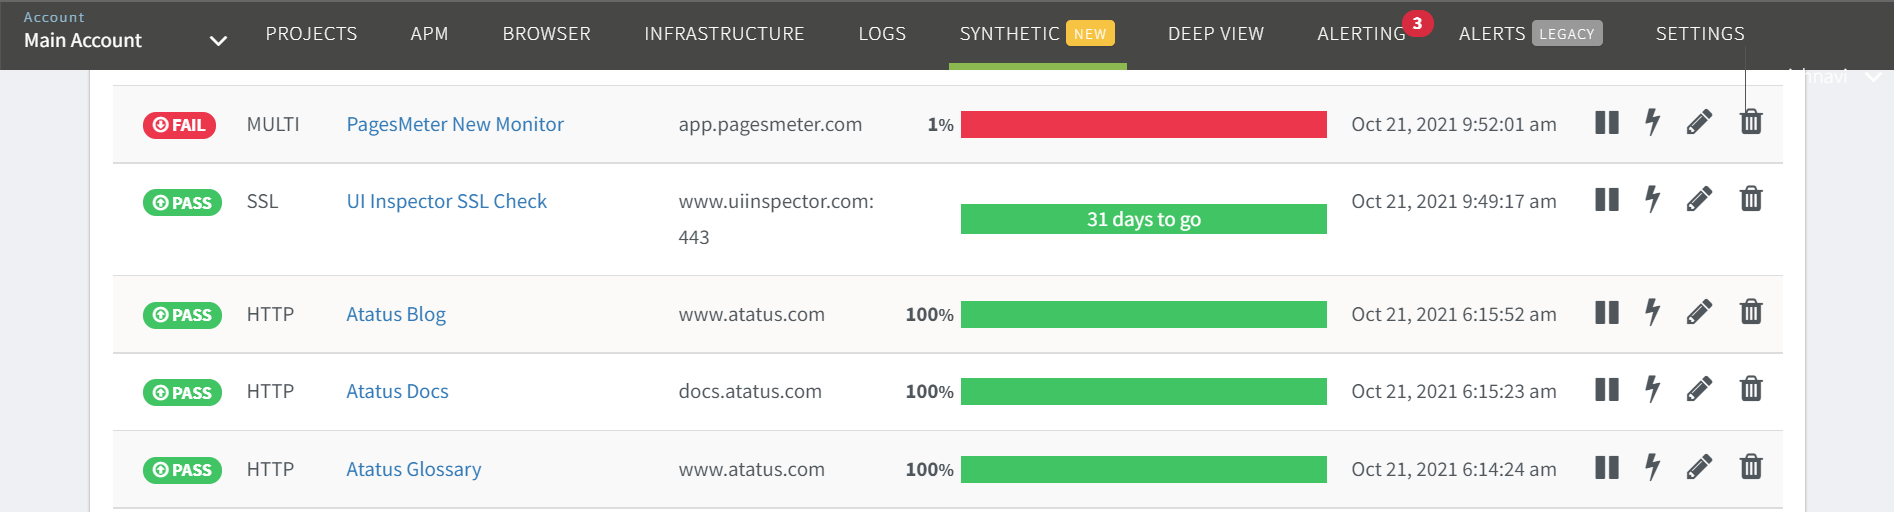
#2 Search and Merge
On the application, you can find, access, and manage all of your tests.
You can quickly discover the tests that matter to you, get an overview of your application's condition with the global uptime and response time graph, and manage your tests with bulk functionalities.
- Bulk Management
Click several individual test checkboxes in the table to bulk manage your Synthetic tests or click the checkbox next to State to select all the test checkboxes on the page. Once you've made your selection, click Run Tests Now or Delete to run or delete all of the Synthetic tests in bulk. - Options for the Action Tray
When you drag your mouse over a test in the table, options like Pause, Run Test Now, Edit, and Delete will appear.
#3 Troubleshooting
Atatus Synthetic Monitoring gives high-level performance and reliable details by simulating a user's perspective of your application. This might help you jump-start your investigation. A Synthetic test alert can direct you to the precise application, endpoint, or geographical location that is having problems.
With a single click, you can dive down and find the root cause for every single request, as well as analyze pertinent host-level data and logs. Because Synthetic Monitoring focuses on finding symptoms rather than causes of performance issues, warnings based on Synthetic Testing can catch a wide range of problems without the need to manually configure checks for each possible failure condition.
#4 Alerting
Once Synthetic Monitoring is enabled, you can utilize the alerting feature to notify your teams of any issues that may affect your users, while limiting false positives. From Synthetic testing to your alerts, you may create finely adjusted alerts depending on your data. Additionally, our built-in integrations with collaboration platforms such as Slack and PagerDuty guarantee that notifications and alerts are routed to the right user.
#5 End-to-end Visibility
End-to-end visibility is provided by synthetic tests, which ensure that end users can conduct critical business transactions including browsing your homepage, signing up, and logging in. Misconfigured DNS, CDN, or web server settings can cause your application to appear to be functional internally yet be unreachable to a portion of your customers.
#6 Security
Atatus has put in place and maintains necessary administrative, physical, and technical safeguards to protect the confidentiality, integrity, availability, and privacy of our information assets and systems, as well as the data of our customers. Furthermore, Atatus promises to test, assess, and evaluate the efficiency of its Information Security Program on a regular basis to ensure the security of information processing procedures by design.
How Atatus Synthetic Monitoring Will Help Your Business?
It's simple to get started with Atatus Synthetic Monitoring, and it doesn't require any changes to your website's code. It lets you set up monitors for any resource you wish to track, and once you've established a baseline, you can set up alerts to be triggered when particular criteria are fulfilled.
Our synthetic monitoring tool allows you to collect data on total response time, DNS lookup time, connected time and time to the first byte, HTTP response codes, downtime, availability, and a variety of other website performance metrics. All of this data is then shown in simple dashboards that provide a complete view of your entire website's performance. Furthermore, they give you sufficient data to quickly diagnose and pinpoint the source of your problems.
Every synthetic transaction is triggered at a changeable interval from several sites we've set up throughout the world, which may be set to 1m, 5m, 10m, or 15m. This allows you fine control over how often these tests run and, if necessary, the ability to suspend them entirely.
Conclusion
Most businesses nowadays rely on one or more cloud-based or SaaS services. Organizations can access and consume a cloud-based or SaaS service, but there is no mechanism for agents to be installed on the service provider's end. Even if the cloud or SaaS service provider offers monitoring consoles and APIs, they do not give an objective means to track the service's performance.
Synthetic Monitoring is the only unbiased approach to evaluate cloud and SaaS service performance, and the findings of synthetic monitoring may be used to compare performance to service levels provided.
Schedule a demo or sign up for a free trial today to discover more about how Atatus can help you take your Synthetic Monitoring to the next level.
#1 Solution for Logs, Traces & Metrics
![]() APM
APM
![]() Kubernetes
Kubernetes
![]() Logs
Logs
![]() Synthetics
Synthetics
![]() RUM
RUM
![]() Serverless
Serverless
![]() Security
Security
![]() More
More