Best Frontend Performance Monitoring Tools in 2025 - How to Choose the Right One
Monitoring is as important as application development to keep an application running healthy for the best user experience. For this reason, a strong monitoring strategy is essential for your company's success, ensuring that metrics such as constant performance, high availability, and accessibility are never a concern. Many businesses neglect the importance of frontend monitoring for their applications.
They consider monitoring to be a component of their operational activities and typically delegate it to an Ops engineer or a sysadmin. It may not be healthy practice because it puts excessive stress on them and may lead to loopholes. It's more crucial to monitor applications on the front end.
We will cover the following:
- What is Frontend Performance Monitoring?
- Why is Frontend Monitoring Important?
- What do Frontend Monitoring Tools Check for?
- Best Tools for Frontend Performance Monitoring
- What Issues can Frontend Monitoring Tools Help With?
What is Frontend Performance Monitoring?
Frontend performance monitoring is a new word for developers, engineers, and product owners who utilize tools to track, maintain, and fix web applications, native applications, and websites. Everything a user interacts with, from the content and menu to APIs and other client-facing components, is included.
Frontend performance monitoring differs from traditional application performance monitoring (APM) solutions in that it focuses on what an end-user sees rather than events that can be retrieved by the server where an application or website is hosted. While these are important to monitor, understanding how users interact with your application is critical to providing a positive experience.
Why is Frontend Monitoring Important?
Several years ago, you could have gotten away with pinging your server a few times a day. Today, that isn't nearly enough. Any outage or impairment of your website performance might have serious effects.
Understanding how the application frontend performs should be the main focus for any engineer, developer, or support professional working on a public-facing website, an internal employee application, or a SaaS product.
We monitor our backend, databases, and infrastructure with a variety of frontend monitoring tools and approaches, and the frontend should be no different. As the complexity of our websites and applications grows, so does the demand for monitoring.
There are few frontend application monitoring tools, even though there are dozens of backend monitoring tools and log aggregation providers. Users can interact with applications using user interfaces, which are growing more complex and powerful.
As a result of this trend, there's a chance that more things may go wrong. Any outage or degradation of an application frontend can result in significant revenue losses, customer dissatisfaction, or wasted engineering resources.
What do Frontend Monitoring Tools Check for?
These are the specific issues that frontend monitoring tools check for:
- Framework-specific Problems
Frameworks like React or Angular are extremely powerful and have greatly simplified the life of developers. Frontend monitoring tools will provide extra reports for issues with these frameworks’ capabilities, such as the application state. - JavaScript Errors
JavaScript is required for the majority of web applications and web pages to work. As a result, one of the basic aims of a frontend monitoring tool is to discover JavaScript errors, their frequency, and the severity of their impact. - Network Request Failures
In order to function, websites and web applications must interact with or rely on dozens of external services, as well as sending thousands of requests to the server on which they are hosted. The HTTP requests and responses that a user initiates will be recorded by frontend monitoring tools. - Performance Issues
Frontend APM tools will track performance metrics including average time to load a page/element, average server response time, time to first paint, and more. - User Experience Issues
These technologies will also monitor for "rage clicks," which occur when a user clicks on an element many times in a short period. They'll also check to see if certain elements are rendered properly or if a user is stuck in a navigation loop.
Best Tools for Frontend Performance Monitoring
Let's get started with the list of Frontend Monitoring Tools.
#1 Atatus
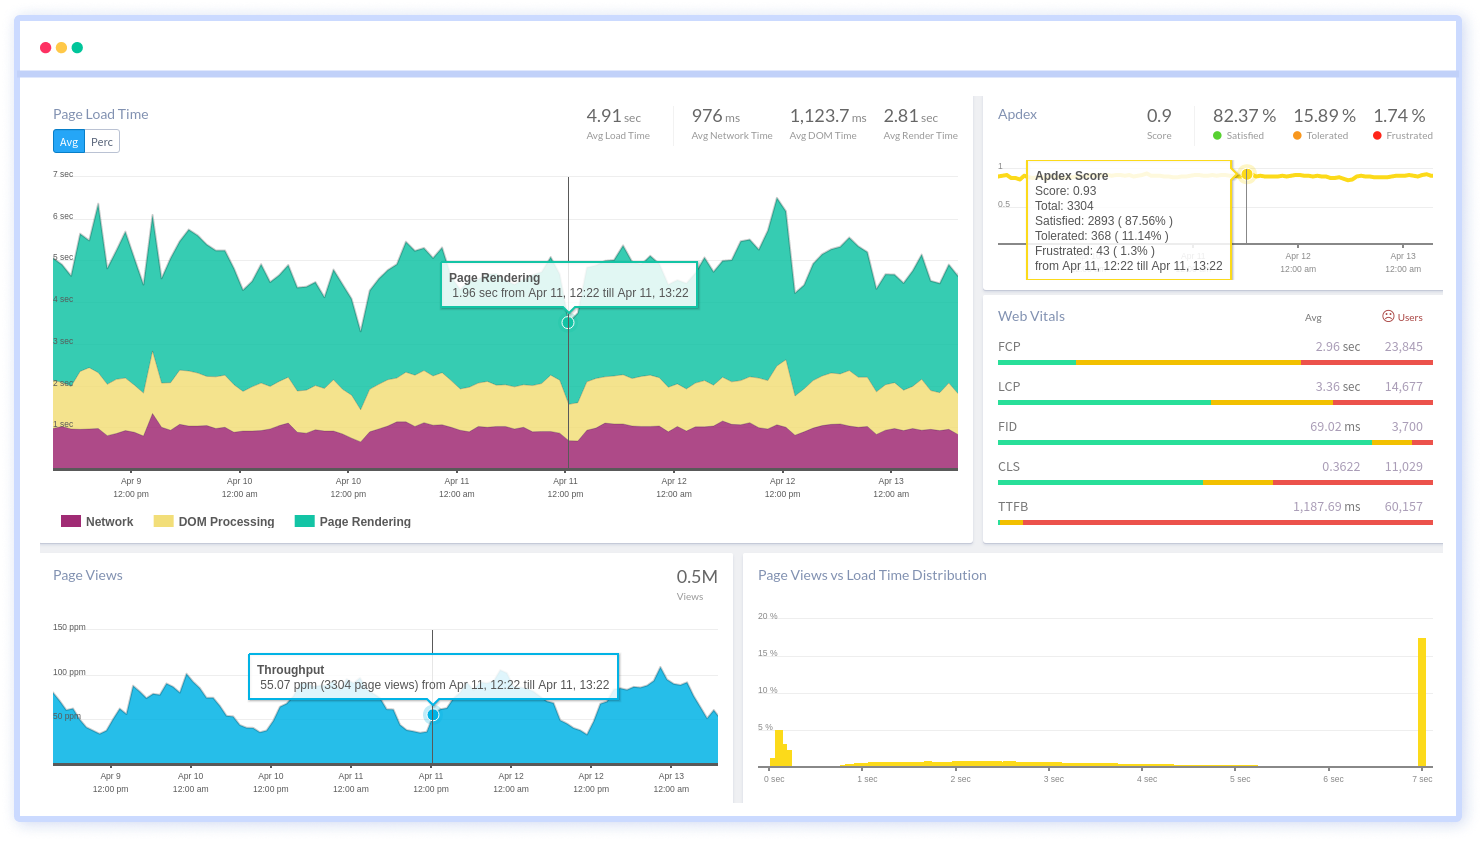
Atatus observability can track application errors, performance, and deployments. It provides end-to-end solutions which is a simple and lightweight tool that you can quickly set up and start using. It sends you real-time alerts the minute an error occurs in your application.
Atatus ensures that your teams get a comprehensive picture of all performance metrics required to produce high-quality, reliable software. As soon as an issue arises, determine who, when, and what caused the performance bottleneck.
Real User Monitoring improves end-user performance by identifying and resolving complicated frontend performance issues such as slow page loading, delayed static assets, and ajax requests. Track and resolve JavaScript errors that have an impact on your customers' experience.
It monitors the health of your applications and receives notifications when there are issues with the user experience. Apdex (Application Performance Index) scores can be used to measure frontend and backend performance as well as user satisfaction.
It resolves performance or availability issues before they affect your customers. Atatus offers a variety of notification channels through which you can send and receive alerts and notifications.
Features:
- Real-Time Monitoring
- Full transaction diagnostics
- Performance control
- Root-cause diagnosis
- Trace individual transactions
- Graphs in real-time with Google’s core web vitals
Pricing:
We offer a 14-day free trial with no credit card policy. The APM plan starts from $0.07/month, RUM starts from $1.96/month for 10K views, the Log monitoring plan starts from $2/month, and Synthetic starts at $1.5/month.
#2 Sentry
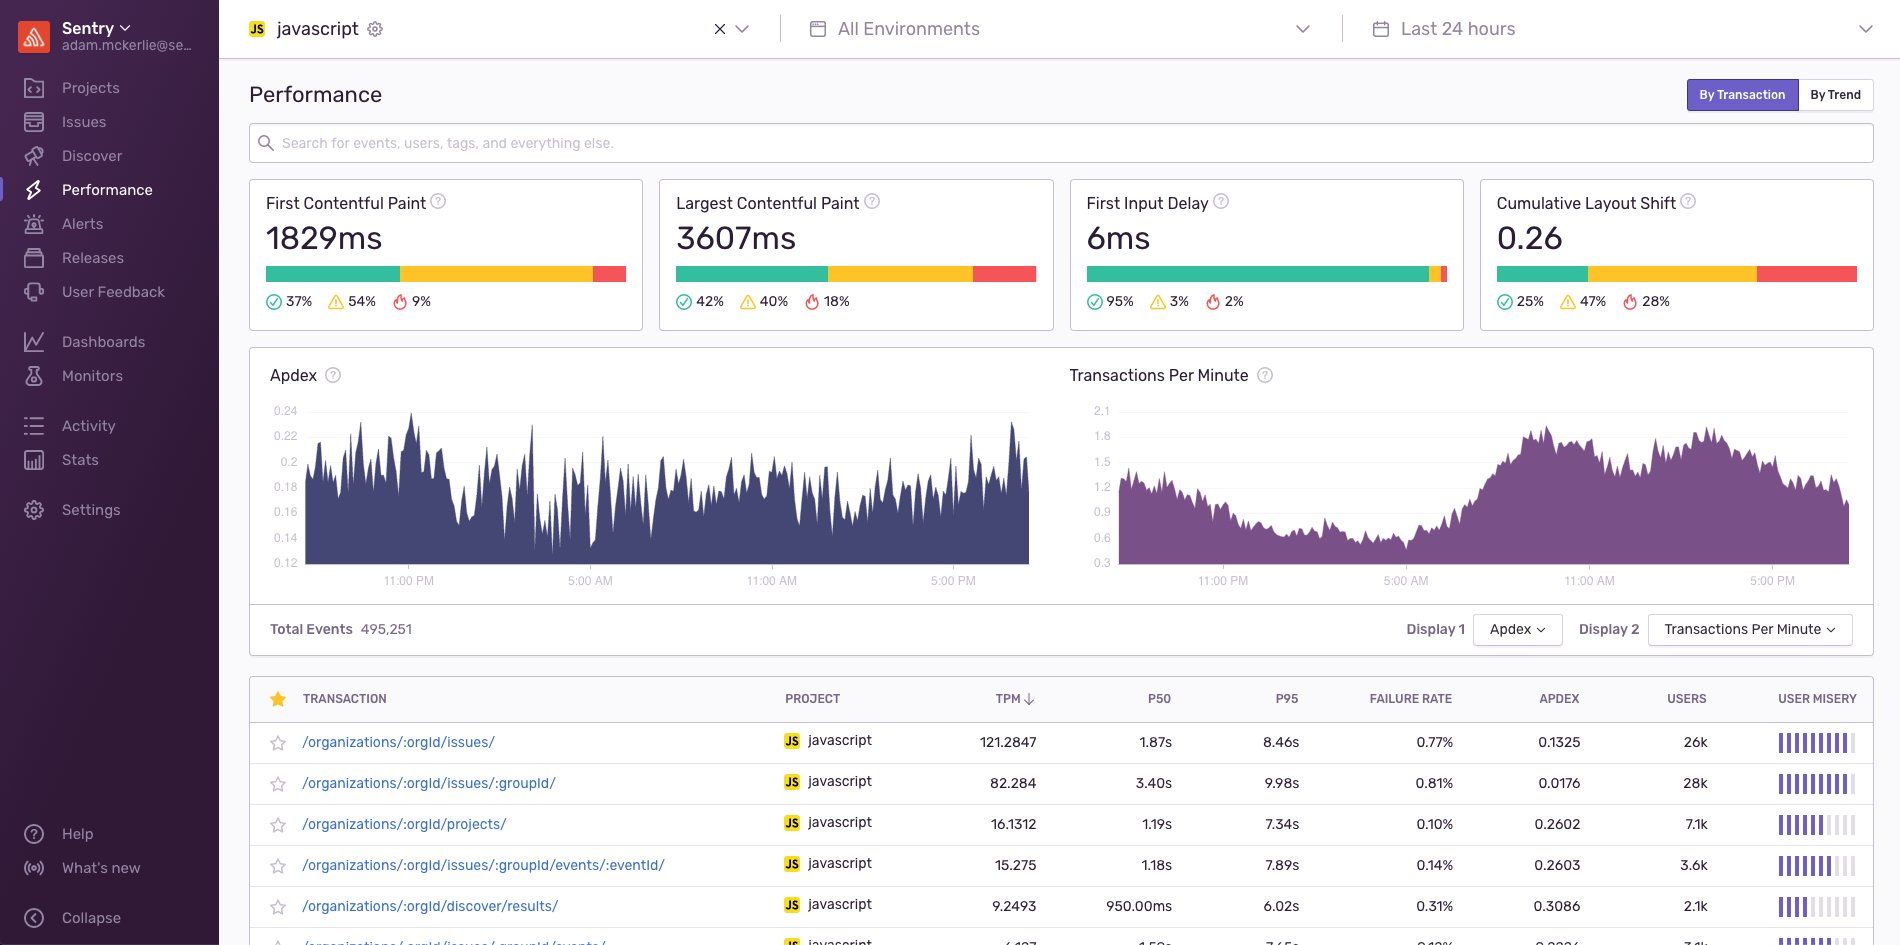
Sentry gives engineering teams the tools they need to find and fix errors that affect users. Sentry notifies you when your application crashes or runs slowly, as well as how it performs, allowing you to drill down into the areas that need your attention. You would address the issue that would have eventually led to the error rather than the error itself.
The performance view displays how many transactions are initiated, how long they take and provides an Apdex score, which is the ratio of tolerable and satisfactory response times to all response times.
Sentry supports server-side programming languages, although it doesn't have a server-specific logs integration. You can go down into different transactions to view a breakdown of all the resources linked with them. However, if you're hoping for an end-to-end monitoring solution, you could be disappointed.
Features:
- Installation is simple
- Google's Web vitals are used to offer performance information
- Transaction tracing is available
Pricing:
Sentry offers four different price options, including a free tier. The paid plans range from $29 to $2120 per month, depending on the number of errors tracked, transactions, and the size of the field associated with those errors. There is a free 30-day trial that allows you to try out all of their services without spending any money.
#3 Pingdom
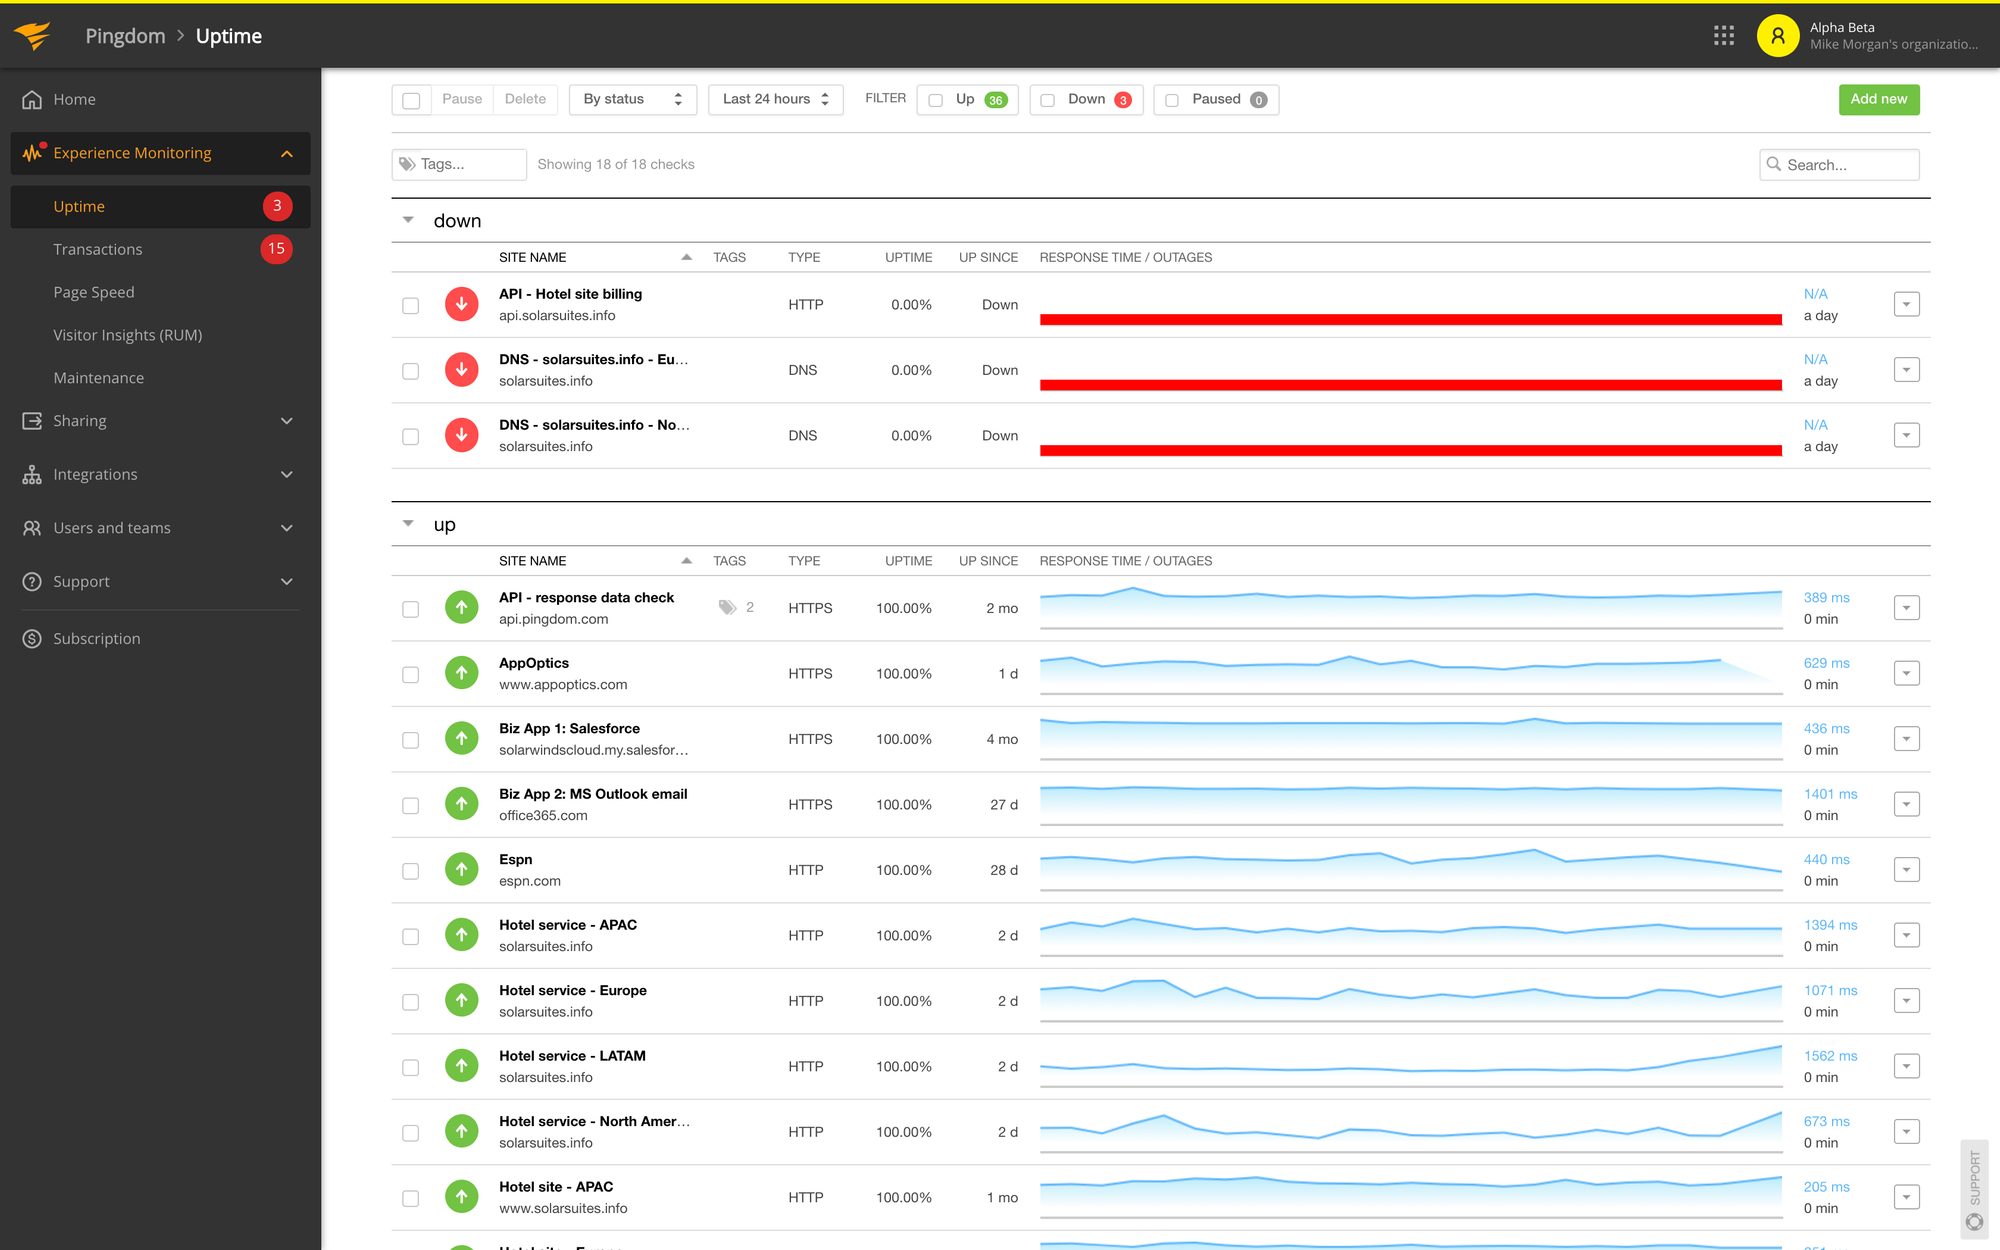
Pingdom is an uptime monitoring service that includes SSL monitoring and real-user monitoring, among other things. Pingdom will notify you of a service disruption or degradation using a configurable alerting mechanism.
The uptime monitoring view will show you how long it takes a page or resource to completely load. If an error occurs, you may use their incident reports manager to dig into the transaction to find the source of the issue. In this case, the traceroute is handy.
When it comes to performance reporting, the page speed area is where you should head if you need detailed information about your websites, such as load time, page size, number of requests, and a performance score, which will give you a quick image of how well your website is performing.
The waterfall chart, which presents all assets in a timeline and makes it easy to identify where and what you need to optimize, is one of the most valuable elements here. Pingdom concentrates solely on RUM and Synthetics, with no support for log management, leaving you with only half of the picture when it comes to troubleshooting performance issues.
Features:
- Low pricing
- Notifications by SMS and email
- Customizable alerts are also available
Pricing:
Pingdom offers a 14-day free trial, and pro plans start at $15 per month for synthetic monitoring with 10 uptime monitors, 1 advanced monitor, and 50 SMS notifications, and $15 per month for actual user monitoring with 100K page views.
#4 Site24x7
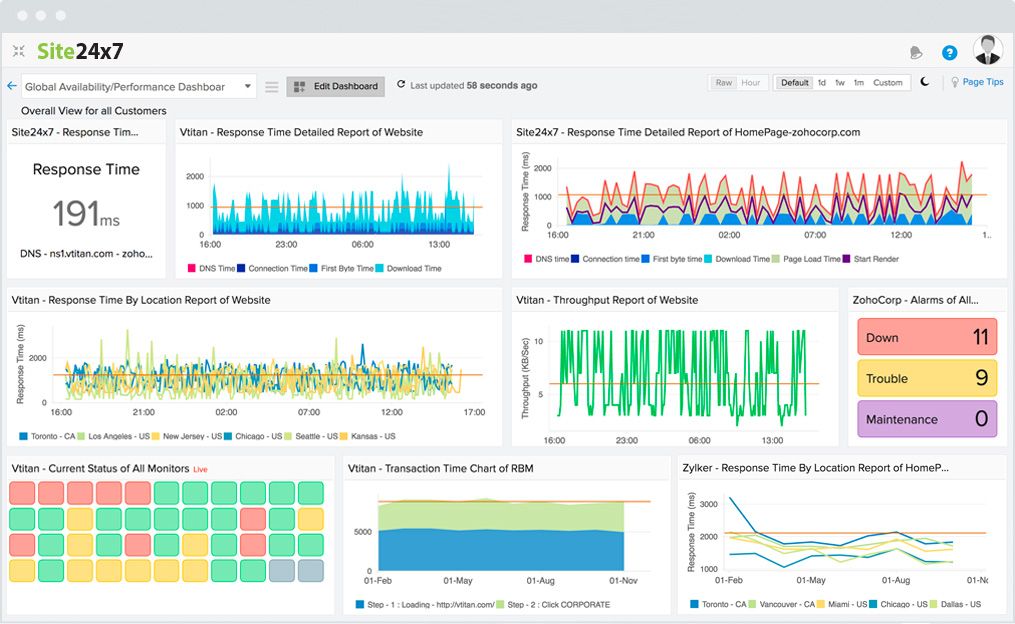
Site24x7 is another tool to see how your application or project performs in the real world. Site24x7, which bills itself as a solution for availability and user experience monitoring, has a lot of cool features including server monitoring, cloud management, RUM, and more.
Site24x7 includes a Web section where you can create monitors for your websites or APIs when it comes to frontend performance monitoring. These monitors will ping your desired resource to gather information such as availability, response time, downtimes, and so on.
Site24x7 REST API section will also track SLA compliance, which will be useful. This view displays a breakdown of your availability and reaction times by location, as well as a history of all your breakdowns in the previous 24 hours and information on throughput and response times.
Site24x7 offers cloud-based log management as part of their product selection, allowing you to have a centralized location for log monitoring. This will make debugging infrastructure issues much easier by giving you actionable information on things like exceptions, timeouts, delays, and other errors.
Features:
- Excellent monitoring system
- Real user monitoring tool
- Comprehensive API transaction monitoring
Pricing:
Site24x7 offers a 30-day free trial period with no credit card required and four different plans ranging from $10 to $499 per month.
#5 LogRocket
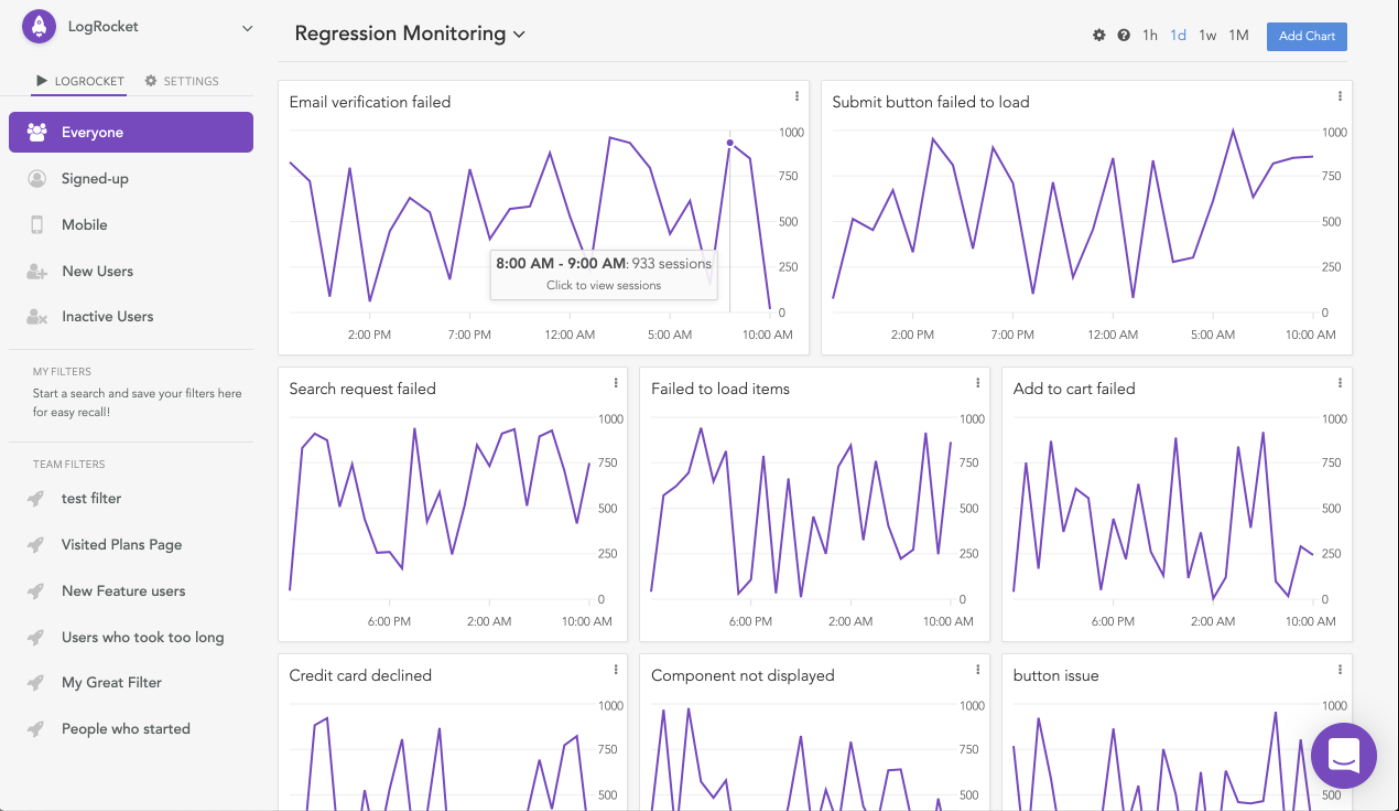
For frontend monitoring, LogRocket offers a JavaScript SDK that intercepts browser operations and delivers them to a remote server. LogRocket doesn't provide logs or transactions on its own, but it does have some third-party interfaces with services that do.
LogRocket additionally maintains track of JavaScript errors in the application and reports on the details of the error, such as the impact on related systems, stack traces, and user sessions where the error happened. As a result, the developer can prioritize the issues and solve the most significant ones.
A developer mode allows you to examine each resource that the user has downloaded. There's also a console log that records what the user saw at the time of the incident, allowing you to see the issue without having to recreate it.
LogRocket features a basic alerting system that allows you to be notified through Slack or email anytime a new error occurs. This system can be adjusted to fire on specific errors or when a given number of errors have occurred.
Features:
- Support for Intercom and Zendesk
- Examine logs, network traffic, and Dom components.
- Video playback of the incidents
Pricing:
LogRocket offers a 14-day risk-free trial, a free tier with 30 days of retention and 1000 sessions, and a $99 Pro version with 10k sessions per month.
#6 AppSignal
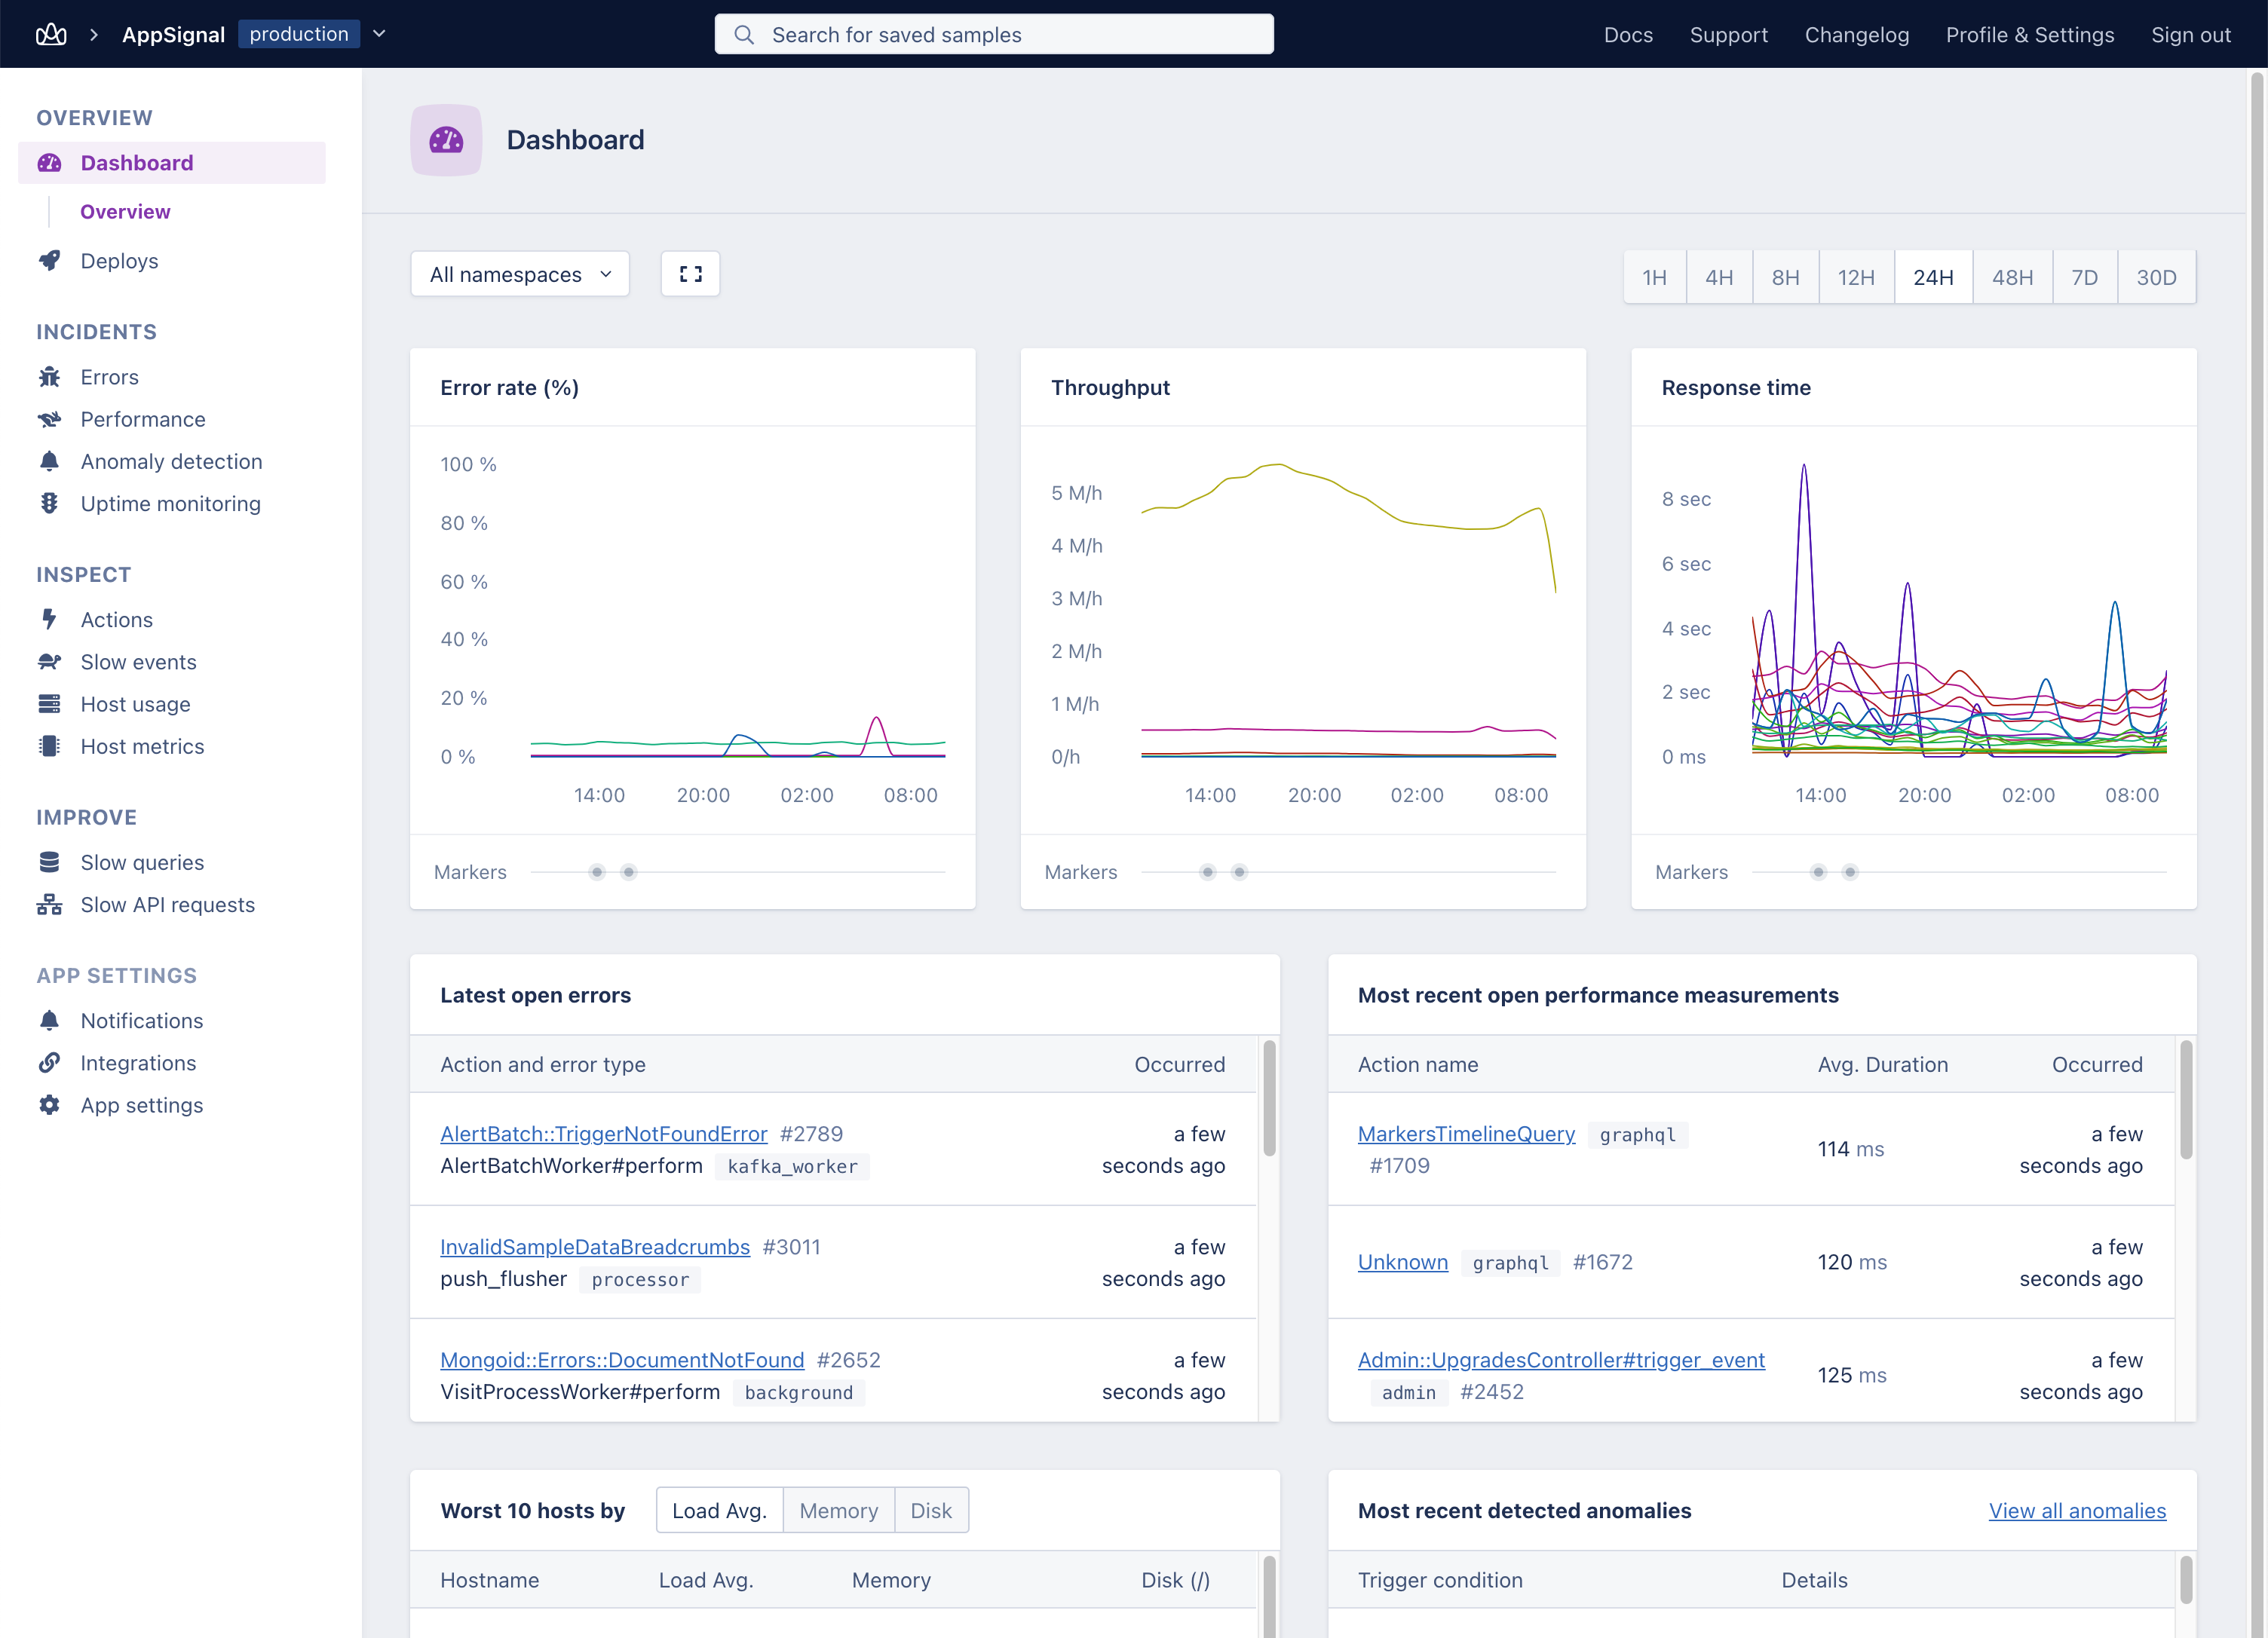
AppSignal is a tool that gives you insights into your application performance on both the frontend and the backend, as well as host monitoring, error tracking, and metric collection. With readily customized dashboards, you can keep track of payload sizes, database queries, revenue, and much more.
The lightweight Rust-powered agent makes AppSignal simple to set up. It keeps track of the activities taken by your applications and displays a concise summary of the metrics related to them.
You'll see details about CPU usage, memory allocation, and network connectivity, as well as an Event Timeline that explains what the code is doing. This will help you figure out which parts of your application are demanding your performance and which areas need to be improved.
It has an anomaly detection system with a few prebuilt warnings that go out whenever anything isn't quite right. This is useful when you're just getting started and don't know what to look for, or when you're working under a lot of pressure and have too many things to keep track of.
Features:
- Low pricing
- Simple installation
- Anomaly detection
- Out of the box alerts
Pricing:
AppSignal offers a 30-day free trial and fair pricing depending on request volume, with prices ranging from $19 per month for 250K requests to $2249 per month for 2500M requests.
#7 Raygun
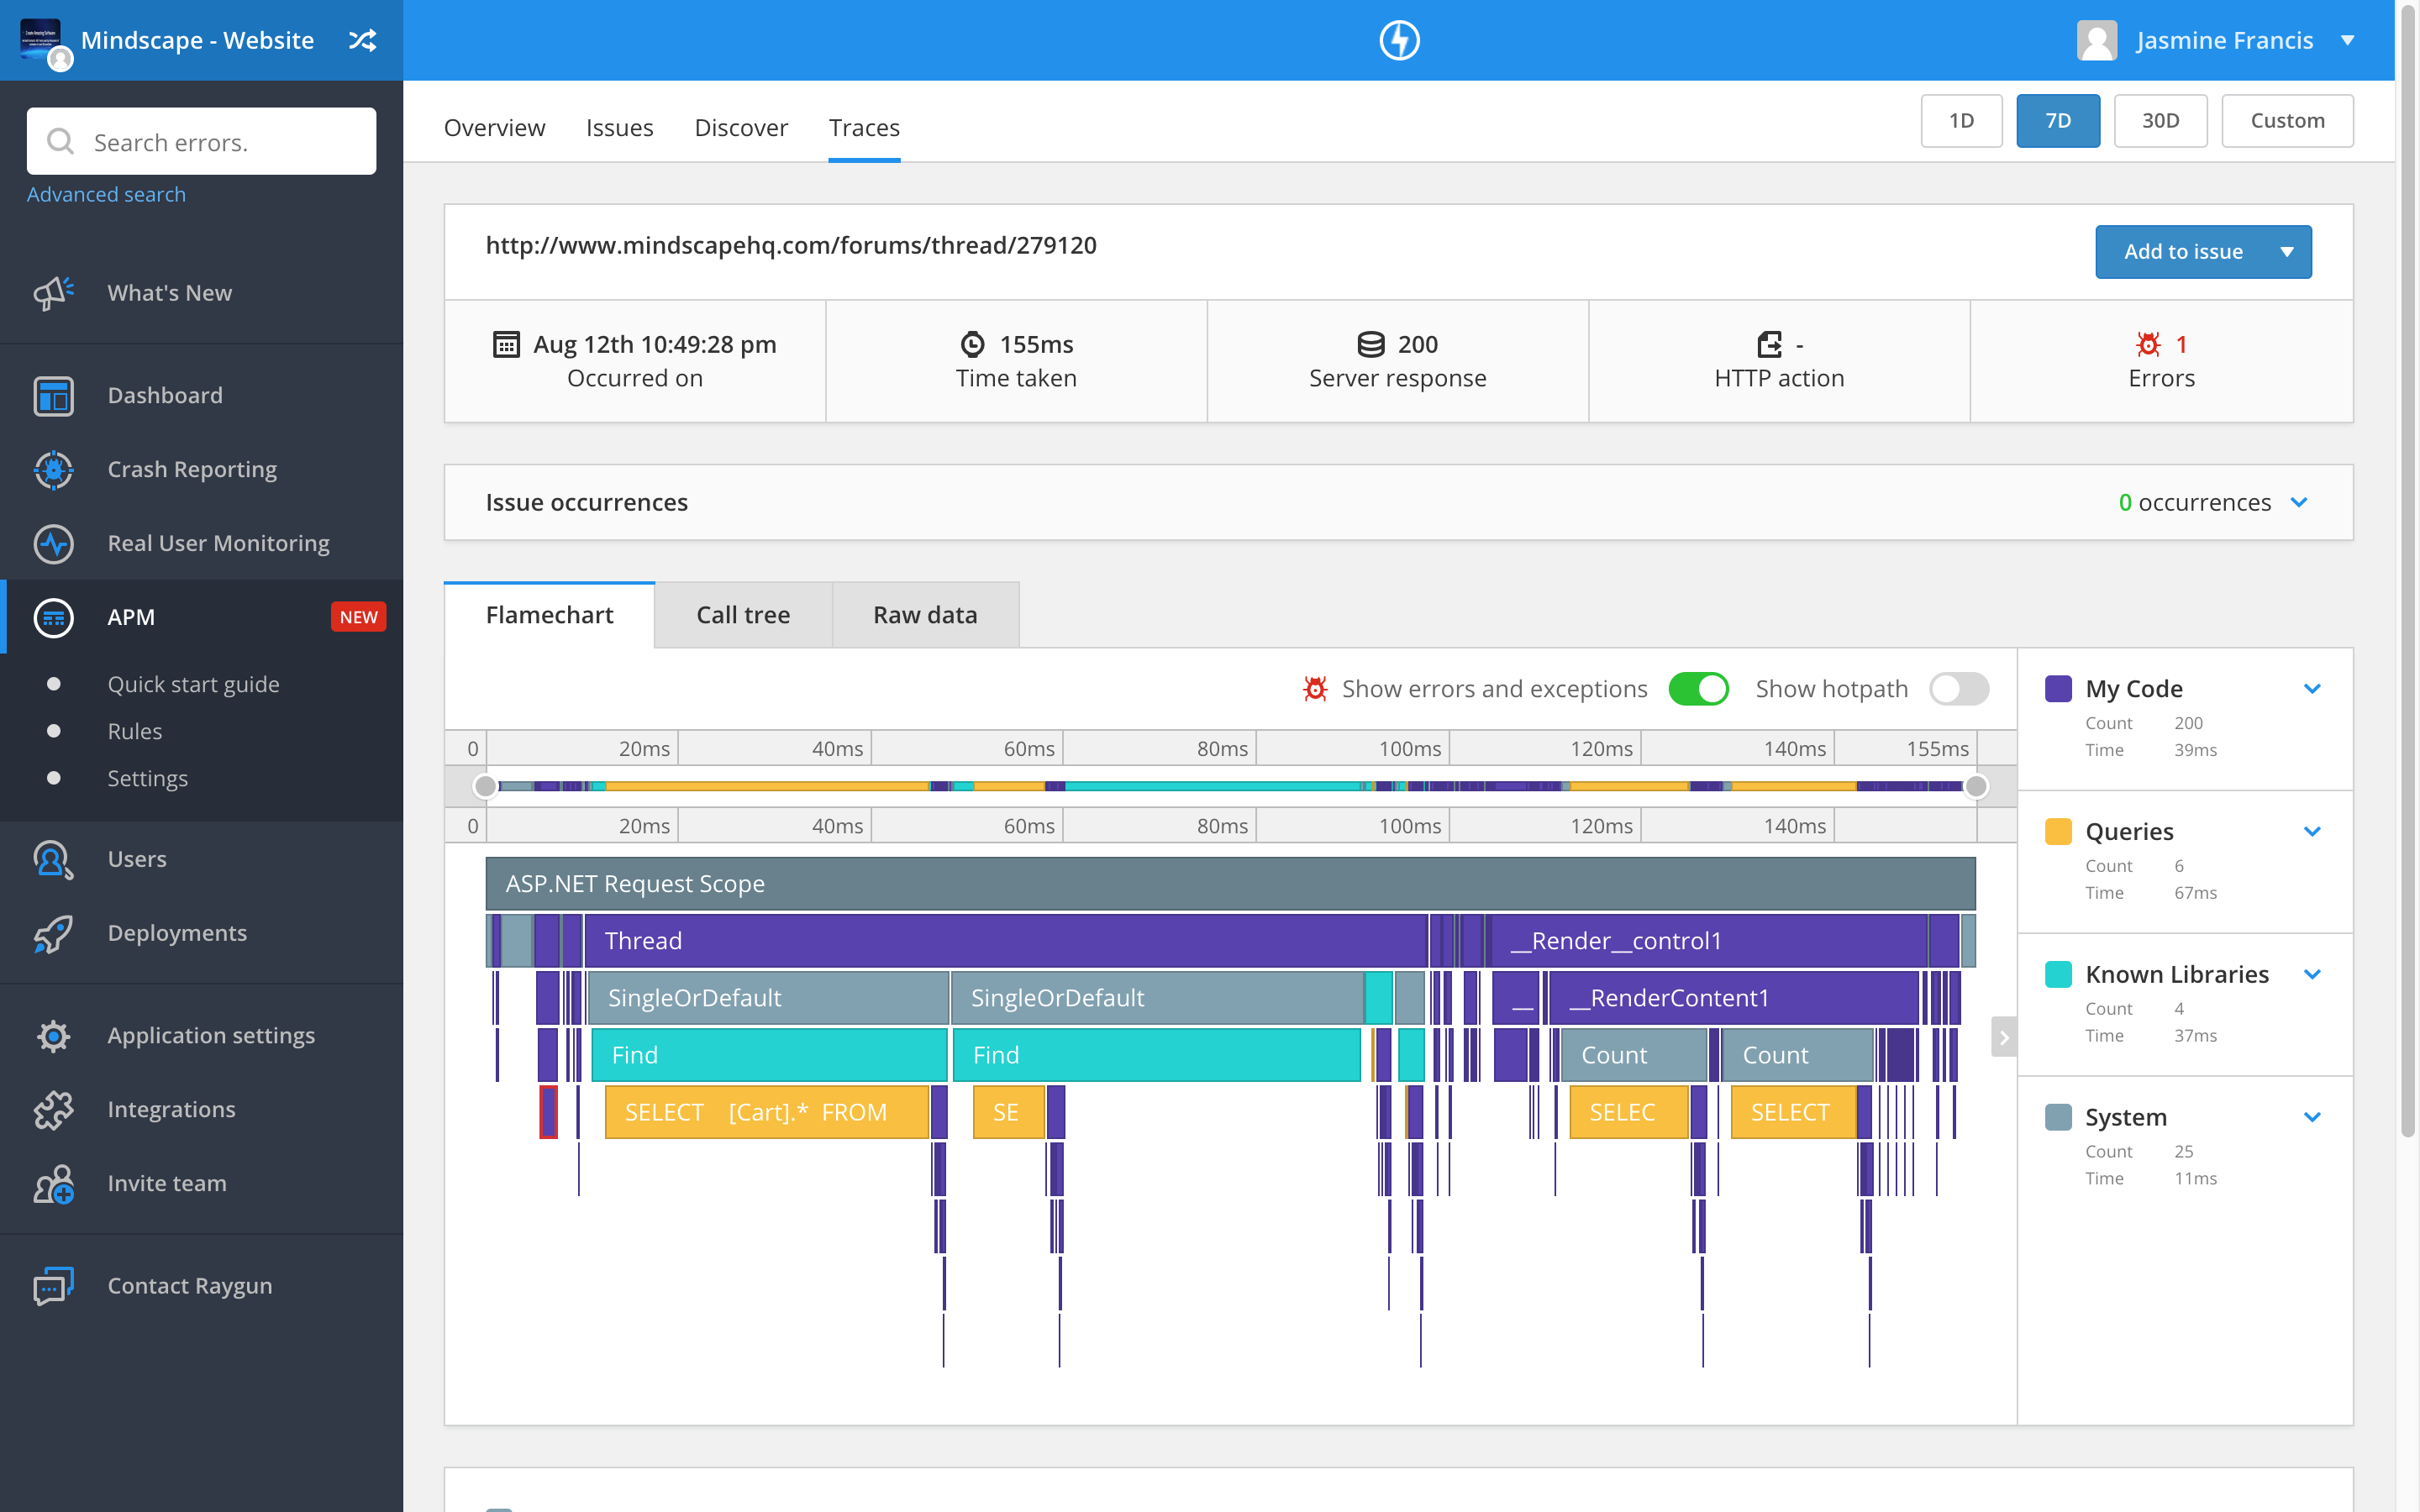
Raygun discovers actionable data from your website to uncover and overcome your performance bottlenecks. This will make it simple to diagnose and improve frontend performance.
It also displays the whole stack trace, the browser and its version, the environment, the OS, the host, the class name, and other information. You can also identify the change or release that caused the issue. Raygun allows you to construct custom dashboards to track data in the way you want, as well as view error rates and regressions for new codes.
If you want to use Raygun to fix performance issues, you should familiarise yourself with their real-time user monitoring platform, as it will be your primary tool for diagnosing frontend difficulties.
Their little JavaScript SDK keeps track of everything on your website, including page speed, load times, the number of current sessions, and active users. You may even view individual user sessions in real-time, tracing their path to see whether pages are loading slowly or not at all.
Every page load includes a resource waterfall that shows you a breakdown of each asset and how it affects frontend performance. You can then deduce the factors that are generating the performance issues, giving you an idea of how to resolve them.
Features:
- User-friendly tool
- Real user monitoring tools
- Affordable pricing
Pricing:
Raygun offers three packages: APM, which starts at $8/month and includes 10K traces, Real User Monitoring, which is $8 for 10K sessions, and Error Monitoring and Reporting, which costs $4/month and includes 10K traces. You can also use their 14-day free trial to try out all of their features.
#8 SpeedCurve
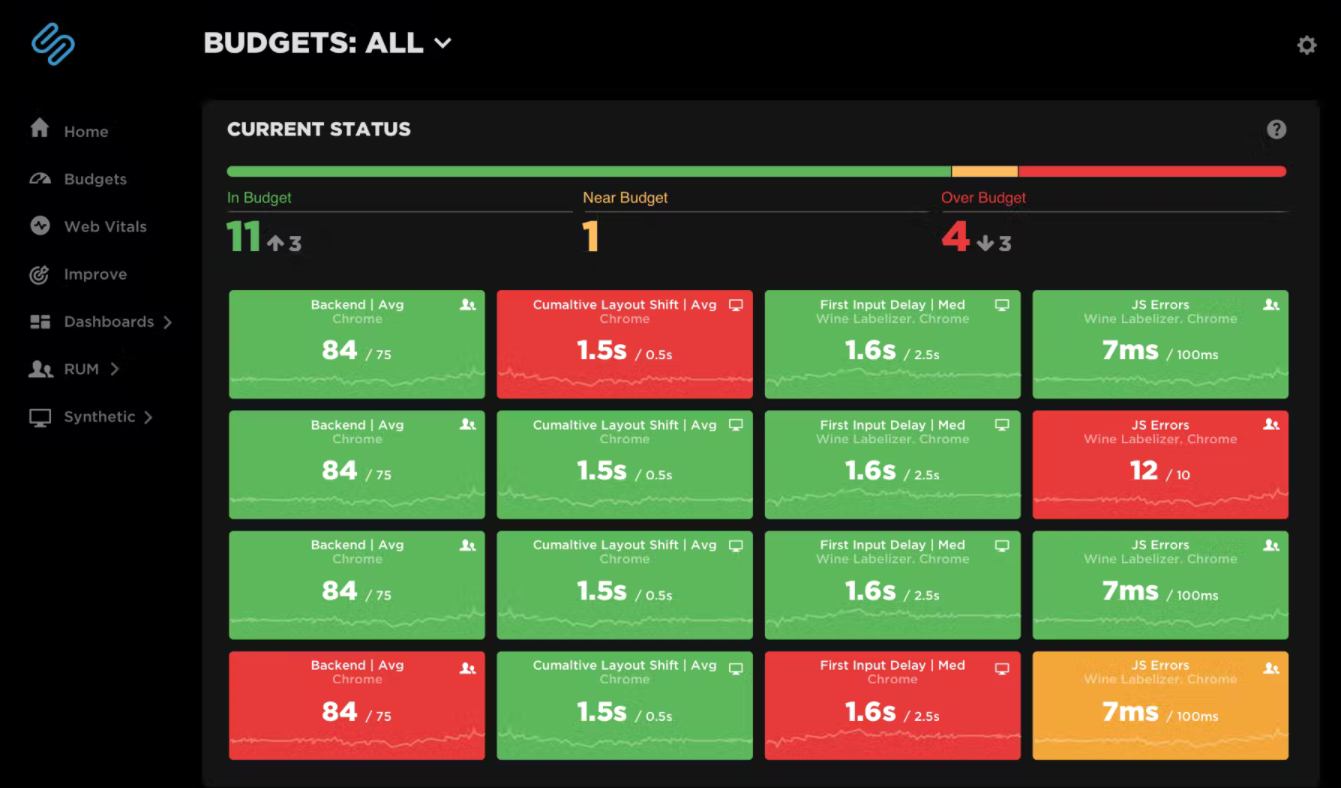
SpeedCurve gathers data from real user interactions and compares it to your competitors. Their real-time user monitoring tool, LUX (which stands for Live User eXperience), provides you with all of the basic RUM measures like First Input Delay, Largest Contentful Paint, and Cumulative Layout Shift.
SpeedCurve allows you to set budgets for all of your metrics and then receive notifications if you go over them. These notifications will be sent by email or a webhook that may be integrated into Slack, HipChat, Microsoft Teams, and other platforms.
Their synthetic monitoring tool combines all of your data into a single display, allowing you to examine your performance indicators and gain a better understanding of your website's subtleties.
While you may be able to get by without logs or transaction monitoring using SpeedCurve at first, you'll almost certainly need to invest in a separate solution to help you track down the cause of your issues and defects.
Features:
- User-friendly UI
- Easy installation
- Low pricing
Pricing:
Small, medium and large are the three main pricing categories, with the main differences being the number of page views and synthetic checks performed each month. They range in price from $143/month to $2100/month. There's also a $15/month build your plan, as well as a free trial that lets you try out all of their features.
#9 Rollbar
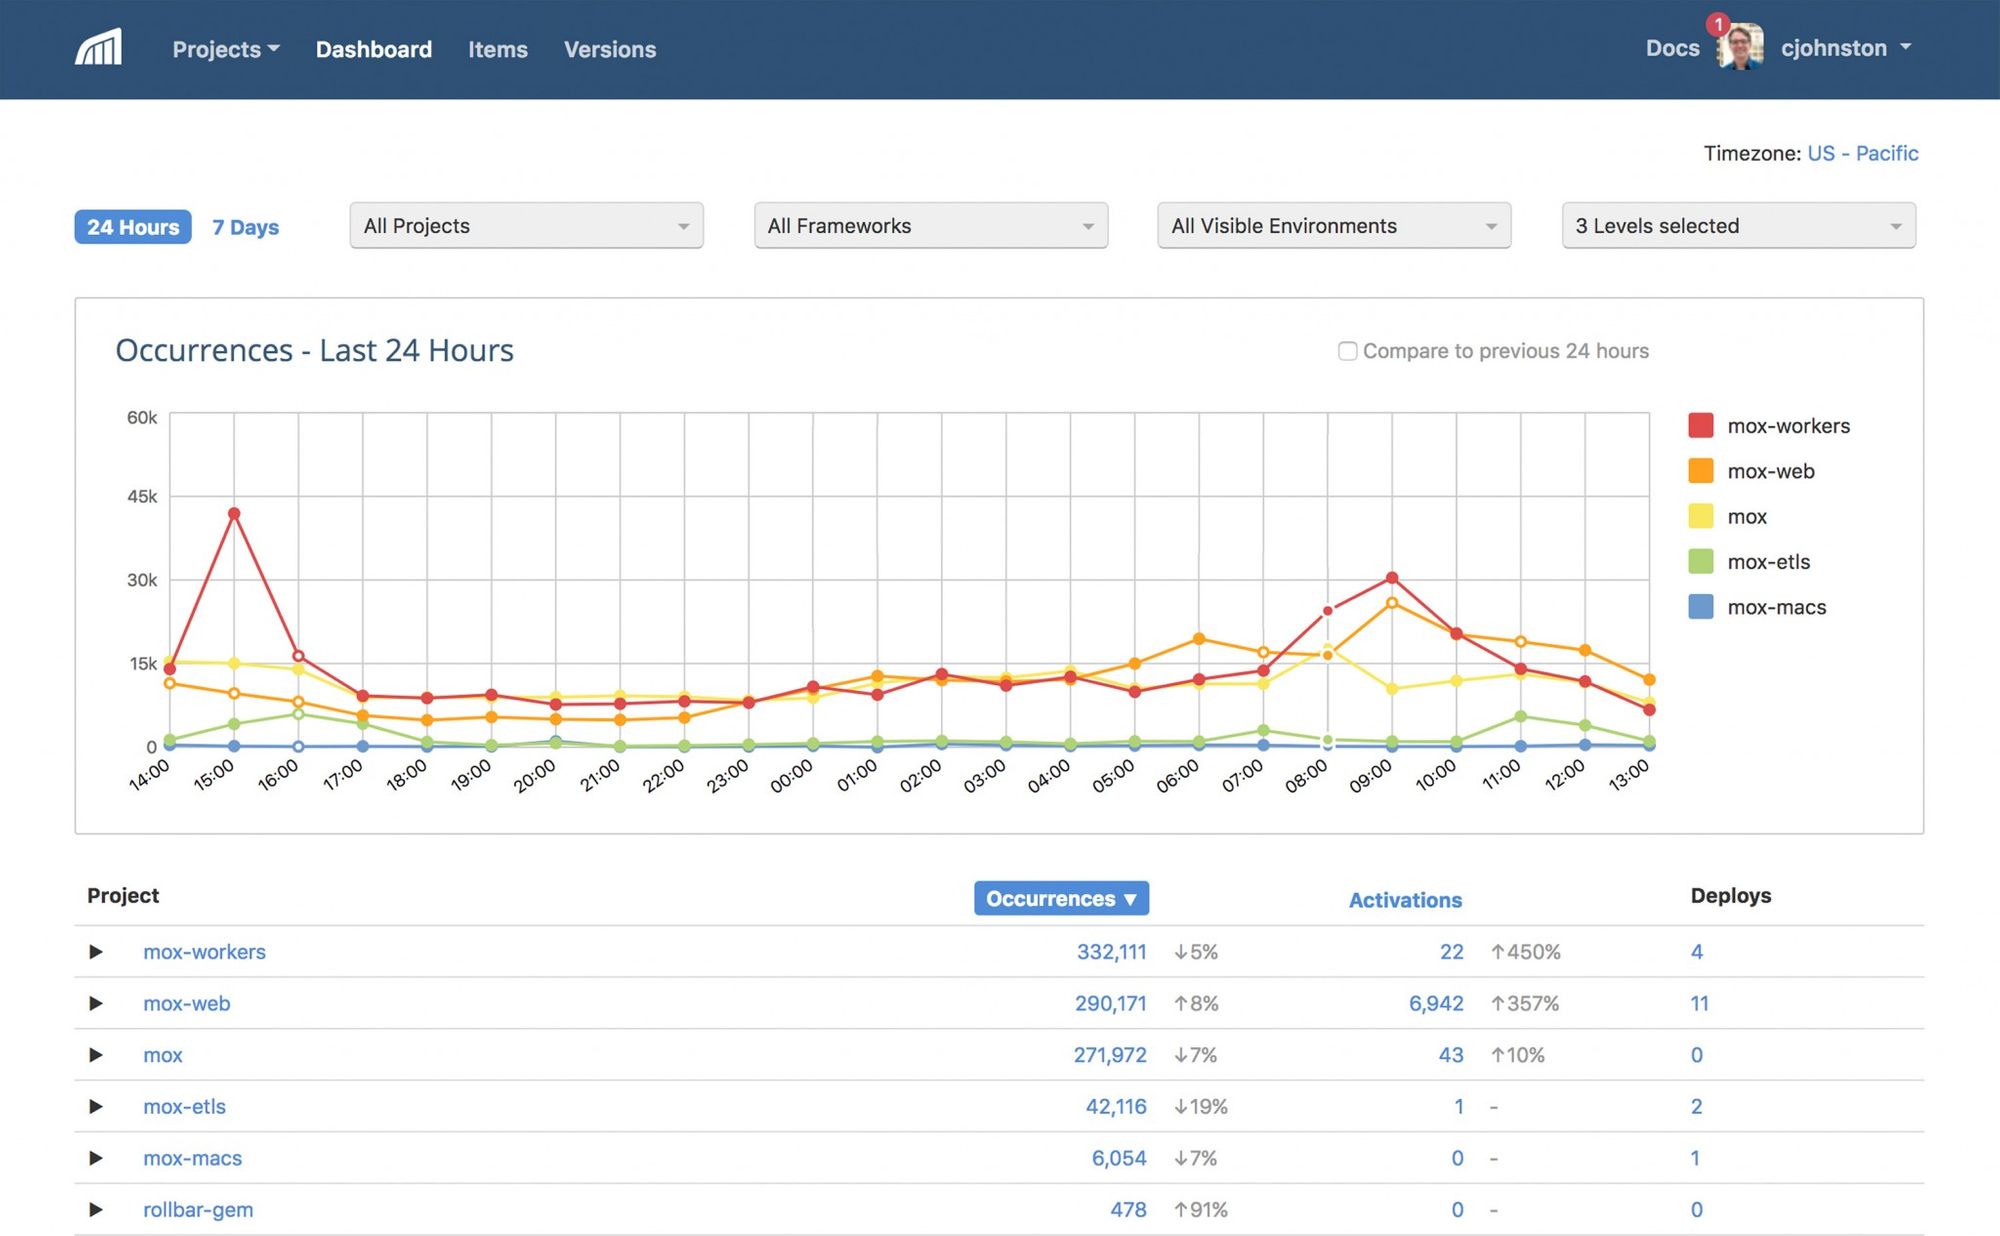
Using Rollbar, errors will be immediately reported as tickets in tools by setting up automated issue tracking and assigning to owners directly. The developers can handle significant errors affecting key customers that occur at low starting frequencies, which are otherwise impossible to identify, due to Rollbar's real-time error stream.
Rollbar offers AI-assisted processes that allow developers to react quickly to errors before they affect users. It displays information such as the number of customers affected by the error, the platforms or browsers affected, whether similar errors have happened in the past or whether a fix is currently available.
Furthermore, Rollbar begins automatically detecting the most recent deployment, which could be the cause of the issue in the source code, stack trace, or commits. This allows the developer to easily discover and visualize the differences.
To reduce noise, the automation-grade grouping tool automatically groups related errors. To keep the alerts relevant, the grouping rules can be readily changed, or errors can be manually combined.
Features:
- Discover in real-time
- Prioritize effectively
- Automate error response
Pricing:
Rollbar offers a free plan and the paid plan starts at $21/month. They also provide enterprise plans for organizations which include SCIM provisioning, priority support and SLAs, custom event volume, and an unlimited number of service links.
What Issues can Frontend Monitoring Tools Help With?
When it comes to evaluating application performance, we recommend dividing our attention into three primary components, all of which we believe are equally important.
#1 Availability
It can be challenging to ensure availability, especially once you've grown large enough and have a larger pool of users from all over the world. Knowing how your users interact with your website will be quite beneficial, which is the ideal condition for implementing real user monitoring solutions.
This type of solution will track the user's progress through the application, providing you with data on how they interact with it and the responses they receive. You'll be able to determine whether you need a faster machine, better scaling, or need to optimize your business logic.
Atatus provides Real-User Monitoring which is a scalable end-user experience monitoring system that allows you to see which areas of your website are underperforming and affecting your users. You can able to understand the causes of your front-end performance issues and how to improve the user experience.

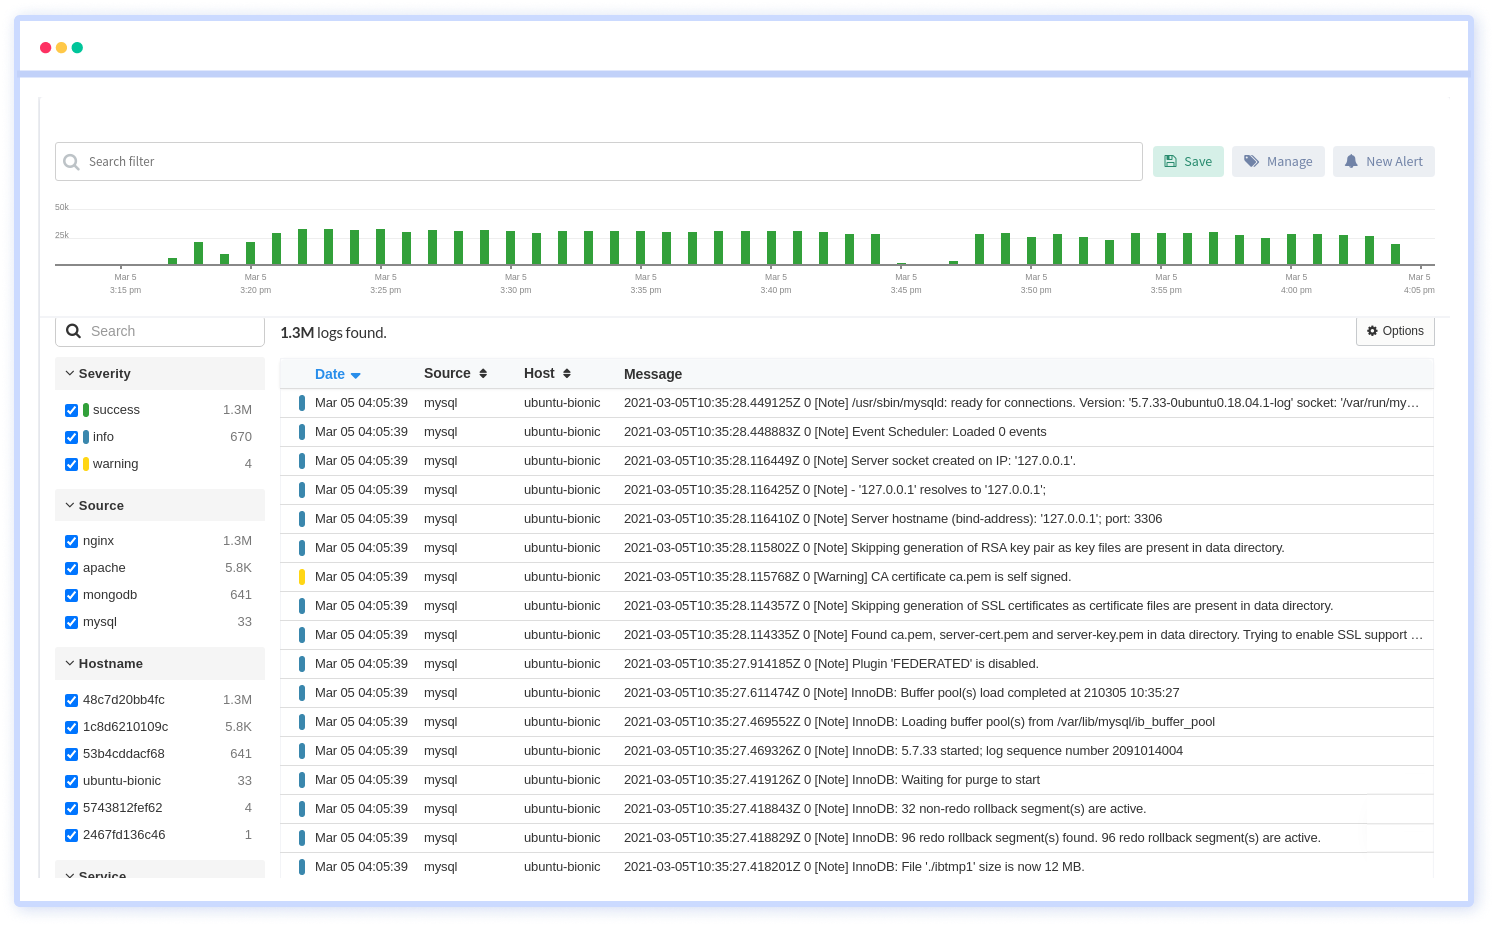
#2 Errors and Functionality
While some of the errors you'll face as a developer can be solved entirely with the information supplied in the console log, others will be more difficult to solve. In some circumstances, your logs will be stored in a single location, but more frequently than not, they will be stored in separate locations, have different timestamps, and likely have different redundancies, making debugging difficult.
Understanding the whole picture requires a solution that can store, archive, and control the quality of your logs. Separate solutions can be used, but combining logging and monitoring into a single platform enables addressing significant issues faster and easier.
Atatus provides a Logs Monitoring solution as a fully managed cloud service that requires minimal setup at any scale and no maintenance. It monitors logs from all of your systems and applications into a single, easy-to-use user interface, helping you to diagnose issues more quickly.
#3 Speed
Slow loading resources will result in bottlenecks and a bad user experience, so they must be addressed as soon as possible. Before you ask how quick a good website should be and how slow is too slow, you should know about Apdex, an application performance index that may help you determine the goal response time.
The number of your resources and the number of requests will have a major impact on the speed of your website. As a general guideline, you should strive to optimize all of your resources and achieve the quickest response times possible.
Atatus helps you in maintaining a decent Apdex score. The graphs of the Apdex score are updated in real-time with Google's core web vitals.
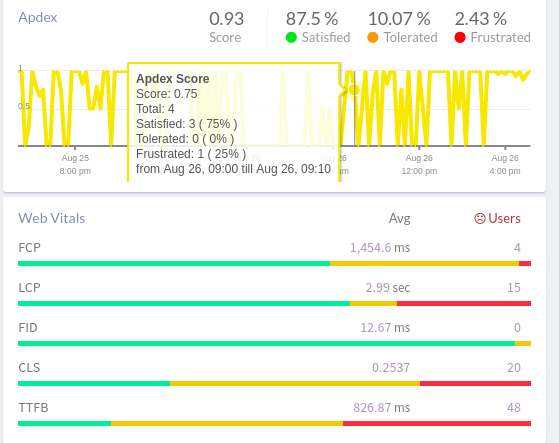
Errors, routes, web transactions, AJAX requests, and sessions can all be measured. Utilize RUM's analytical data to enhance your web application and provide your customers with a world-class user experience.
Conclusion
It's important to include frontend monitoring tools in your business to monitor your application because they're the link between you and your customers, as well as your growth. So, if you want to build a loyal customer base, you must deliver the greatest service possible.
Developing an application takes both creativity and a large number of resources. As a result, undermining its performance and functionality due to a lack of maintenance is the very last thing you want to do. But don't worry: any of these application monitoring tools can help you detect and resolve errors so your application works at optimal performance all of the time.
Monitor Your Entire Application with Atatus
Atatus Observability Platform lets you review problems as if they happened in your application. Instead of guessing why errors happen or asking users for screenshots and log dumps, Atatus lets you replay the session to quickly understand what went wrong.
We offer Application Performance Monitoring, Real User Monitoring, Serverless Monitoring, Logs Monitoring, Synthetic Monitoring, Uptime Monitoring, and API Analytics. It works perfectly with any application, regardless of framework, and has plugins.

Atatus can be beneficial to your business, which provides a comprehensive view of your application, including how it works, where performance bottlenecks exist, which users are most impacted, and which errors break your code for your frontend, backend, and infrastructure.
If you are not yet an Atatus customer, you can sign up for a 14-day free trial.
#1 Solution for Logs, Traces & Metrics
![]() APM
APM
![]() Kubernetes
Kubernetes
![]() Logs
Logs
![]() Synthetics
Synthetics
![]() RUM
RUM
![]() Serverless
Serverless
![]() Security
Security
![]() More
More